


Table of Contents
Table of Contents
Are you tired of hearing complaints from your users about slow network speeds, laggy video calls, and frustratingly long load times? Are you ready to take control of your network and make sure it's running smoothly and efficiently? Then it's time to dive into the wonderful world of network metrics!
Yes, I know what you're thinking, "Wow, network metrics sound like a real snooze-fest!" But hold on to your Ethernet cables, because measuring network performance can actually be a lot of fun (yes, really!). In fact, monitoring network metrics is like being a detective, constantly on the lookout for clues to help you solve the case of the slow network.
So, grab a cup of coffee (or your favorite energy drink), put on your favorite detective hat, and let's explore 18 essential network metrics that you can use to track network performance and optimize your network for maximum speed and efficiency. Trust me, by the end of this post, you'll be a network performance measurement master!
In this article we’re running you through what is Network Performance, how to measure network performance, what network metrics we should collect to measure network performance, and what tools you should use to monitor network performance.
What are Network Metrics? (or Network KPIs) 
Network metrics are quantitative measurements used to evaluate and monitor the performance and reliability of a computer network. These metrics provide valuable insights into various aspects of network behavior, such as speed, bandwidth usage, latency, packet loss, and other network key performance indicators (KPIs).
By monitoring and analyzing these network metrics, network administrators can identify performance bottlenecks, diagnose issues, and optimize network settings to improve network performance, reduce downtime, and provide a better user experience.
We'll be going through all these network metrics you need to know in this article!


The Importance of Network Metrics
At Obkio Network Performance Monitoring, we are a team of telecommunication experts specializing in performance monitoring. Over the years, we’ve had the opportunity to work and speak with IT professionals on the daily who are experiencing network issues.
When we begin the discussion with clients about monitoring their network performance, the metric that we most commonly hear about is Network Speed. But in the network world as in life, size isn't everything, quality matters too.
For example, just because you have a big Internet pipe, that doesn’t mean that it won't get congested or leak data packets.
So, to be able to answer questions like:
Is my network performing well enough to:
- Ensure a successful migration to the cloud?
- To increase the use of Unified Communication solutions for my business?
- To ensure users can have the best experience when using web applications?
You need to learn how to measure network performance with all of the key network metrics, and that's exactly what we'll be covering in this article.
What is Network Monitoring?
Before talking about measuring network performance, let’s quickly go over the vocabulary surrounding network monitoring. Network monitoring is the process of collecting, analyzing, and interpreting data from a computer network to evaluate its performance and health. The goal of network monitoring is to detect and troubleshoot issues before they can cause network downtime or negatively impact the user experience.
Network monitoring tools can monitor various network metrics, such as bandwidth utilization, packet loss, latency, and other key performance indicators (KPIs). These tools can also generate network monitoring alerts when network issues are detected, allowing network administrators to take prompt action to resolve the issue before it becomes a more significant problem.
Network monitoring can be done using different types of tools, including software-based solutions that run on a network device or a server, hardware-based monitoring appliances, and cloud-based monitoring services. These tools provide network administrators with a comprehensive view of network performance and help them to identify and address potential issues proactively.
Overall, network monitoring is a critical function in maintaining a healthy and efficient computer network, and it plays a vital role in ensuring that network users have access to reliable and high-quality network services.
When we talk about traditional network monitoring, we often refer to Fault Monitoring or Device Monitoring.

Discover the superheroes of network monitoring tools in our comprehensive guide. Unveil the perfect type of network monitoring tool for your business.
Learn moreI. What is Device Monitoring?
Network Device Monitoring refers to monitoring the use of network resources or network devices using SNMP monitoring protocol. For example, to monitor the state of a firewall or determine the CPU usage or bandwidth usage of an interface. In that case, we usually take measurements from a specific location in the network, such as the counter of an interface, a CPU, etc.
This type of monitoring is good, and you should definitely keep doing it. But, the term network monitoring covers a vast range of techniques. It begins with device monitoring, but you can take it further by monitoring end-to-end user experience.
 In the last column of Obkio's dashboard, you can see Device Monitoring Metrics
But, if there’s a problem with your Internet connection, you can't just monitor your devices to find your problem. You need to monitor the user experience to identify performance issues affecting your Internet connection.
In comes Network Performance Monitoring.
II. What is Network Performance Monitoring?
Network Performance Monitoring Or NPM is end-to-end network monitoring of the end-user experience. It differs from traditional monitoring because performance it is monitored from the end-user perspective, and is measured between two points in the network.
For example:
- The performance between a user, who works in the office, and the application they use in the company’s data center
- The performance between two offices in a network
- The performance between the head office and the Internet
- The performance between your users and the cloud
The objective of network performance monitoring is to guarantee the network's smooth and optimal operation. It aims to pinpoint and resolve instances of network unavailability (hard issues) as well as network performance degradation (soft issues) that might emerge. This process generally encompasses gathering information regarding network activity, bandwidth utilization, packet loss, latency, and other essential network indicators. Moreover, it involves employing diverse tools and methodologies to scrutinize and make sense of this data.

Network Performance Monitoring (NPM) holds particular significance for businesses prioritizing the effective operation of their networks and depending on cloud-based applications, online web services, or vital applications conducted through the network. It becomes essential for enterprises managing MPLS, SD-WAN and even Dual-WAN networks, SASE architectures, or multiple internet circuits and breakouts.
What is Network Performance?
Just so we’re on the same page, we’re going to give you a quick definition of network performance.
Network Performance is "the analysis and review of collective network statistics, to define the quality of services offered by the underlying computer network [that is] primarily measured from an end-user perspective."
More simply, network performance refers to the analysis and review of network performance as seen by end-users.
There are three important concepts in that definition:
- Network Analysis and Review: Before you can analyze and compare network performance measurements data over time, you must first measure key network metrics associated with network performance and collect a history of the data you’ve measured.
- Measuring Network Performance: Network Performance refers to the quality of the network. The quality will be different depending on where in the network the measurements are taken. For example, the quality of a network will not be the same if we compare the performance of a path from Montreal and New York vs a path from Montreal and Tokyo. The quality will also vary depending on when the measurements are taken. Therefore, your network performance may be great early in the workday when less users are online, and begin to degrade later on in the day when more users log on.
- The End-User Experience: The end-user experience is the most important factor when measuring network performance. But just hearing about the user experience isn't enough! With the right monitoring tools we can turn the user's experience into measurable metrics, and translate those measurements into areas for improvement.
Now, let’s get to how to measure network performance!
How to Measure Network Performance
As mentioned above, to monitor the performance from a user point-of-view, we need to perform network performance tests from that same perspective.
Ideally to do so, you want to monitor network performance from the end-user’s location without having to install a network measurement tool on each user workstation.
Moreover, you don’t want to capture every data packet for analysis, which will require a lot of extra hardware and can intrude into your user’s privacy.
Step 1. Deploy a Performance Network Monitoring Software
When you want to measure network metrics, performance and historical, you can use temporary tools like traceroutes and pings to identify problems. This can give you insight into ongoing problems, but if you’re looking to troubleshoot intermittent network issues, you can’t use temporary tools.
Essentially, if you end up identifying intermittent issues with periodic tools, you probably just got lucky that you used the tool exactly when the problem popped up again, or you may have actually caught a permanent issue.
That’s why you need a tool that continuously monitors your network performance, and will notify you when an issue happens or when an intermittent network problem pops back up. You need a permanent, continuous network monitoring solution, like Obkio Network Monitoring Software.

- 14-day free trial of all premium features
- Deploy in just 10 minutes
- Monitor performance in all key network locations
- Measure real-time network metrics
- Identify and troubleshoot live network problems


Step 2. Deploy Monitoring Agents
To begin measuring your network performance with Obkio, you need to deploy Monitoring Agents in all your key network locations.
Monitoring Agents are a unique software like continuously monitor performance using synthetic traffic which simulates and monitors the end-user point-of-view. They also:
- Measure network metrics like jitter, packet loss, throughput and more
- Intermittent network issues that are hard to pinpoint
- Alert you of any performance degradation
- Collect data to help troubleshoot
 Obkio's Chord Diagram shows a live view of network performance with Monitoring Agents in all network locations where they are deployed.
Step 3. Measure Network Metrics
Once your Monitoring Agents are deployed, they will continuously exchange synthetic UDP traffic between each other to monitor performance, this is called a Network Monitoring Session.
They will primarily measure performance by measuring key network metrics and displaying them on Obkio's Network Response Time Graph.

The Most Important Network Metrics
When it comes to how to measure network performance, it’s important to know which network performance metrics you need to examine.
Depending on the specific issues that affect your network, not every metric is going to be important for you to look at. But there are some metrics that are essential for any businesses to consider.
Obkio's Network Monitoring tool continuously measure different operating parameters based on a variety of different network metrics, such as latency, jitter, packet loss, and more. This establishes a network baseline based on the cumulative results of those metrics.

Let’s go through the most essential network metrics that you should absolutely be monitoring:
Network Metric #1. Latency
In a network, Latency refers to the measure of time it takes for data to reach its destination across a network.
You usually measure network latency as a round trip delay, in milliseconds (ms), taking into account the time it takes for the data to get to its destination and then back again to its source.
Measuring the round trip delay for network latency is important when knowing how to measure network performance because a computer that uses a TCP/IP network sends a limited amount of data to its destination and then waits for an acknowledgement that the data has reached its destination before sending any more. Therefore, this round trip delay has a big impact on network performance.
When measuring latency, consistent delays or odd spikes in delay time are signs of a major performance issue that can happen for a variety of reasons.
Most delays are actually undetectable from a user’s perspective and can therefore go unnoticed but can have a huge impact when using VoIP (VoIP latency), or unified communication systems such as Zoom, Skype, Microsoft Teams and so on.
A network performance monitoring (NPM) solution is a great network latency monitor because it measures latency and can track and log these delays to find the source of the problem.

We asked a supercomputer “What is latency”, its impact on network performance, and strategies for minimizing it and created this comprehensive guide.
Learn moreHow Latency Affects Throughput
When learning how to monitor latency, it's important to note that latency also affects maximum network throughput of a data transmission, which is how much data can be transmitted from point A to point B in a given time. We’ll be covering throughput in point 4.
But the reason that latency affects throughput is because of TCP (Transmission Control Protocol). TCP makes sure all data packets reach their destination successfully and in the right order. It also requires that only a certain amount of data is transmitted before waiting for an acknowledgement.
A common analogy of the relationship is to imagine a network path like pipe filling a bucket with water. TCP requires that once the bucket is full, the sender has to wait for an acknowledgement to come back along the pipe before any more water can be sent.
If it takes half a second for water to get down the pipe, and another half a second for the acknowledgement to come back, this equals a latency of 1 second. Therefore, TCP would prevent you from sending any more than the amount of data, or water in this example, that can travel in any one second period.
Essentially, latency can affect throughput, which is why it’s so important to know how to check network latency.
The Network Latency Maximum
"Network latency max" typically refers to the maximum latency observed during a network communication. It signifies the highest delay recorded between sending a packet and receiving a response for a particular network interaction. In other words, it's the peak delay experienced within a given set of network data transfers.
Latency in a network can be caused by various factors, including the physical distance between devices, the quality of networking equipment, the congestion level of the network, and the efficiency of the network protocols being used. High latency can lead to delays in communication and can impact real-time applications, such as online gaming, video conferencing, and voice over IP (VoIP) calls.
Measuring and monitoring maximum network latency is important for assessing the quality of a network's performance, identifying potential bottlenecks, and ensuring a smooth user experience for applications that require low-latency communication.
Network KPI Examples for Latency
When you're measuring latency, there are also other network KPIs (Key Performance Indicators) for network latency that you can also monitor to help you get a better understanding of latency in your network.
Network KPIs for latency typically include the following metrics:
- Round Trip Time (RTT): The time it takes for a packet to travel from the sender to the receiver and back again. RTT is a common measure of latency, as it includes the time it takes for packets to traverse the network and for the receiver to respond.
- Packet Delay Variation (PDV): The variation in delay between packets traveling along the same path. PDV can have a significant impact on application performance, particularly for real-time applications like video conferencing or online gaming.
- Jitter: The variation in delay between packets, measured as the difference in time between the expected arrival time and the actual arrival time. Jitter can be caused by network congestion, routing issues, or other factors, and can lead to packet loss and poor application performance.
- Mean Opinion Score (MOS): A measurement of the perceived voice quality in a VoIP call. MOS is affected by a number of factors, including latency, packet loss, and jitter.
- Service Level Agreements (SLAs): Contracts between service providers and customers that define the expected level of service, including latency targets. SLAs may include penalties for failing to meet these targets, which is why SLA monitoring is important.
- Application Response Time: The time it takes for an application to respond to a user request. Application response time can be affected by a number of factors, including latency, network congestion, and server load.
Overall, these KPIs can help organizations monitor network latency and identify areas for improvement to ensure reliable and efficient data transmission. Lucky for you, Obkio's Network Latency Monitoring tool will measure and intereprt this KPIs for you!

Learn how to measure latency with Obkio’s Network & Latency Monitoring tool. Check for latency in your network & analyze latency measurements.
Learn moreNetwork Metric #2. Jitter
To put it not so lightly, network jitter is your network transmission’s biggest enemy when using real-time apps such as unified communications, including IP telephony, video conferencing, and virtual desktop infrastructure.
Simply put, jitter is a variation in delay. Otherwise known as a disruption that occurs while data packets travel across the network.
There are many factors that can cause jitter, and many of these factors are the same as those that cause delay. One difficult thing about jitter is that it doesn’t affect all network traffic in the same way.
Jitter can be caused by network congestion. Network congestion occurs when network devices are unable to send the equivalent amount of traffic they receive, so their packet buffer fills up and they start dropping packets. If there is no disturbance on the network at an endpoint, every packet arrives. However, if the endpoint buffer becomes full, packets arrive later and later.
If you’ve ever been talking to someone on a video call or other unified communication system, and suddenly their voice speeds up significantly, then slows down to catch up, or keeps fluctuating between the two - you have a jitter problem.
When measuring network jitter, remember that jitter can also be caused by the type of connection you use. A connection on a shared medium, such as a cable, is more likely to have higher jitter than a dedicated connection. So that’s something to keep in mind when choosing a connection medium.

Learn how to measure network jitter using Obkio’s Network Monitoring software to identify network problems & collect data to troubleshoot.
Learn moreNetwork KPI Examples for Jitter
When you're measuring network jitter, other network KPIs (Key Performance Indicators) can help organizations monitor network jitter and identify areas for improvement to ensure reliable and efficient data transmission.
- Packet Loss Rate (PLR): The percentage of packets lost over a certain period of time. Jitter can cause packets to be lost, so monitoring the packet loss rate is important in determining the severity of the jitter problem.
- Mean Opinion Score (MOS): A measurement of the perceived voice quality in a VoIP call. MOS is affected by a number of factors, including jitter, VoIP jitter, latency, and packet loss.
- Burst Packet Loss: The percentage of packets lost in a short period of time, such as one second. This KPI can help identify intermittent network issues that may be difficult to detect with other metrics.
- Round Trip Time (RTT): The time it takes for a packet to travel from the sender to the receiver and back again. High jitter can lead to increased RTT, which can have a negative impact on application performance.
Lucky for you, Obkio's Network Jitter Monitoring tool will measure and intereprt this KPIs for you!
Network Metric #3. Packet Loss
Packet Loss loss refers to the number of data packets that were successfully sent out from one point in a network, but were dropped during data transmission and never reached their destination.
It’s important for your IT team to measure packet loss to know how many packets are being dropped across your network to be able to take steps to ensure that data can be transmitted as it should be. Knowing how to measuring packet loss provides a metric for determining good or poor network performance.
If you're wondering how to measure packet loss easily, a network performance monitoring software, like Obkio, uses a synthetic monitoring tactic which involves generating and measuring synthetic traffic in order to count the number of packets sent and the number of packets received.
Packet loss is usually expressed as a percentage of the total number of sent packets.
- Often, more than 3% packet loss implies that the network is performing below optimal levels.
- But even just 1% packet loss might be enough to affect VoIP quality.
Packet loss is something that is determined over a period of time.
- If you record 1% packet loss over 10 minutes, it can suggest that you have 1% during the whole 10 minutes
- But it can also be that you have 10% packet loss over 1 min and then 0% over the remaining 9 minutes
How can you figure that out? Well that’s why Obkio calculates packet loss every minute, so you always get an up-to-date and precise measure of packet loss.

How to measure packet loss with Obkio’s Network & Packet Loss Monitoring tool. Check for packet loss in your network & read packet loss measurements.
Learn moreNetwork KPI Examples for Packet Loss
When you're measuring packet loss, there are some KPIs (Key Performance Indicators) for network packet loss that you can also monitor to help you get a better understanding of packet loss levels in your network. Some network KPI examples for packet loss include the following metrics:
- Packet Loss Rate (PLR): The percentage of packets lost over a certain period of time. This KPI is calculated by dividing the number of lost packets by the total number of packets transmitted.
- Round Trip Time (RTT): The time it takes for a packet to travel from the sender to the receiver and back again. High packet loss can lead to increased RTT, which can have a negative impact on application performance.
- Mean Opinion Score (MOS): A measurement of the perceived voice quality in a VoIP call. MOS is affected by a number of factors, including packet loss, jitter, and latency.
- Burst Packet Loss: The percentage of packets lost in a short period of time, such as one second. This KPI can help identify intermittent network issues that may be difficult to detect with other metrics.
- Out of Order Packets: The percentage of packets that arrive at the receiver out of sequence. This KPI can indicate network congestion or misconfigured routers.
- Retransmission Rate: The percentage of packets that need to be retransmitted due to packet loss. This KPI can help identify issues with network congestion or hardware failures.
Overall, these KPIs can provide valuable insights into the performance of a network, and help identify areas for improvement to ensure reliable and efficient data transmission. Lucky for you, Obkio's Packet Loss Monitoring tool will measure and intereprt this KPIs for you!
Network Metric #4. Throughput
Network Throughput refers to the amount of data passing through the network from point A to point B in a determined amount of time. When referring to communication networks, throughput is the rate of data that was successfully delivered over a communication channel.
In simpler terms, network throughput quantifies the speed at which data can travel from one point to another across a network. It is influenced by factors such as bandwidth, latency, packet loss, and network congestion.
"Internet Connection Speed" or "Internet Connection Bandwidth" is a general term used by internet companies to sell you high-speed internet, but is used by default to mean throughput, which is the actual rate of packet delivery over a specific medium.

Unravel the secrets of network throughput: from bytes to blazing speed. Learn, measure, and optimize with Obkio's Network Performance Monitoring.
Learn moreHow to Measure Network Throughput (Throughput Formula Networking)
Measuring network throughput is usually done in bits per second (bps), kilobits per second (Kbps), megabits per second (Mbps), or gigabits per second (Gbps), depending on the scale of the network.
The formula to calculate throughput in networking is:
Throughput (bps) = Total data transmitted / Time taken
Total data transmittedis the amount of data sent from the source to the destination in bits.Time takenis the duration of the transmission in seconds.
For example, if you have transmitted 100 megabits of data from source to destination in 10 seconds, the throughput can be calculated as follows:
Throughput (Mbps) = (100 * 10^6 bits) / 10 seconds = 10 Mbps
Keep in mind that real-world network throughput can be influenced by factors such as network congestion, latency, packet loss, and the efficiency of the network protocol being used. Additionally, the above formula provides a basic understanding of throughput calculation; in actual networking scenarios, the calculation might involve additional considerations and adjustments.
That’s why the best way to learn how to measure network throughput is to use Speed Tests.
Measuring Network Throughput with Speed Tests
A Speed Test tool is the best solution for measuring network throughput to give you an idea of how fast your Internet connection is right now. Essentially, a speed test measures network speed by sending out the most amount of information possible throughout your network, and monitoring how long it takes to get delivered to its destination.
A network performance monitoring solution like Obkio allows you to run speed tests manually, or schedule speed tests between monitoring Agents, or a group of multiple Agents to ensure your speed or throughput is constantly being monitored.
Obkio also allows you to perform speed tests with multiple TCPs at the same time, which makes for the most accurate speed test results.
Network KPI Examples for Throughput
When measuring throughput these other network KPIs can help organizations monitor network throughput and identify areas for improvement to ensure reliable and efficient data transmission.
Network KPIs examples for network throughput typically include the following metrics:
- Bandwidth: The maximum amount of data that can be transmitted over a network in a given amount of time, typically measured in bits per second (bps) or megabits per second (Mbps).
- Goodput: The amount of useful data that is transmitted over a network in a given amount of time, after accounting for network overhead and errors. Goodput is often lower than the maximum bandwidth due to network congestion, packet loss, and other factors.
- Packet Loss Rate (PLR): The percentage of packets lost over a certain period of time. High packet loss rates can have a significant impact on throughput and can indicate network congestion or other issues.
- Latency: The delay or lag that occurs when data is transmitted from one point to another. High latency can reduce throughput, as it takes longer for data to be transmitted.
- Response Time: The time it takes for a network to respond to a user request. This KPI can be particularly important for applications that require real-time interaction, such as online gaming or video conferencing.
Network Throughput in Performance Testing
In the context of performance testing, throughput refers to the rate at which a system or application can process a certain amount of work or data within a given time frame. It measures the system's capacity to handle a specific load or level of activity. Throughput is often a key metric in performance testing as it provides insights into the system's efficiency and scalability.
In performance testing, throughput can be measured using various units such as transactions per second (TPS), requests per second (RPS), or bytes per second (BPS), depending on the nature of the application or system being tested. Throughput testing involves gradually increasing the load on the system and measuring how well it maintains its performance levels as the load increases.
Here are a few important points to consider about throughput in performance testing:
- Load Levels: Throughput testing involves applying different levels of load to the system under test to see how it performs under varying conditions. This load can include user interactions, transactions, requests, or any other relevant work units.
- Measurement: Throughput is typically measured as the number of successful transactions or requests completed within a specific time period. For example, a system might achieve a throughput of 1000 transactions per second.
- Scalability: Monitoring throughput under increasing loads helps identify the system's scalability. If the throughput increases linearly with load, the system is scaling well. However, if the throughput starts to plateau or decrease, it might indicate performance bottlenecks.
- Bottleneck Identification: Throughput testing can help identify performance bottlenecks, such as database limitations, network constraints, or resource exhaustion, which can impact the system's ability to handle high loads effectively.
- Performance Goals: Throughput metrics are often used to define performance goals for an application or system. These goals ensure that the system can handle the expected load and deliver a satisfactory user experience.
- Real-World Implications: Throughput testing helps simulate real-world scenarios and provides insights into how well an application or system can handle concurrent user activity. It's particularly important for applications with high user interaction or data processing requirements.

Discover how to measure network throughput. Learn techniques, troubleshooting tips, & use Obkio for continuous monitoring. Optimize your network throughput.
Learn moreNetwork Metric #5. Network Speed
We always hear people talk about speed related to network performance. It's usually because speed is one of the easiest network metrics to understand.
Network speed, also known as data transfer rate, refers to the speed at which data is transferred between two devices on a network. It is usually measured in bits per second (bps) or bytes per second (Bps). Network speed can vary depending on the type of network, the devices used, and the distance between them.
In simple terms, network speed is how fast data travels from one device to another over a network. A higher network speed means that data can be transferred more quickly, resulting in faster downloads, uploads, and overall internet browsing speeds.
Network KPI Examples for Network Speed
When monitoring network speed, other KPIs can help organizations monitor network speed and identify areas for improvement to ensure reliable and efficient data transmission.
Network KPIs for network speed typically include the following metrics:
- Bandwidth: The maximum amount of data that can be transmitted over a network in a given amount of time, typically measured in bits per second (bps) or megabits per second (Mbps). Higher bandwidth generally indicates faster network speeds.
- Latency: The delay or lag that occurs when data is transmitted from one point to another. Low latency is important for applications that require real-time interaction, such as online gaming or video conferencing. A lower latency generally indicates good latency and faster network speeds.
- Round Trip Time (RTT): The time it takes for a packet to travel from the sender to the receiver and back again. Low RTT generally indicates faster network speeds.
- Download and Upload Speed: The speed at which data can be downloaded from or uploaded to the internet, typically measured in Mbps. Higher download and upload speeds generally indicate faster network speeds.
- Packet Loss Rate (PLR): The percentage of packets lost over a certain period of time. High packet loss rates can have a significant impact on network speed and can indicate network congestion or other issues.

Learn how to monitor network speed & Internet speed with Obkio Network Monitoring tool for continuous network speed monitoring.
Learn moreNetwork Metric #6. Bandwidth
Bandwidth is a very commonly used metric in the world of networking. It refers to the maximum amount of data that a network connection can transmit within a specific time frame, typically measured in bits per second (bps) or bytes per second (Bps). For instance, a network connection possessing a bandwidth of 100 Mbps can send 100 million bits of data per second.
You can think of bandwidth like a pipe carrying water. Just as a broader pipe can transport more water simultaneously, a greater network bandwidth can transfer more data simultaneously. However, if several devices use the network concurrently, or if the network's physical capacity is restricted, the available bandwidth will be shared among the devices, resulting in slower network speeds and protracted download times.
How to Measure Network Bandwidth
Bandwidth is typically measured in bits per second (bps) and is a fundamental aspect of network performance. When measuring bandwidth, most tools will measure Bandwidth utilization, also known as network utilization, which refers to the percentage of available network bandwidth that is currently being used or consumed by data traffic.
You can use Obkio's Network Monitoring tool to measure bandwidth!
- Setup and Configuration: Create and account and sign up to Obkio's free trial. Install Obkio Agents at all network locations where you want to measure bandwidth. These agents will gather network performance data.
- Monitor Devices: Setup Network device monitoring to measure bandwidth usage for routers, switches, and other network devices. This ensures that the measured bandwidth reflects the actual traffic flow and utilization within the network, providing accurate insights into how much data is being transmitted and received.
- Measure Metrics: Obkio's agents will begin exchaning synthetic traffic between different network locations and devices to perform synthetic testing and measure network metrics like bandwidth.
- Monitor Results: As the test runs, Obkio will display real-time data and metrics related to bandwidth performance. You can monitor parameters like throughput, latency, packet loss, and other relevant network performance indicators.
- Analyze and Troubleshoot: Analyze the results to identify any issues or areas for improvement in your network's bandwidth performance. Obkio provides visualizations like graphs and reports to help you interpret the collected data.
- Optimize and Improve: Use the insights gained from the bandwidth measurements to optimize your network configuration and troubleshoot any bottlenecks or performance problems.
- Alerts and Notifications: Configure alerts and notifications to be informed when certain bandwidth thresholds are exceeded or when network performance falls below acceptable levels.
How to Measure Bandwidth Usage
Bandwidth usage, also known as bandwidth utilization, refers to the percentage of available network bandwidth that is currently being used or consumed by data traffic. It measures how efficiently the network's capacity is being utilized at a given time. Bandwidth utilization is a critical metric used to gauge the level of network congestion, the efficiency of data transmission, and the overall performance of a network.
For example: If a network connection has a bandwidth capacity of 100 Mbps (megabits per second) and is currently transmitting data at a rate of 50 Mbps, the bandwidth utilization would be 50% (50 Mbps / 100 Mbps * 100%).
Network KPI Examples for Bandwidth
Some other network KPIs examples for network bandwidth that you can also measure typically include the following metrics:
- Maximum Bandwidth: The highest possible data transfer rate of the network, measured in bits per second (bps), kilobits per second (Kbps), megabits per second (Mbps), or gigabits per second (Gbps). This is often used as a benchmark for network capacity.
- Utilized Bandwidth: The actual amount of network bandwidth being used at any given time, expressed as a percentage of the maximum bandwidth. This KPI can help identify network congestion or network overload and determine if the network is being used efficiently.
- Peak Bandwidth Utilization: The highest percentage of network bandwidth being utilized during a specific period of time, such as during peak usage hours. This KPI can help identify if the network is being overloaded during certain times of the day and if additional bandwidth is needed.
- Network Efficiency: The ratio of actual data transferred to the total amount of data that could have been transferred in a given period of time. This KPI can help determine if the network is being used efficiently.
- Bandwidth Availability: The percentage of time that the network bandwidth is available for use. This KPI can help identify network downtime and determine if additional bandwidth or network redundancy is needed.

How to measure bandwidth, identify issues & optimize network performance. Use Obkio's Network Performance Monitoring tool for easy bandwidth monitoring.
Learn moreNetwork Metric #7. Network Availability
Network availability is another metric we hear about very often. It refers to the amount of time a network is accessible for use. This metric is computed by dividing the entire period during which a network is accessible by the total time in a given period and is typically conveyed as a percentage, representing the amount of time that the network is available for use during a given period, such as a month or a year. The objective is to achieve 100% availability.
To calculate network availability , the total amount of time that the network is expected to be operational during the period is subtracted from the amount of time that the network experiences downtime or service outages. The resulting figure is then divided by the total amount of time in the period and multiplied by 100 to get a percentage value.
High network availability is important for businesses and organizations that rely on their networks for critical operations, such as communication, data storage, and application delivery. Downtime can result in lost productivity, revenue, and damage to reputation. By monitoring and improving network availability, organizations can ensure that their networks are reliable and can meet the needs of their users.
Network KPI Examples for Network Availabilty
There are other network KPIs examples for network availability that you can monitor to ensure your network is available at maximum capacity. These typically include the following metrics:
- Downtime: The amount of time that the network experiences downtime or service outages. This KPI is often measured in minutes, hours, or days and is used to determine the overall availability of the network.
- Mean Time to Repair (MTTR): The average time it takes to repair a network failure or outage. A low MTTR is important for minimizing downtime and ensuring that the network is available for use as quickly as possible.
- Mean Time Between Failures (MTBF): The average amount of time between network failures or network outages. A high MTBF indicates that the network is reliable and less likely to experience downtime.
- Service Level Agreement (SLA) Compliance: The percentage of time that the network meets the service or Internet SLA, which is a contract between the service provider and the customer that specifies the level of service that will be provided. SLA compliance is important for ensuring that the network is available when it is needed and that the provider is meeting its contractual obligations.
- Availability Percentage: The percentage of time that the network is available for use during a specified period, such as a month or a year. This KPI is used to measure the overall availability of the network and to track improvements over time.
 Obkio's Network Performance Monitoring Response Time Graphs
Network Metric #8. Packet Duplication
In a simplified way, packet duplication refers to when data packets are duplicated somewhere in the network, and are then received twice at their destination.
Many times, if the source of the data believes that a data packet was not transmitted correctly because of a packet loss, it may retransmit that packet. The destination source may have already gotten the first packet, and will receive a second duplicate packet.
Once again, in the example of a video chat, packet duplication may cause you to hear as though someone is repeating words or sentences as they’re speaking to you - which isn’t a very pleasant experience.
Network KPI Examples for Packet Duplication
Packet duplication is generally considered a network error, and KPIs are usually measured in terms of packet loss instead. However, if you are looking to monitor packet duplication specifically, you could track the following network KPIs:
- Duplicate Packets: The number of packets that are duplicated within a certain period of time. This KPI can help identify issues with network congestion, packet routing, or other issues that may be causing packets to be sent multiple times.
- Duplicate Packet Percentage: The percentage of packets that are duplicated within a certain period of time. This KPI can help identify if packet duplication is becoming a significant issue on the network.
- Packet Delivery Ratio (PDR): The ratio of the total number of packets sent to the total number of packets received, taking into account any duplicate packets. This KPI can help determine if packet duplication is affecting the overall reliability of the network.
- Network Latency: The amount of time it takes for a packet to travel from its source to its destination, measured in milliseconds. High latency can cause packet duplication and can be an indicator of network congestion or other issues.

Discover the secrets of packet duplication in networks, learn how to identify it, and unleash the power of Obkio's monitoring tool to tackle the issue.
Learn moreNetwork Metric #9. Packet Reordering
Packet reordering is also pretty self explanatory and occurs when data packets arrive at their destination in the wrong order. This can happen for various reasons, such as multi-path routing, route fluttering, and wrong QoS queue configuration.
Packet reordering is also very simple to spot. If you’re talking to someone over video call and all of a sudden words in their sentences sound scrabbled and out of order, it may be because the data arrived in the wrong sequence.
Once again, a network performance monitoring solution will be able to catch these problems, right as they happen. Having continuous monitoring of your network, whether from your head office, data center, or home office, means that you’ll catch these network issues long before you’re on an important video call with a client who can’t understand a word you’re saying because of packet loss or packet reordering.

Unravel the mystery of packet reordering! Learn its impact on network performance & discover tools like Obkio for detection and optimization.
Learn moreNetwork KPI Examples for Packet Reordering
Some common network KPIs for packet reordering include:
- Out-of-Order Packets: The number of packets that arrive at the destination out of order. This KPI can help identify if there are issues with packet routing or congestion on the network.
- Out-of-Order Packet Percentage: The percentage of packets that arrive at the destination out of order. This KPI can help identify if packet reordering is becoming a significant issue on the network.
- Packet Reordering Index (PRI): A measure of how much reordering is occurring in the network. PRI is calculated by dividing the number of out-of-order packets by the total number of packets received.
- Mean Opinion Score (MOS): A measure of the quality of the audio or video transmitted over the network. MOS is often used for real-time applications, such as video conferencing, and can be affected by packet reordering.
- Network Latency: The amount of time it takes for a packet to travel from its source to its destination, measured in milliseconds. High latency can cause packet reordering and can be an indicator of network congestion or other issues.
Network Metric #10. User Quality of Experience
Now you may be wondering how all these network performance metrics could possibly play a part in how to measure network performance. All the metrics we mentioned, in addition to user requirements and user perceptions, play a role in determining the perceived performance of your network.
Each metric on its own gives you an idea of how your infrastructure is performing, but you need to look at all of these factors to give a true measurement of network performance.
The best way to measure and quantify user experience is by measuring User Quality of Experience (QoE). Quality of Experience (QoE) allows you to measure performance from the end-user perspective and is essentially the perception of the user of the effectiveness and quality of the system or service. In fact, users base their opinions about the network exclusively on their perception of QoE.
Measuring QoE is a culmination of all these network metrics we discussed, as well as the ability of the network to meet the user’s expectations. That’s basically what network performance is all about.
Other network performance metrics you can use to measure QOE include:
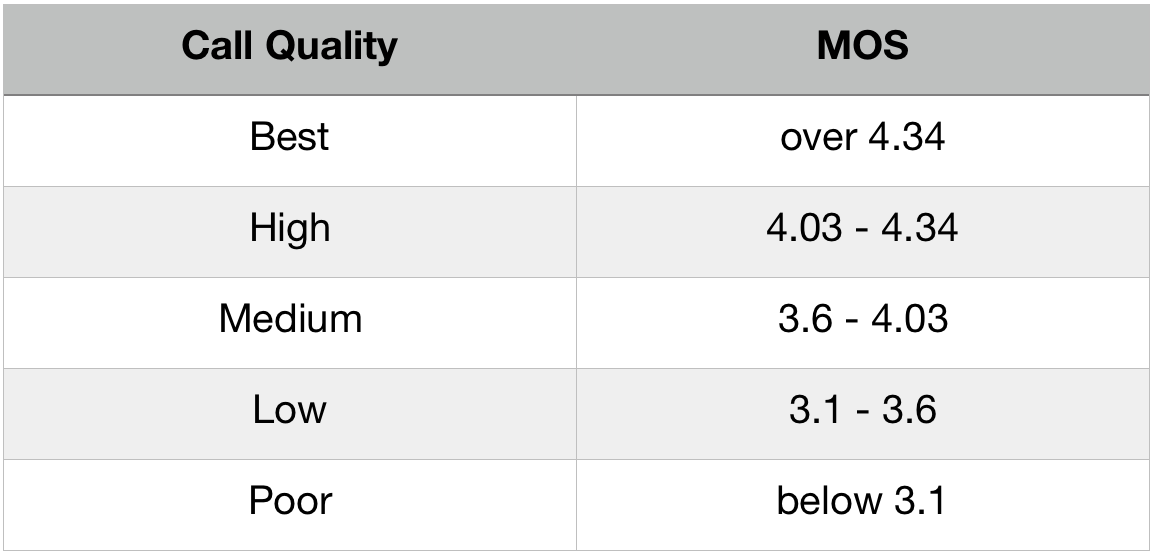
Network Metric #11. MOS Score
The MOS score is a rating from 1 to 5 of the perceived quality of a voice call, 1 being the lowest score and 5 the highest for excellent quality.
The MOS score was created by the ITU, a United Nations agency that sought to facilitate international connectivity in communications networks, and created a metric that could be measured and understood by all.
The MOS has been originally developed for traditional voice calls but has been adapted to Voice over IP (VoIP) in the ITU-T PESQ P.862. The standard defines how to calculate a MOS score for VoIP calls based on multiple factors such as the specific codec used for the VoIP call.
Network KPI Examples for MOS Score
Monitoring other network KPIs for MOS score can help organizations identify and address issues that may be affecting the quality of audio or video transmitted over their networks, ensuring that users have a high-quality experience. Some network KPIs include:
- Audio/Video Quality Score: This KPI measures the overall quality of audio or video transmitted over the network. This can be calculated by averaging MOS scores for a given period of time.
- Packet Loss Rate: The percentage of packets that are lost during transmission. High packet loss rates can negatively impact audio or video quality and lower MOS scores.
- Packet Delay: The amount of time it takes for a packet to travel from its source to its destination, measured in milliseconds. High packet delay can cause audio or video to be delayed or out of sync, which can lower MOS scores.
- Jitter: The variation in packet delay over time. High jitter can cause audio or video to be choppy or distorted, which can lower MOS scores.
- Mean Opinion Difference (MOD): A measure of the difference in perceived quality between two audio or video streams. MOD is often used to compare the quality of different codecs or transmission methods.
Check out Obkio's MOS Monitoring tool to start measuring your MOS score!
Network Metric #12. VoIP Quality
oIP (Voice over Internet Protocol) quality refers to the overall performance of a VoIP system in delivering clear and reliable voice communications over the Internet. VoIP technology allows voice signals to be converted into digital packets and transmitted over IP networks, such as the internet, instead of traditional phone lines.
VoIP quality is impacted by various factors, such as network bandwidth, latency, packet loss, jitter, and the quality of end-user devices, such as headsets and microphones. Poor VoIP quality can lead to issues such as garbled speech, dropped calls, echoes, delays, and other forms of audio distortion.
VoIP monitoring is essential to ensuring that VoIP systems are functioning optimally and providing high-quality voice communications. This can be done through various KPIs, such as MOS (Mean Opinion Score), which is a commonly used metric for assessing voice quality on a scale of 1 to 5, with 5 being the best possible score. Other KPIs for VoIP quality include jitter, latency, packet loss, and call completion rates.
Obkio’s NPM software calculates the VoIP Quality for each network performance monitoring session every minute. Obkio measures VoIP Quality with MOS score even if there is no ongoing call, to provide a proactive monitoring over packet capture solution.

Don't wait for bad user experience complaints to start network troubleshooting! This Quality of Experience (QoE) metric helps IT pros understand the complex impact of network performance on VoIP.

Learn how to measure VoIP Quality using MOS Score (Mean Opinion Score) & Obkio’s VoIP monitoring solution to identify poor VoIP Quality issues & dropped calls.
Learn moreNetwork KPI Examples for VoIP Quality
VoIP quality can be affected by a variety of factors, including network latency, jitter, packet loss, and more. Using VoIP monitoring tools, you can collect information about common network KPIs for VoIP quality including:
- MOS (Mean Opinion Score): A measure of the perceived quality of the voice call. MOS is typically measured on a scale from 1 to 5, with 5 being the best possible quality.
- Packet Loss Rate: The percentage of packets that are lost during transmission. High packet loss rates can negatively impact VoIP quality and lower MOS scores.
- Packet Delay: The amount of time it takes for a packet to travel from its source to its destination, measured in milliseconds. High packet delay can cause voice calls to be delayed or out of sync, which can lower MOS scores.
- Jitter: The variation in packet delay over time. High jitter can cause voice calls to be choppy or distorted, which can lower MOS scores.
- Latency: The amount of time it takes for data to travel from one point on the network to another, measured in milliseconds. High latency can cause delays in the transmission of voice data, which can lower MOS scores.
- Echo Delay: The amount of time it takes for an echo to be heard on the call. High echo delay can be distracting and can lower MOS scores.
Network Metric #13. Network Congestion
Network congestion arises when network usage or throughput exceeds the available speed, or there is too much traffic on a network and the available bandwidth is exceeded. As a general guideline, the amount of bandwidth usage should not surpass 80% of the circuit speed.
This can cause data transfer rates to slow down, delays in transmitting data, and even packet loss. Congestion can occur at various points in the network, such as at the network edge, in the core of the network, or within individual devices like routers or switches. This can also include both WAN and LAN congestion.
The main cause of network congestion is an increase in the number of devices and applications competing for limited network resources. As more users and devices connect to the network and demand higher bandwidth-intensive applications like video streaming or online gaming, the available bandwidth can become overwhelmed, resulting in congestion.
Network congestion can have a significant impact on network performance and user experience. It can cause slow loading times, dropped connections, and decreased quality of service for applications like video conferencing or VoIP calls. To avoid network congestion, network administrators can employ various techniques such as traffic shaping, load balancing, and network optimization to better manage network traffic and improve performance.
By measuring network congestion during network performance monitoring, it becomes possible to ascertain the extent of network congestion or the magnitude of traffic that surpasses the network capacity at a given moment.
Network KPI Examples for Network Congestion
Network congestion occurs when there is more traffic on a network than it can handle, resulting in slow data transfer rates, delays, and packet loss. Some common network KPIs for network congestion that you can also measure include:
- Packet Loss Rate: The percentage of packets that are lost during transmission. High packet loss rates are often a symptom of network congestion.
- Latency: The amount of time it takes for data to travel from one point on the network to another, measured in milliseconds. High latency can indicate network congestion, as data is taking longer to travel through the network.
- Jitter: The variation in packet delay over time. High jitter can be a sign of network congestion, as packets are arriving at their destination at different times.
- Throughput: The amount of data that can be transmitted over the network in a given period of time, measured in bits per second. Low throughput can be a symptom of network congestion, as there is limited bandwidth available.
- Queue Length: The number of packets waiting to be transmitted through a network device such as a router or switch. High queue lengths can indicate network congestion, as packets are waiting to be processed.
Network Metric #14. Round-Trip Time (RTT)
Round-Trip Time (RTT) is a performance metric utilized to determine the duration taken by a packet to travel from the source to the destination and then return. It is interrelated to latency and is generally measured in milliseconds (ms).
RTT is a crucial metric that helps evaluate network performance, specifically for real-time applications such as video and voice conferencing, where low latency is pivotal. High values of RTT can indicate network congestion or other complications that might adversely impact the performance of these applications.
Network KPI Examples for RTT
RTT is an important KPI for measuring network performance, as it can affect the responsiveness of applications and services. Some other common network KPIs for RTT include:
- Latency: The amount of time it takes for data to travel from one point on the network to another, measured in milliseconds. Latency is a key factor in determining RTT, as it measures the time it takes for a packet to travel from its source to its destination.
- Round Trip Time (RTT): The time it takes for a packet to travel from its source to its destination and back again, measured in milliseconds. RTT is a direct measure of the time it takes for a packet to complete a round trip journey and can be used to diagnose network problems and optimize network performance.
- Ping Time: The time it takes for a ping command to complete a round trip journey, measured in milliseconds. Ping is a common tool used to measure network latency and can be used to diagnose network issues and optimize network performance.
- Jitter: The variation in packet delay over time. Jitter can impact RTT by causing packets to arrive at their destination at different times, which can result in longer RTT.

Discover Network Round-Trip time. Learn what network RTT is, how to measure it, and optimize RTT for optimal network performance with Obkio's NPM tool.
Learn moreNetwork Metric #15. Network Utilization
Network utilization refers to the amount of network capacity that is being used at a given time. It's generally expressed as a percentage of the total network bandwidth available. In other words, it is a measure of how much of the total available capacity of a network is being used at a given moment. High network utilization can lead to network congestion, packet loss, and reduced network performance.
Network utilization is an important metric to monitor because if the utilization becomes too high, it can cause congestion and slow down the performance of the network, resulting in delays and packet loss. Conversely, if utilization is too low, it can indicate that the network is underutilized and that resources are being wasted.
Monitoring network utilization can help network administrators to identify periods of peak usage and plan for future capacity needs. This can help ensure that the network is able to handle the traffic demands placed on it and can provide optimal performance for users.
To optimize network performance, network utilization can be gauged at several junctures, including individual devices, network segments, and the entire network, to pinpoint where network resources are being used and take appropriate action.
Network KPI Examples for Network Utilization
Some other common network KPIs for network utilization include:
- Bandwidth Utilization: The percentage of available network bandwidth that is being used at a given time. This KPI measures the percentage of total bandwidth that is being consumed by network traffic.
- Peak Utilization: The maximum percentage of available network bandwidth that was utilized during a specific period of time. This KPI can help identify peak usage times and can be used to plan for future network capacity needs.
- Network Traffic Volume: The total amount of data transmitted over the network during a specific period of time, measured in bytes or bits. This KPI can help identify trends in network usage and can be used to plan for future network capacity needs.
- Network Interface Utilization: The percentage of available bandwidth that is being used by a specific network interface, such as a router or switch port. This KPI can help identify bottlenecks and optimize network performance.
- Average Response Time: The average time it takes for a request to be completed by the network, measured in milliseconds. This KPI can help identify issues with network performance and can be used to optimize network capacity.

Learn how to optimize your network with network utilization monitoring. Get real-time insights into network utilization rates with tips, tricks & tools.
Learn moreNetwork Metric #16. Network Error Rate
Network error rate is a measure of the number of errors that occur in network traffic, expressed as a percentage of the total number of packets transmitted. Errors can occur in various forms, such as packet loss, packet corruption, and other transmission errors, and can impact network performance and reliability.
A high network error rate can cause delays in packet delivery, leading to slow network performance and degraded user experience. It can also result in packet retransmissions, which further slows down network performance and increases network congestion.
Monitoring network error rates is important for network administrators to ensure that their networks are performing at optimal levels. By tracking error rates and identifying the causes of errors, network administrators can take steps to optimize network performance and improve reliability. For example, they can identify network congestion, hardware failures, or misconfigurations that may be causing errors, and take appropriate action to address these issues.
Network KPI Examples for Network Error Rate
Network error rate is a KPI that measures the percentage of errors that occur in network traffic. These errors can include packet loss, packet corruption, and other transmission errors that can impact network performance. Some common network KPIs, related to network errors, for network error rate include:
- Packet Loss Rate: The percentage of packets that are lost during transmission. This can be caused by congestion, network errors, or other issues that impact network performance.
- Bit Error Rate (BER): The percentage of bits that are lost or corrupted during transmission. This KPI is commonly used in digital communication systems and can be used to diagnose transmission issues.
- Frame Error Rate (FER): The percentage of data frames that are lost or corrupted during transmission. This KPI is commonly used in data networking and can be used to diagnose issues with network performance.
- Error Correction Rate (ECR): The percentage of errors that are corrected during transmission. This KPI measures the ability of the network to detect and correct errors in data transmission.
- Retransmission Rate: The percentage of packets that are retransmitted due to errors or packet loss. This KPI can help identify issues with network performance and can be used to optimize network capacity.

Network Metric #17. TCP Retransmission Rate
TCP Retransmission Rate is a measure of the percentage of TCP segments that are retransmitted during data transmission. TCP (Transmission Control Protocol) is a protocol used in the Internet Protocol (IP) suite to provide reliable, ordered, and error-checked delivery of data between applications running on hosts.
When a TCP segment is lost, delayed, or corrupted during transmission, the receiver will send a request to the sender to retransmit the lost segment. This process is called TCP retransmission. TCP retransmission rate measures the percentage of TCP segments that are retransmitted during data transmission, and can be used to diagnose network performance issues.
A high TCP retransmission rate can indicate issues such as network congestion, packet loss, or network errors, which can impact the performance of the application. To improve the TCP retransmission rate, network administrators may need to identify and address these issues. This may involve optimizing network capacity, identifying and replacing faulty network equipment, or adjusting network configuration settings.
TCP retransmission rate is an important KPI to monitor for applications that rely on TCP for data transmission, such as web browsing, file transfer, and email. By monitoring this KPI, network administrators can identify and resolve network performance issues before they impact user experience.
Network KPI Examples for TCP Retransmission Rate
By monitoring other network KPIs, network administrators can identify issues that may be causing high TCP retransmission rates and take appropriate action to optimize network performance and improve user experience. Network KPI examples for TCP Retransmission Rate include:
- TCP Retransmission Rate: This is the overall percentage of TCP segments that were retransmitted during data transmission.
- Retransmission Timeout (RTO): This is the time it takes for a sender to detect a lost or delayed segment and retransmit it. High RTO values may indicate network congestion or other issues that are causing delays.
- Duplicate Acknowledgments: This is the number of duplicate acknowledgments received by the sender. Duplicate ACKs can indicate that a segment was lost or delayed during transmission.
- Round-Trip Time (RTT): This is the time it takes for a sender to receive an ACK from the receiver after sending a segment. High RTT values may indicate network congestion or other issues that are causing delays and retransmissions.
- Out-of-Order Segments: This is the number of out-of-order segments received by the receiver. Out-of-order segments can indicate that segments were lost or delayed during transmission and had to be retransmitted.

Network Metric #18. DNS Resolution Time
DNS (Domain Name System) resolution time is the time it takes for a DNS query to be resolved to an IP address. The DNS system is used to translate human-readable domain names, such as www.example.com, into IP addresses, which are used by computers to communicate with each other over the internet.
When a user enters a domain name into their web browser, the browser sends a DNS query to a DNS resolver to obtain the IP address associated with that domain name. The DNS resolver then looks up the IP address in a DNS server database and returns the result to the browser. DNS resolution time measures the time it takes for this process to complete, from the moment the query is sent to the moment the IP address is returned. You can also use Traceroutes via IP monitoring to do this.
DNS resolution time is an important KPI for network administrators and website owners, as it can impact user experience. Slow DNS resolution times can cause delays in loading web pages, which can lead to frustration for users and ultimately affect website traffic and revenue. By monitoring DNS resolution time, network administrators can identify and address issues that may be causing slow DNS resolution, such as overloaded DNS servers, network congestion, or misconfigured DNS settings.
Network KPI Examples for DNS Resolution Time
Network KPI examples for DNS resolution time include:
- DNS Lookup Time: This is the time it takes for a DNS resolver to complete a query and return the IP address of a domain name. It includes the time spent querying DNS servers, as well as any delays caused by network congestion or other issues.
- Time to First Byte (TTFB): This is the time it takes for the first byte of data to be received by the browser after a DNS query is made. It includes the time spent waiting for the DNS resolution to complete, as well as any additional time needed to establish a connection to the server.
- DNS Response Time: This is the time it takes for a DNS server to respond to a DNS query. It includes the time spent processing the query and generating a response, as well as any delays caused by network congestion or other issues.
- Cache Hit Rate: This is the percentage of DNS queries that are resolved using cached information, rather than requiring a new query to be made. A high cache hit rate can indicate that DNS resolution is efficient and optimized, while a low rate may indicate that DNS queries are being made unnecessarily, slowing down the resolution process.
Network Metric #19. Network Response Time
Network response time refers to the duration it takes for a system or application to respond to a request sent over a network. It measures the elapsed time between the initiation of a request and the receipt of the corresponding response. Network response time is an important metric for evaluating the performance and user experience of network-based applications, services, or systems.
Network response time encompasses several factors, including the time taken for data transmission, processing at the server or destination, and the return journey of the response back to the requester. It is influenced by various elements within the network infrastructure, such as latency, bandwidth, congestion, and the processing capabilities of servers or devices involved in handling the request.
A lower network response time is desirable as it indicates a faster and more responsive network. Shorter response times lead to improved user experiences, reduced waiting times, and better application performance. Conversely, a higher network response time can result in delays, slower application performance, and decreased user satisfaction.
Network response time is particularly critical for real-time applications, such as video conferencing, VoIP (Voice over Internet Protocol), or online gaming, where low latency and fast responses are essential for a seamless user experience.
Network KPI Examples for Network Response Time
Network Key Performance Indicators (KPIs) for network response time help assess and measure the performance of a network infrastructure. Here are some examples of KPIs related to network response time:
- Average Response Time: This KPI calculates the average duration it takes for the network to respond to requests over a specific period of time. It provides an overall view of the network's responsiveness and helps identify trends or deviations from expected performance levels.
- Percentile Response Time: Percentile response time measures the response time at specific percentile values. For example, the 95th percentile response time represents the duration within which 95% of requests receive a response. This KPI helps identify response time outliers and provides a more nuanced understanding of performance for different segments of users.
- Maximum Response Time: This KPI represents the longest duration it takes for a network to respond to a request within a given timeframe. Monitoring the maximum response time helps identify exceptional cases where network performance may significantly degrade or experience bottlenecks.
- Application-specific Response Time: Some applications may have specific response time requirements. Measuring and monitoring response times specific to those applications can help ensure they meet service level agreements (SLAs) or user expectations. Examples include database query response time, web page loading time, or transaction processing time.
- Response Time Distribution: This KPI provides a breakdown of response times across different intervals or ranges. It helps visualize the distribution of response times and identify any performance anomalies or patterns. Analyzing response time distribution can assist in optimizing network resources and addressing performance bottlenecks.
- Comparisons with Baseline or Target Response Time: By setting a baseline or target response time, network administrators can compare actual response times against the desired performance level. This KPI allows for monitoring and evaluation of whether the network is meeting expected response time goals or if adjustments and optimizations are necessary.
- Time-to-First-Byte (TTFB): TTFB measures the duration it takes for the first byte of data to be received after sending a request. It focuses on the initial responsiveness of the network and is particularly important for web-based applications. Monitoring TTFB helps identify potential latency issues affecting the network's ability to quickly process and deliver data.
Take Control of Your Network: Start Measuring Network Performance With Key Network Metrics!
Congratulations, you did it! You made it through the wonderful world of network metrics, and now you're equipped with the knowledge you need to measure and improve your network performance. You're like a superhero, with the power to detect and fix network issues before they even happen!
Remember, network performance isn't just about speed, it's about creating a seamless user experience. By monitoring these essential network metrics, you can ensure that your network is operating at peak performance, delivering reliable connectivity, and ensuring that your users never have to suffer through another frustratingly slow connection again.
Lucky for you, the number one key to learning how to measure network performance is finding a solution that measures throughput, latency, packet loss, jitter, and more, to give you a simple and quick overview of your network.
Obkio Network Monitoring is your personal network admin that continuously measures network performance metrics in real-time to help understand how they’re affecting your network’s performance. As soon as a problem occurs, with any of the metrics being measured, you’ll be notified - even before it reaches the end user.
So, keep on monitoring those metrics, tweaking those settings, and optimizing your network to be the best it can be. And who knows, maybe one day you'll be the hero of your company, saving the day by quickly resolving a network issue before anyone even knows it's happening.
Put It to the Test: Trying Is the Ultimate Way to Learn!
Networks may be complex. But Obkio makes network monitoring easy. Monitor, measure, pinpoint, troubleshoot, and solve network problems.
- 14-day free trial of all premium features
- Deploy in just 10 minutes
- Monitor performance in all key network locations
- Measure real-time network metrics
- Identify and troubleshoot live network problems
Start measuring network metrics now!
You can rest assured that we're not like those pushy Sellsy people - there's no catch here. We firmly believe in the excellence of our product, but if it's not the right fit for you, we understand and want what's best for you.
