Getting Started with Obkio Network Monitoring
- How to start monitoring network performance in minutes
- How to use Obkio's Onboarding Wizard
- How to monitor Internet performance
What you are going to learn:
This documentation article is the first one that everyone should read when getting started with Obkio's solution. It is designed to help new users understand how they can start a free trial, how to use the Onboarding Wizard following the account creation, and what are the next steps after onboarding.
Throughout this article, there are links to more detailed articles that explain how things work in greater detail. You don't need to read all these articles to get a good overview of the solution, but they are great resources to deep-dive into specific features.
The first step to start using Obkio App is to kick-off the 14-Day Free Trial. To do so, Create an Account online to gain access to Obkio's Premium Plan and features until the end of the trial period.
Once an Obkio account is created, the Onboarding Wizard is available to guide users through the deployment process. Details on what the Onboarding Wizard actually deploys for you in Obkio's App can be found in the section below.
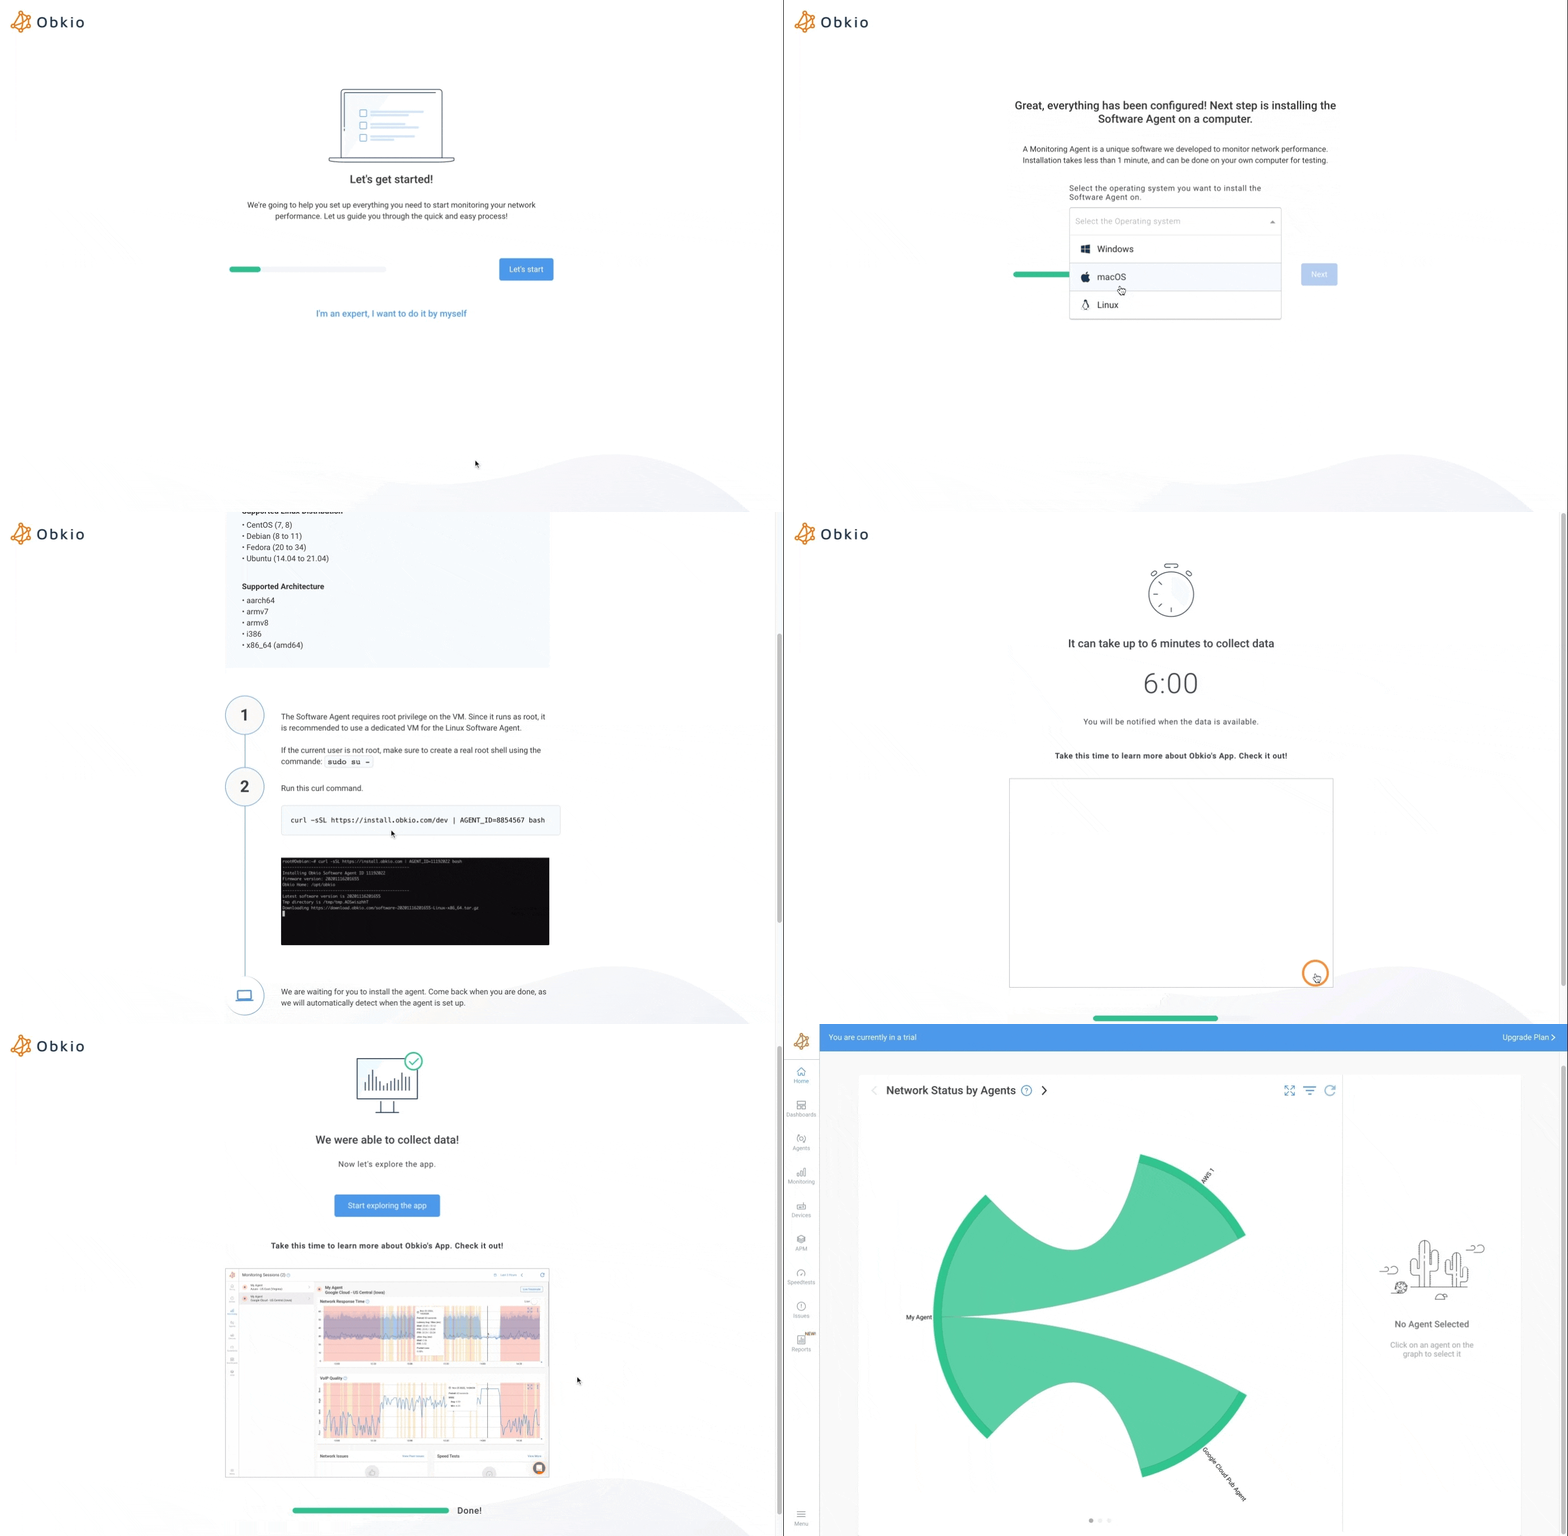
Obkio provides an easy to follow setup guide, following the creation of an account, and assists users with quickly deploying their first Obkio Monitoring Agent.

This guide:
Helps the user install their first Obkio Monitoring Agent in a network location of their choice. The Okbio Agent supports all operating systems such as Windows, macOS and Linux. Installation instructions are provided for each OS, following the OS selection.
Creates preset configurations that allow the user to monitor their Internet performance from whichever locations where Obkio Agent are installed.
Ends with a 6-minute countdown, allowing the application to retreive metrics from the Monitoring Agent installed. A 5-minute video is launched when this countdown starts, showing the user an overview of the application, before accessing the application for the first time. You can watch the full video below. Note that the countdown will finish sooner if enough metrics are retrieved before the end of it of video.
Once the Onboarding Wizard has done its job, the following elements are automatically created in the new account:
- Two Public Monitoring Agents offered and maintained by Obkio. As Public Monitoring Agents are available in multiple regions of multiple Cloud providers, the Public Monitoring Agents are assigned depending on the public IP used to access the application.
- One local Monitoring Agent named
My Agentinstalled with the Onboarding Wizard. - One Agent Group named
Public Agentswith the two Public Monitoring Agents assigned to it. - One Agent Group named
My Agentswith the local Agent assigned to it. - A Monitoring Template named
My First Monitoring Templateconfiguring monitoring sessions between theMy agentsand thePublic Agentsgroups. - An APM Template named
APM HTTP to google.comon theMy Agentsgroup measuring performance to reach https://www.google.com.
Once the Onboarding Wizard is completed, there are multiple things that can be done after, read more on what can by done from here in the Part 2 of the Getting Started guide.
If you need any help, get in touch with our Support Team.


