Table of Contents
Table of Contents
Are you tired of waiting for web pages to load or videos to buffer? Do you find yourself tapping your foot impatiently as you wait for your computer to respond? Well, you're not alone. In today's fast-paced digital world, we've become accustomed to lightning-fast speeds and instant gratification.
But have you ever wondered what's causing that annoying delay? Enter latency - the sneaky culprit behind slow Internet speeds. But fear not, my friend, for in this article, we'll show you how to measure latency and get back to the need for speed (or lack thereof). So buckle up, put on your favorite playlist, and let's dive into the wonderful world of latency!
Network Latency is one of the core network metrics that you should be measuring when monitoring your network performance. Latency in networking refers to the time it takes for a data packet to travel from the source to the destination across a network.
More specfically, latency measurements are the the round-trip measure of time it takes for data to reach its destination across a network, so it's a metric that really helps you understand your network health. Latency is strongly linked to network connection speed and network bandwidth.
Imagine you're driving your car on a highway during rush hour. The highway represents the network, and your car represents data packets traveling on the network. Just like how you encounter traffic congestion on the highway, data packets can encounter latency on the network.
Latency in networking can be thought of as the delay that occurs when your car encounters traffic. The traffic represents the data traffic on the network. As your car approaches a congested area, it slows down, and you experience a delay. Similarly, data packets encounter delays as they encounter congestion on the network.
Latency in networks can be influenced by various factors, including:
- Distance: The physical distance between the source and destination can affect latency. Generally, longer distances result in higher latency.
- Network Infrastructure: The efficiency and capacity of the network infrastructure, including routers, switches, and cables, can impact latency.
- Network Congestion: High levels of network traffic or congestion can lead to increased latency as data packets experience delays in transmission and processing.
- Signal Propagation: The speed at which signals travel through the medium, such as optical fiber or copper cables, also affects latency.
- Processing Time: The time taken by network devices (routers, switches, etc.) to process and forward data packets contributes to overall latency.

You generally measure latency in milliseconds (ms).
Essentially, A lower number of milliseconds means that the latency is low, your network is performing more efficiently and therefore, your user experience is better.
Measuring and managing latency is essential for optimizing network performance and delivering a high-quality user experience across various online services and applications. Network administrators monitor latency levels to identify bottlenecks, optimize routing, and ensure efficient data transmission throughout the network.
Latency in a network can be calculated using the following formula:
Total Latency = Propagation Delay + Transmission Delay + Processing Delay + Queueing Delay
Here's a brief explanation of each component:
- Propagation Delay: The time it takes for a signal to travel from the source to the destination. It is influenced by the distance between the devices and the speed of the medium through which the signal is transmitted.
- Transmission Delay: The time it takes to push the bits onto the network. It is influenced by the speed of the network connection.
- Processing Delay: The time it takes for routers, switches, and other networking devices to process and forward the data.
- Queueing Delay: The time a packet spends waiting in a queue before it can be transmitted. This occurs when there is congestion in the network.

It's important to note that in practice, these values can vary based on the specific characteristics of the network and the devices involved. Additionally, latency is often measured in milliseconds (ms) or microseconds (μs) depending on the scale.
Imagine you have a computer (Computer A) at your home and another computer (Computer B) in a data center located far away. When you send a request from Computer A to Computer B, it goes through several stages, each contributing to the overall latency:
- Propagation Delay: The time it takes for the signal to travel through the network medium. This is influenced by the physical distance between the two devices. Let's say this takes 5 milliseconds.
- Transmission Delay: The time it takes to push the bits onto the network. This is influenced by the speed of the network connection. Let's say this takes 2 milliseconds.
- Processing Delay: The time it takes for routers, switches, and other networking devices to process and forward the data. This can vary based on the efficiency of the devices involved. Let's say this takes 3 milliseconds.
- Queueing Delay: If there is congestion in the network, the data might need to wait in a queue before being transmitted. Let's say this takes 1 millisecond.
In this example, the total latency would be the sum of these delays:
5ms + 2ms + 3ms+ 1ms =1ms
So, in this scenario, the latency from Computer A to Computer B is 11 milliseconds. Keep in mind that these numbers are simplified for illustrative purposes, and actual latency can vary based on many factors in a real-world network.
Measuring network latency doesn’t have to be a headache! There are plenty of tools that can help you quickly pinpoint delays and get things back on track. You can measure latency with Ping and Traceroute or more comphrehensive Network Monitoring tools.
1. Built-In Command-Line Tools
- Ping: Measures round-trip time (RTT) for packets sent to a target.
- Traceroute (or Tracert on Windows): Shows the path packets take to a destination and measures latency at each hop.
2. Network Performance Monitoring Tools: Tools like Obkio Network Performance Monitoring provide continuous latency monitoring between agents across your network.
3. Online Tools: Measures latency (ping) during a speed test.
4. Advanced Diagnostic Tools: Captures and analyzes network traffic to identify latency causes.
5. Router and ISP Tools: Many modern routers and ISP-provided diagnostic tools include basic latency testing features.
- For quick checks: Use ping, traceroutes, or a router tool.
- For detailed analysis & troubleshooting: Opt for Obkio.
With the right tool, measuring and monitoring latency becomes much easier, allowing you to address performance issues before they impact users.
Are you tired of dealing with network latency issues impacting your business operations? Look no further! Obkio's Network Performance Monitoring tool is your ultimate solution for measuring latency and ensuring optimal network performance.
- Real-Time Latency Measurement: Identify latency bottlenecks instantly with real-time monitoring. Pinpoint delays across your network and take proactive measures to optimize performance.
- Effortless Deployment: Get started quickly with Obkio's user-friendly setup. No complex configurations or lengthy installations — start monitoring your network in minutes.
- Granular Insights: Dive deep into network performance metrics. Obkio provides comprehensive insights into propagation delay, transmission delay, processing delay, and queueing delay, empowering you to make informed decisions.
- Issue Resolution Made Easy: Detect and resolve latency issues swiftly. Obkio's NPM tool equips you with the data needed to troubleshoot and address network performance challenges effectively.
Don't let latency hinder your business success. Experience the difference in network monitoring and take control of your network latency.

A good latency speed is one that is low and provides a responsive experience for the particular application or use case. As mentioned earlier, latency is typically measured in milliseconds (ms), and the lower the latency, the better. Here are some general guidelines for what can be considered good latency speeds in various contexts:
- Voice and Video Calls: A latency of below 150 ms is generally good for clear and uninterrupted voice calls, while a latency of 200 ms or lower is preferred for smooth video calls.
- Web Browsing: Latency below 100 ms leads to a fast and responsive browsing experience, minimizing any perceivable delay when loading web pages.
- Financial Trading: In the context of financial trading, especially high-frequency trading, traders aim for extremely low latencies, often measured in microseconds (µs) or milliseconds (ms), to gain a competitive advantage in executing trades quickly. Online Gaming: Latency below 50 ms is considered excellent, providing a highly responsive gaming experience. Latency between 50 ms and 100 ms is still good and considered playable for most gamers.
- Video Streaming: Latency below 100 ms is desirable for smooth streaming without buffering or significant start-up delays.
It's essential to keep in mind that what constitutes "good" latency can vary depending on the specific application and user expectations. Different services and industries may have different acceptable latency levels based on their requirements and performance standards. In general, the goal is to minimize latency as much as possible to deliver the best possible user experience.
Latency is the time delay between the initiation of a request and the response to that request. The calculation of latency will depend on the type of system you are measuring, but here are some general steps to follow:
- Choose a method to measure latency: There are several methods for measuring latency depending on the system you are working with. For example, in network systems, you can measure latency using tools like ping or traceroute. In software systems, you may use tools like profiling or timing functions to measure the time it takes to execute a particular operation.
- Initiate a request: Start the process you want to measure the latency of. For example, if you want to measure the latency of a network connection, you can send a ping request to the target system.
- Record the start time: Record the time when you initiate the request. You can use a timer or a built-in function in the programming language you are using.
- Wait for the response: Wait for the system to respond to your request.
- Record the end time: Record the time when you receive the response.
- Calculate the latency: Subtract the start time from the end time to get the total latency. For example, if the start time was 10:00:00 AM and the end time was 10:00:01 AM, the latency would be one second.
- Repeat: Repeat the process several times to get an average latency, as latency can vary depending on many factors.
Note that latency is affected by many factors, including network congestion, system load, and processing time. Therefore, measuring latency is an important aspect of system monitoring and optimization.
Network latency can have a significant impact on network performance and user experience. It can cause slow response times, reduced network throughput, disrupted communications, poor user experience, and increased network congestion. It's important to monitor and manage latency to ensure optimal network performance and user satisfaction.
The impact of network latency can be significant, and it can affect various aspects of network performance, including:
- Slow response times: Latency can cause slow response times when users access web applications or other network-based resources. This delay can be frustrating for users and may impact their productivity.
- Reduced network throughput: Latency can also reduce the amount of data that can be transmitted over the network (network throughput). This can be a particular issue for data-intensive applications that require high bandwidth.
- Disrupted communications: Latency can cause communication disruptions, especially in real-time applications such as video conferencing, online gaming, or VoIP calls (VoIP latency). These disruptions can lead to dropped calls or video freezes, which can be frustrating for users.
- Poor user experience: High latency can lead to a poor user experience, which can impact customer satisfaction and loyalty. Users may abandon web applications or websites that are slow to respond, which can hurt a business's reputation and bottom line.
- Increased network congestion: High latency can increase network congestion, as more data packets are transmitted to compensate for the delay. This can lead to more collisions, retransmissions and network overload, which can further degrade network performance.
Latency issues will lead to slower response time in your network - but how can you know the extent of the problem?
The most accurate way to measure latency is by using a Synthetic Network Performance Monitoring Software, like Obkio.
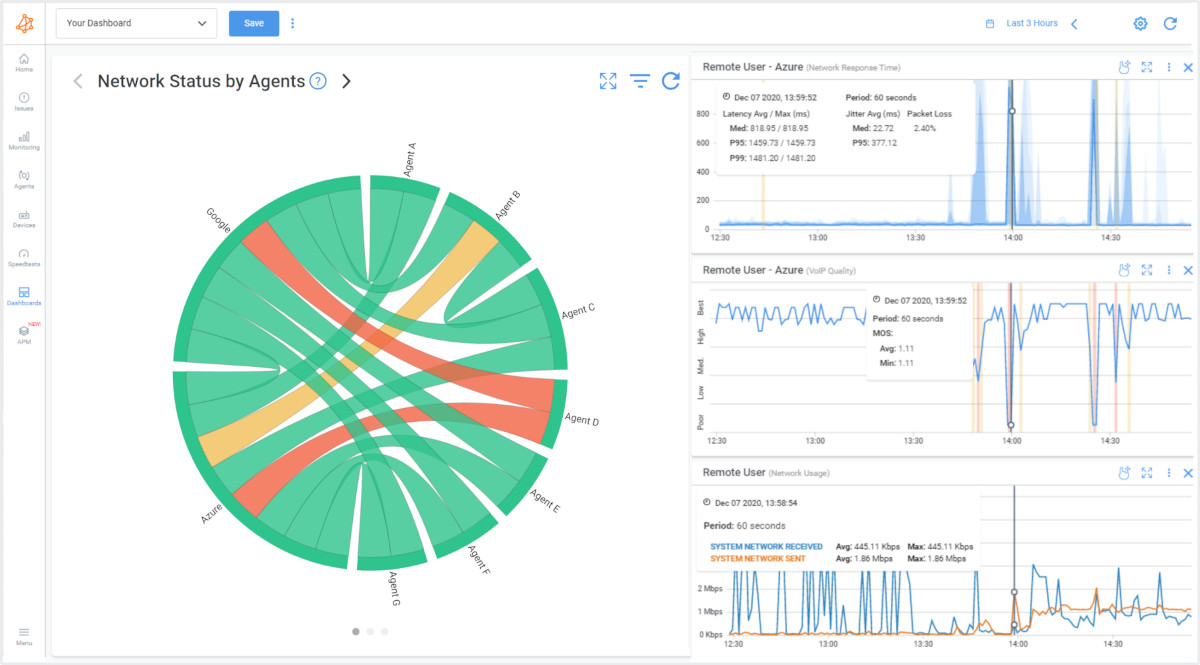
Unlike standalone latency monitoring tools, Obkio provides a holistic approach to network performance analysis, making it the best choice for measuring latency and assessing latency issues. With Obkio, users gain access to real-time monitoring and reporting features that allow them to measure latency across their entire network infrastructure, including routers, switches, and end-user devices.
This complete network monitoring tool not only identifies latency bottlenecks but also provides valuable insights into network congestion, packet loss, and bandwidth utilization. By leveraging Obkio's robust capabilities, organizations can proactively optimize their network performance, troubleshoot latency issues promptly, and ensure smooth and uninterrupted operations.
Obkio continuously measures latency by:
- Using Network Monitoring Agents in key network locations
- Simulate network traffic with synthetic traffic and synthetic testing
- Sending packets every 500ms the round trip time it takes for data to travel
- Catch latency issues affecting VoIP, UC applications and more
Don't let latency issues slow you down -

Consistent delays or odd spikes in time when measuring latency are signs of major performance issues in your network that need to be addressed. And deploying latency monitoring is you're going to find and fix those spikes.
Obkio’s Network Monitoring Solution will measure latency in your network by sending and monitoring data packets through your network every 500ms using Network Monitoring Agents. The Monitoring Agents are deployed at key network locations like head offices, data centers, and clouds and continuously measure the amount of time it takes for data to travel across your network. This is extremely important for ensuring end-to-end latency monitoring, and catching latency spikes in all network locations and applications.
For example, you can measure network latency between your head office and the Microsoft Azure cloud, or even between Azure and your data center.
To deploy latency monitoring in all your network locations, we recommend deploying:
- Local Agents: Installed in the targeted office location experiencing latency issues or latency spikes. There are several Agent types available (all with the same features), and they can be installed on MacOS, Windows, Linux and more.
- Public Monitoring Agent: Which are deployed over the Internet and managed by Obkio. They compare performance up to the Internet and quickly identify if the latency is global or specific to the destination. For example, measure latency between your branch office and Google Cloud.
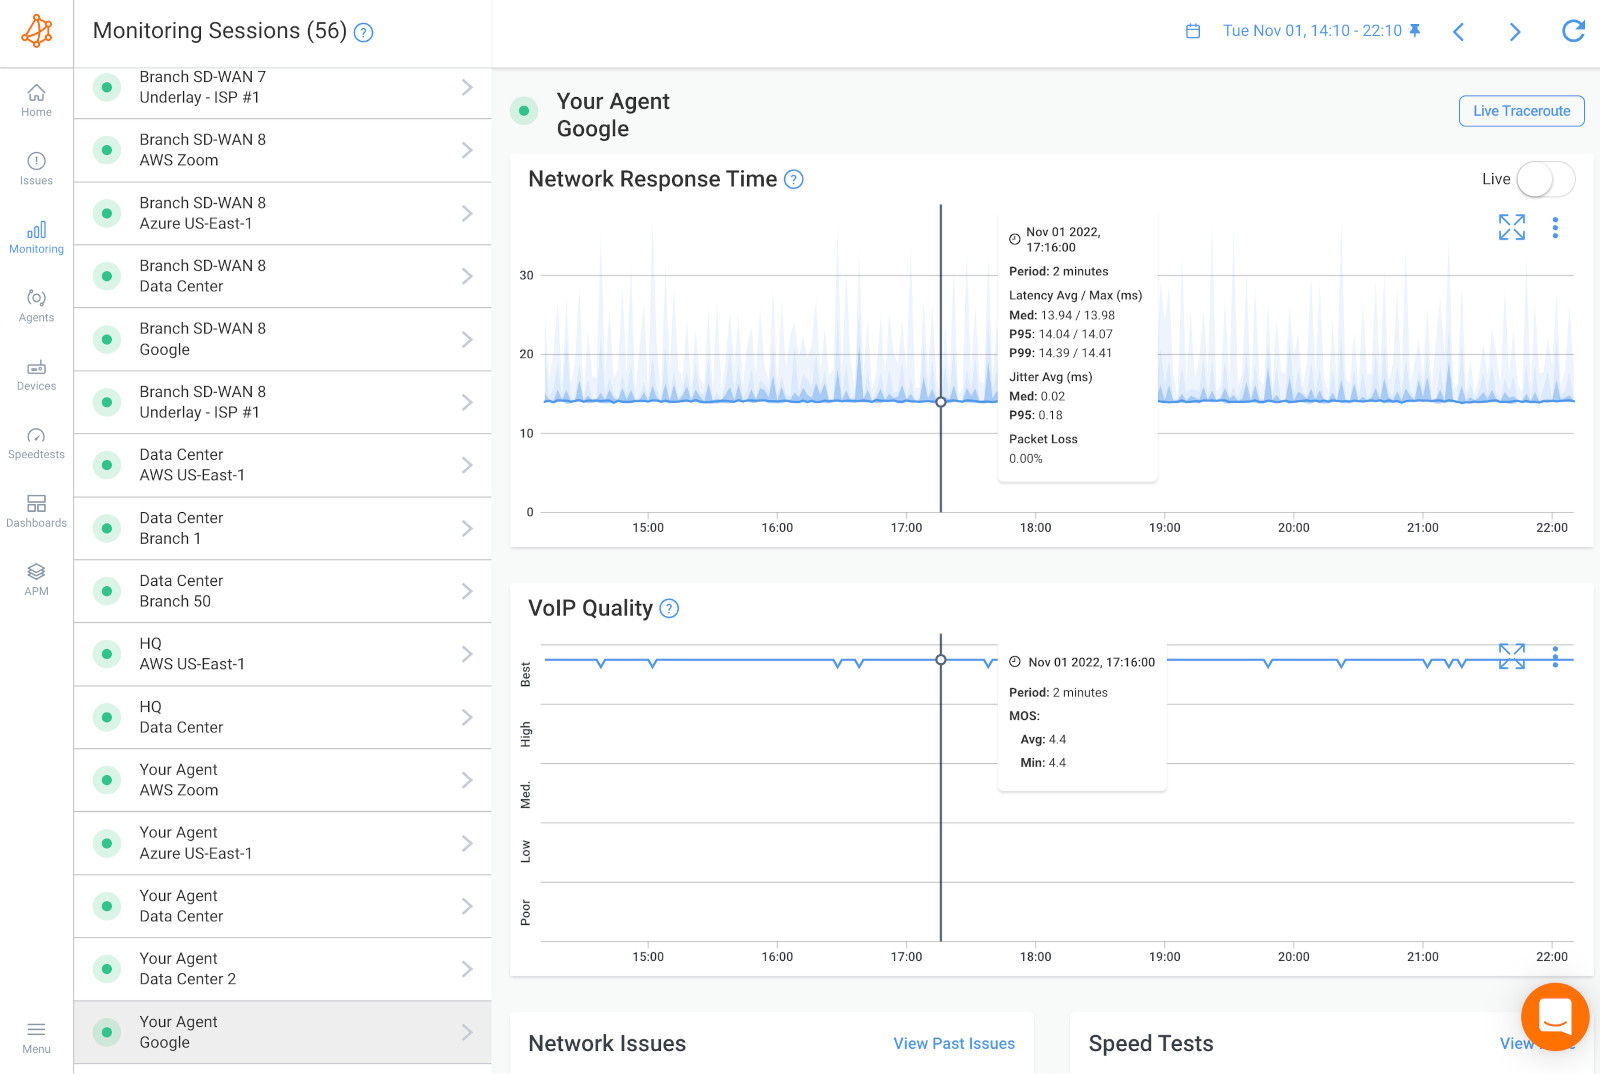
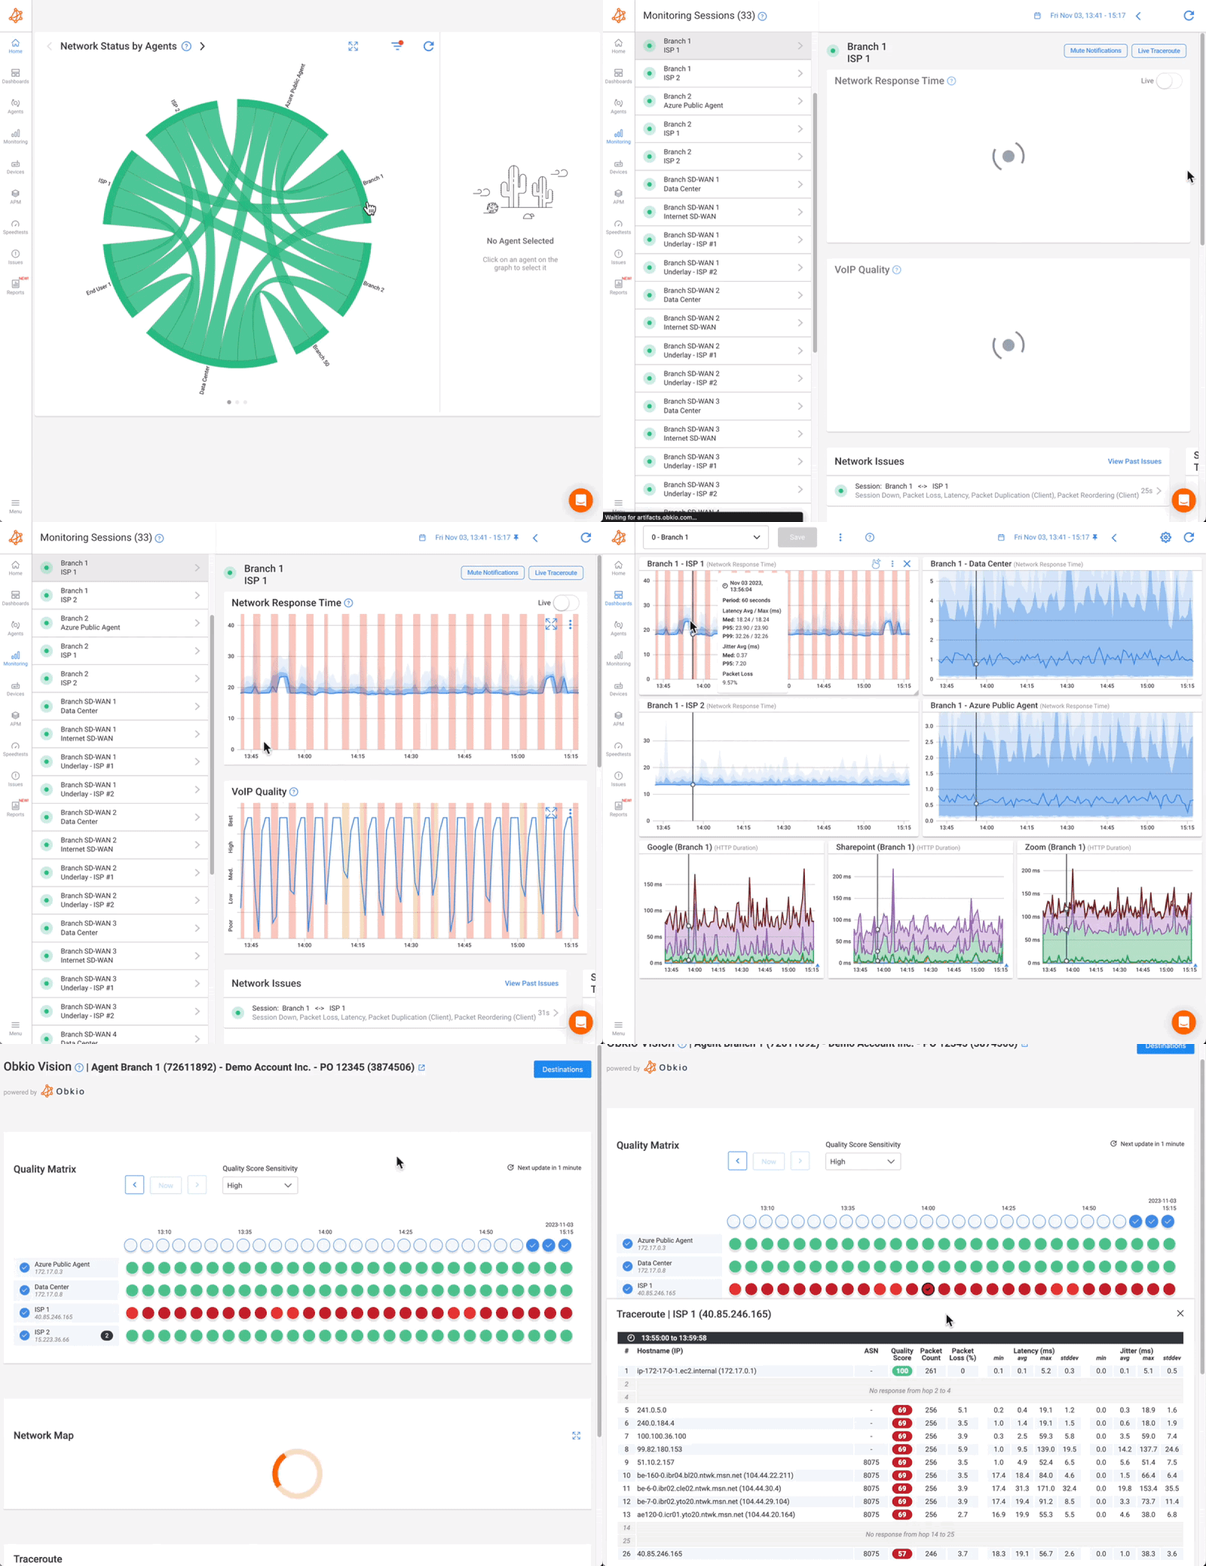
Once you’ve set up your Monitoring Agents for network latency monitoring, they continuously measure metrics like latency measure and collecting data, which you can easily view and analyze on Obkio’s Network Response Time Graph.
Measure latency throughout your network with updates every minute. This will help you understand and measure good latency levels for different applications vs. poor latency. If your latency levels go from good to poor, you can also further drill-down to identify exactly why latency issues are happening, where they’re happening, and how many network locations they’re affecting.
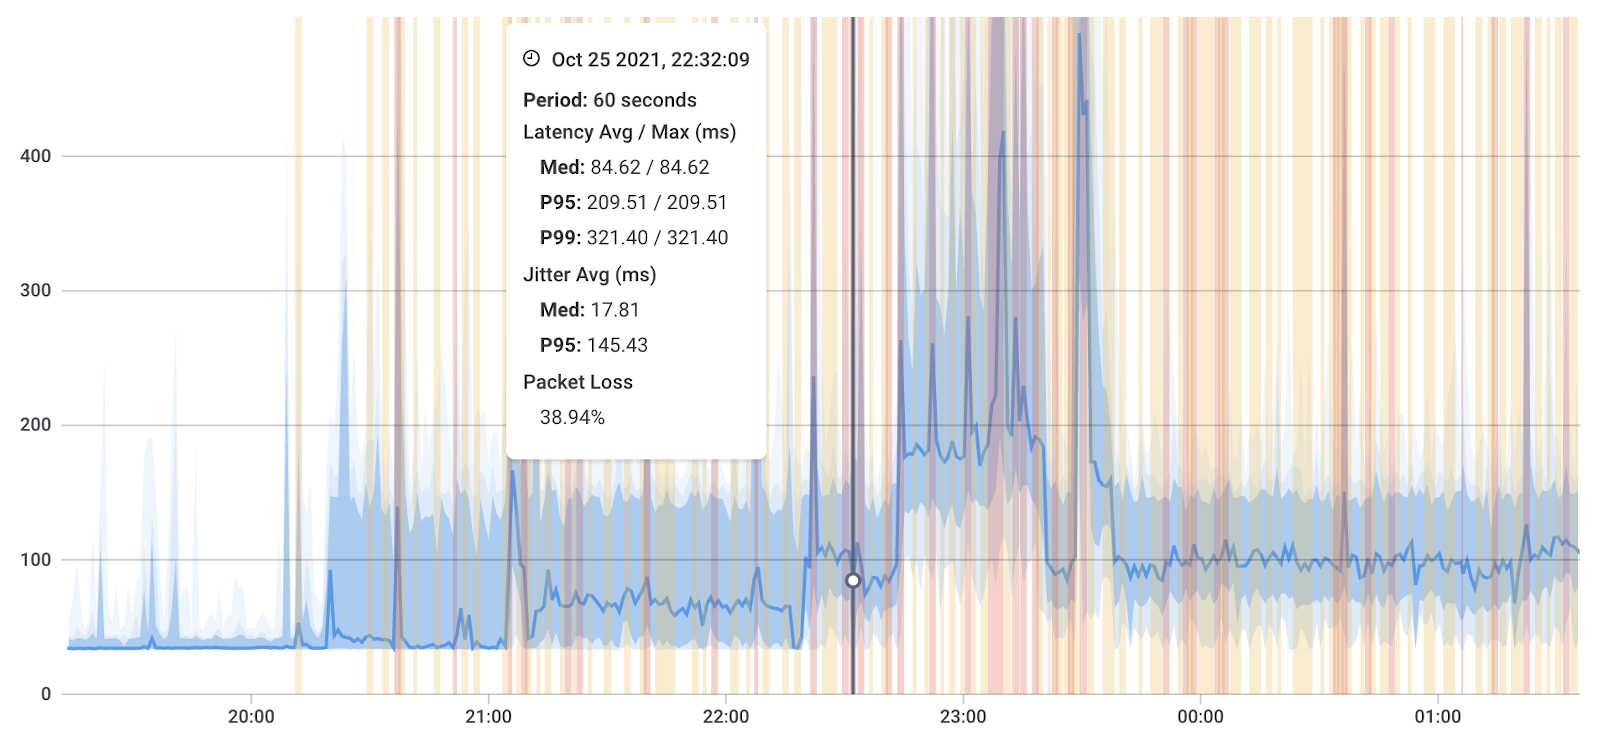
When you measure latency, you need to understand the levels of latency. Certain levels of network latency can affect different applications in different ways. So understanding what's good and what's bad will help you prioritize troubleshooting.
Good latency is generally low latency, which means minimal delay or lag between sending a request or command and receiving a response. It is typically measured in milliseconds (ms). A good network latency measurement is typically considered to be anything less than 100 milliseconds. This means that it takes less than a tenth of a second for data packets to travel from one point to another on the network.
The acceptable level of latency depends on the specific context and application. Here are some general guidelines for different use cases:
- Voice and Video Calls: In real-time communication applications like voice and video calls, lower latency leads to better quality conversations. For voice calls, latency below 150 ms is usually considered good. For video calls, aiming for a latency of 200 ms or lower is desirable.
- Web Browsing: In web browsing, low latency contributes to a faster and more responsive browsing experience. Latency below 100 ms is considered good for most websites.
- Financial Trading: In financial trading, especially high-frequency trading, extremely low latency is crucial. Traders aim for latencies in the range of microseconds (µs) to milliseconds (ms) to gain a competitive edge in executing trades quickly.
- Online Gaming: In online gaming, low latency is crucial for a smooth and responsive gaming experience. Ideally, latency should be below 50 ms, but anything below 100 ms is considered playable. Gamers often aim for the lowest latency possible to reduce any perceived delays.
- Video Streaming: For video streaming services, latency should be kept low to minimize buffering and start-up delays. A latency of below 100 ms is generally considered good for a smooth streaming experience.
It's important to note that while lower latency is generally better, achieving extremely low latency might be challenging and expensive, especially over long distances or in certain network conditions. Different applications and services have different tolerances for latency, and what is considered "good" will vary depending on the specific use case and user expectations.
A bad network latency measurement is typically anything greater than 100 milliseconds. As network latency increases, the user experience can become increasingly frustrating, especially for applications that require real-time data transmission, such as video conferencing or online gaming.
Network latency greater than 500 milliseconds is considered very poor and can result in significant user frustration and impaired application performance.
However, the acceptable latency measurement can vary depending on the specific application or industry. For example:
- Financial trading platforms may require very low latency, with acceptable latencies less than 10 milliseconds
- Video streaming applications may be more tolerant of higher latencies up to 500 milliseconds.
In general, the goal for network administrators is to keep latency as low as possible to ensure optimal network performance and user experience. They can achieve this by optimizing network routing, increasing bandwidth, and reducing congestion on the network.
Regularly measuring network latency is crucial to ensuring that the network is performing at an acceptable level and identifying potential issues before they impact users.

Latency metrics are measurements used to quantify and evaluate the delay or time lag in various aspects of networking and system performance. These metrics help assess the responsiveness and efficiency of network communications. Here are some common latency metrics:
- Round-Trip Time (RTT): RTT is the time it takes for a data packet to travel from the source to the destination and back again. It is often measured by sending a packet from the sender, and the time it takes for the acknowledgment to be received is recorded. RTT is a fundamental metric used to estimate latency between two endpoints.
- One-Way Latency: This metric measures the time it takes for a data packet to travel from the source to the destination without considering the time it takes for the response to return. One-way latency is used in scenarios where bidirectional communication is not necessary, or when analyzing unidirectional network paths.
- Processing Time: In addition to the time spent in transit, processing time measures the delay introduced by network devices (routers, switches, firewalls, etc.) as they process and forward data packets. Minimizing processing time is essential for reducing overall latency.
- Packet Loss Latency: Packet loss latency measures the impact of data packets being lost or dropped during transmission. When packets are lost, retransmission is required, leading to increased latency and potential performance issues.
- Jitter: Jitter refers to the variation in latency over time. It is the irregular delay between successive data packets, and high jitter can cause disruptions in real-time applications like voice and video communications.
- End-to-End Latency: This metric measures the total delay experienced by a data packet from the source to the destination, including all network components' latency contributions.
- Server Response Time: In web applications, server response time measures the time taken by the server to process a user request and generate a response. It includes the time taken for the application logic and database queries.
- Application Response Time: Application response time measures the time it takes for a user action to produce an application response, encompassing both network latency and server processing time.
Measuring and monitoring these latency metrics is essential for network administrators, developers, and service providers to ensure optimal performance, identify bottlenecks, and deliver a seamless user experience for various networked applications and services.
Most latency monitoring tools show you average performance measurements, but Obkio does things differently.
Instead of just showing your poor or good latency, Obkio automatically aggregates data over time to be able to display graphs over a large period of time.
With aggregation, Obkio shows you the worst latency values in the aggregated graph. Let’s say you look at a 30-day period graph and you display the average latency measure every 4 hours. The average may seem like a good latency measurement, but you may have extremely poor latency during one of those hours, which still points to a performance problem.
Compared to other latency monitoring tools, Obkio shows you the worst latency measurements in order to highlight network issues, where they’re located and what’s causing them.
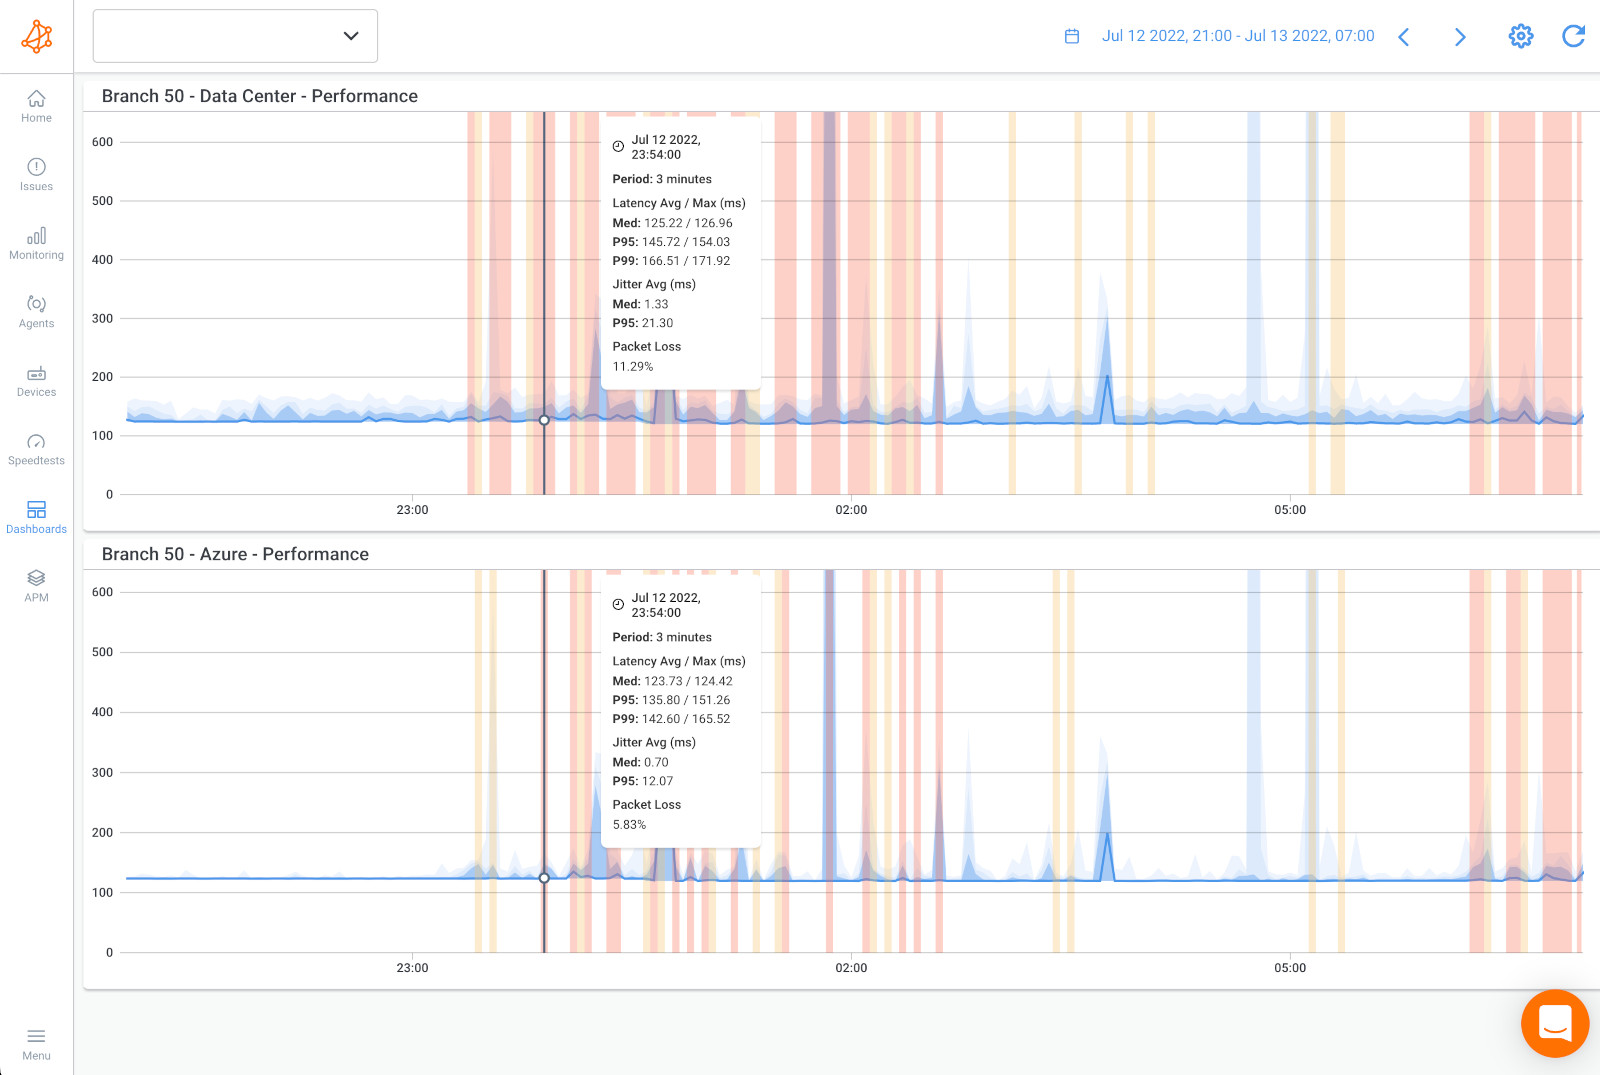
To more accurately measure latency in your network, and receive network monitoring alerts when latency measurements are poor, Obkio sends latency alerts based on historical data and not just static thresholds.
As soon as there’s a deviation in the historical data, and your network is experiencing poor latency measurements, Obkio sends you an alert.
It’s as simple as that.
Network performance is always measured between two points, but depending on where you’re monitoring performance, and even which technology (cable, DSL, fiber) you’re using, your latency values may vary. Because of this, you’d need to set up different latency measure thresholds for every monitoring session - which can be a long process.
By measuring latency based on your network baseline, Obkio makes the setup much quicker and easier.
Once you've identified latency in your network, and measured latency levels, it's time dig deeper to understand when and why the latency happened, and why.
We have a complete article about Troubleshooting and How to Improve Latency but we'll give you a latency troubleshooting summary!
- Is It Really A Network Issue: Check Obkio's graphs to understand if the latency is really related to a network issue, or maybe just a problem on the user's workstation.
- Latency Occurring on Two Network Sessions See if the latency is happening on 2 network sessions, which may mean that the problem is broader and not exclusive to a single network path or destination.
- Latency Occurring on a Single Network Session: This indicates that the latency issue is specific to the location on the Internet being accessed and that the problem is further away.
- Measure Latency with Device Monitoring: This will help you understand whether the latency issue is occurring on your end or over the Internet in your service provider's network, providing valuable information for troubleshooting and resolving the issue.
- Identify CPU and Bandwidth Issues: If you find issues with CPU or bandwidth, it's likely that the problem causing latency is on your end, and you'll need to troubleshoot internally.
- Measure Latency with Traceroutes: To identify the root cause of the latency issue, you can use Obkio's Visual traceroutes to determine if the issue is specific to a particular location on the internet or if it's on your service provider's side. This information can then be used to open a service ticket with your service provider and provide them with as much data as possible to aid in their troubleshooting and resolution of the issue.
In this guide, learn how to troubleshoot and improve network latency with fun analogies, step-by-step instructions, and tips for both users and businesses.
Learn more

It's important to understand what's actually causing latency in your network to be able to fix and improve latency levels. As we mentioned in the previous step, there are different ways you can use Obkio to identify and measure latency casues.
- Network Device Monitoring: To monitor network devices like Firewalls, switches, routers and more, and identify local resources issues like high bandwidth and CPU usage.
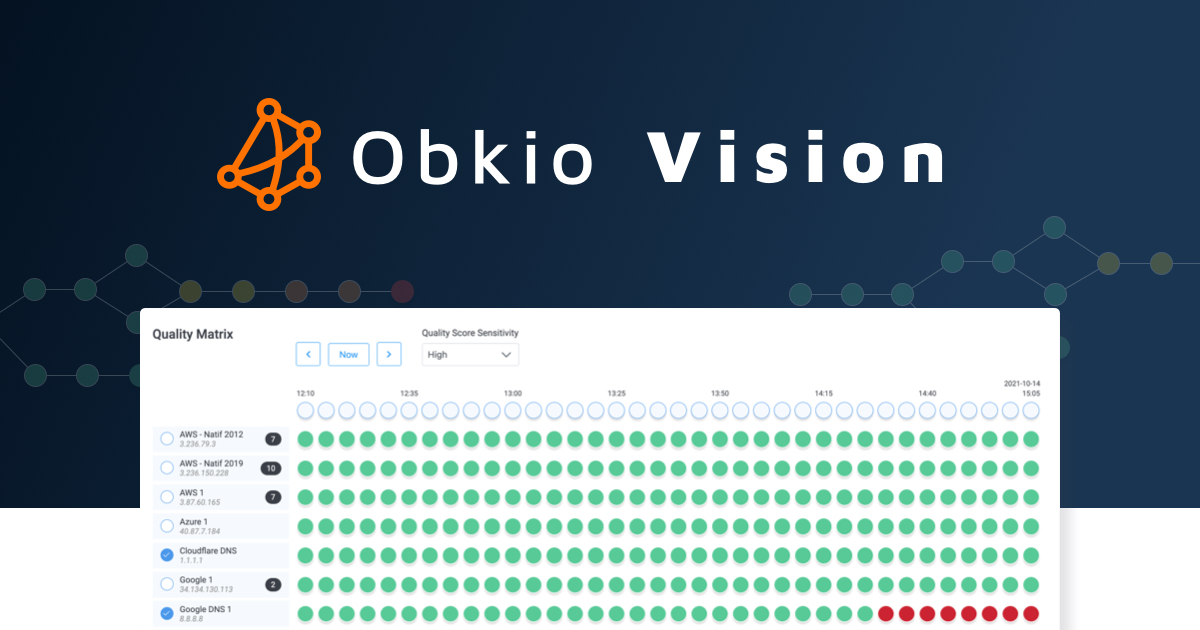
- Obkio Vision Visual Traceroutes: To identify the root cause of the latency issue, you can use traceroutes, the network map, and the quality matrix. By doing so, you can determine if the issue is specific to a particular location on the Internet or if it's on your service provider's side.
These tools will help you identify the root causes of latency in your network, but to help you out, here are some common causes of latency.
- Network Congestion: When there is a lot of traffic on a network, data packets can get delayed as they compete with other packets for bandwidth and cause network congestion (including WAN or LAN congestion).
- Distance: The farther data has to travel between two devices or servers, the longer it takes to arrive, which can increase latency. This can relate to remote workers and remote offices, cloud-based applications that are hosted in a different region or country or servers located in different geographic locations.
- Hardware Limitations: Older or less powerful hardware, such as routers or network switches, may struggle to process and transmit data quickly, leading to latency.
- Software Issues: Bugs or errors in network protocols or applications can cause delays or require additional processing, leading to latency.
- Internet Service Provider (ISP) Limitations: Depending on the type and quality of the Internet connection, ISPs can impose limitations on bandwidth or prioritize certain types of traffic, leading to Internet latency for other types of traffic.
- Server Processing Time: When a server has to process a large amount of data or handle many requests simultaneously, it can slow down the response time and increase latency.
- Environmental Factors: Physical obstacles or electromagnetic interference can disrupt the transmission of data and cause latency.
So, you've set up your latency monitoring and network monitoring with Obkio, and you've successfully identified and troubleshooted those pesky high latency events. Great job! But here's the thing: it's not time to kick back and relax just yet. Keeping up with continuous latency monitoring is still super important. Why, you ask? Well, even after resolving those initial latency issues, continuous monitoring helps you stay ahead of the game!
- Early Detection of Latency Issues: Continuous monitoring allows for the timely detection of latency issues as they arise. By continuously monitoring latency metrics, network administrators can identify sudden spikes, variations, or sustained high latency levels that may indicate underlying problems. This early detection enables proactive troubleshooting and faster resolution before users are significantly impacted.
- Performance Optimization: Continuous latency monitoring provides valuable insights into the performance of different network segments, devices, or applications. It helps administrators identify potential bottlenecks, congestion points, or inefficient routing configurations that can contribute to latency. Armed with this information, organizations can optimize their network infrastructure, allocate resources effectively, and improve overall network performance.
- Real-Time Response: With continuous monitoring, administrators gain real-time visibility into latency metrics. This allows them to respond promptly to any latency issues or network abnormalities. By receiving immediate alerts or notifications about latency spikes or deviations from normal behavior, administrators can investigate and address issues proactively, minimizing the impact on critical operations and user experience.
- Service Level Agreement (SLA) Compliance: For organizations that provide services or applications with latency-sensitive requirements, continuous latency monitoring is essential for meeting network service or Internet SLA commitments. It enables them to measure and report latency performance accurately, ensuring adherence to agreed-upon latency thresholds and service quality standards. It also helps identify potential SLA violations early on, allowing for remedial actions to be taken promptly.
- User Experience Enhancement: Latency directly affects user experience in various applications, such as video streaming, online gaming, and real-time collaboration tools. Continuous latency monitoring helps organizations deliver a smooth and responsive user experience by minimizing latency-related issues like lag, delays, or interruptions. By monitoring and optimizing latency continuously, businesses can enhance customer satisfaction, increase user engagement, and maintain a competitive edge.
As we said above, latency is one of the core network metrics which gives you an overview of your network health and can impact the end user experience.
There are many reasons why you should be measuring latency. Here’s why:
- Monitor Network Performance: Measuring latency in your network to help you understand if data is traveling across your network as quickly and efficiently as it should be. Obkio continuously updates you on latency values to help you understand and troubleshoot problems affecting data transmission in your network.
- Proactively Identify Network Issues: Measuring latency also allows you to proactively identify network problems as soon as they happen. As we said above, measuring latency helps you understand data traveling in your network, and consistent delays or odd spikes in delay time are signs of a major performance issue.
- Create a Performance Baseline: Measuring network latency allows you to compare network performance data over time, create a baseline for optimal performance, and see the impact of changes on your network.
- User Experience: Latency can impact the user experience of applications that require real-time data transmission, such as video conferencing or online gaming. By measuring network latency, you can identify potential latency issues that could impact the user experience and take steps to reduce latency and improve application performance.
- Network Optimization: Measuring network latency can help identify areas of the network where latency is occurring. This information can be used to optimize network routing, increase bandwidth, and reduce congestion, improving overall network performance.
- SLA Compliance: Service level agreements (SLAs) often include guarantees on network latency. By measuring network latency, you can ensure that you are meeting these guarantees and avoid any penalties for non-compliance.
- Troubleshooting: When users report issues with application performance, measuring network latency can help identify whether latency is the cause of the issue. If latency is identified as the problem, you can take steps to reduce latency and improve application performance.
- Capacity Planning: Measuring network latency over time can help identify trends and plan for future capacity requirements. By understanding how network latency changes as network traffic increases, you can ensure that you have sufficient network capacity to meet future demand.
Regularly measuring network latency is essential for maintaining a healthy network and avoiding potential issues that could impact the user experience, along with other network metrics like Packet Loss and Jitter.
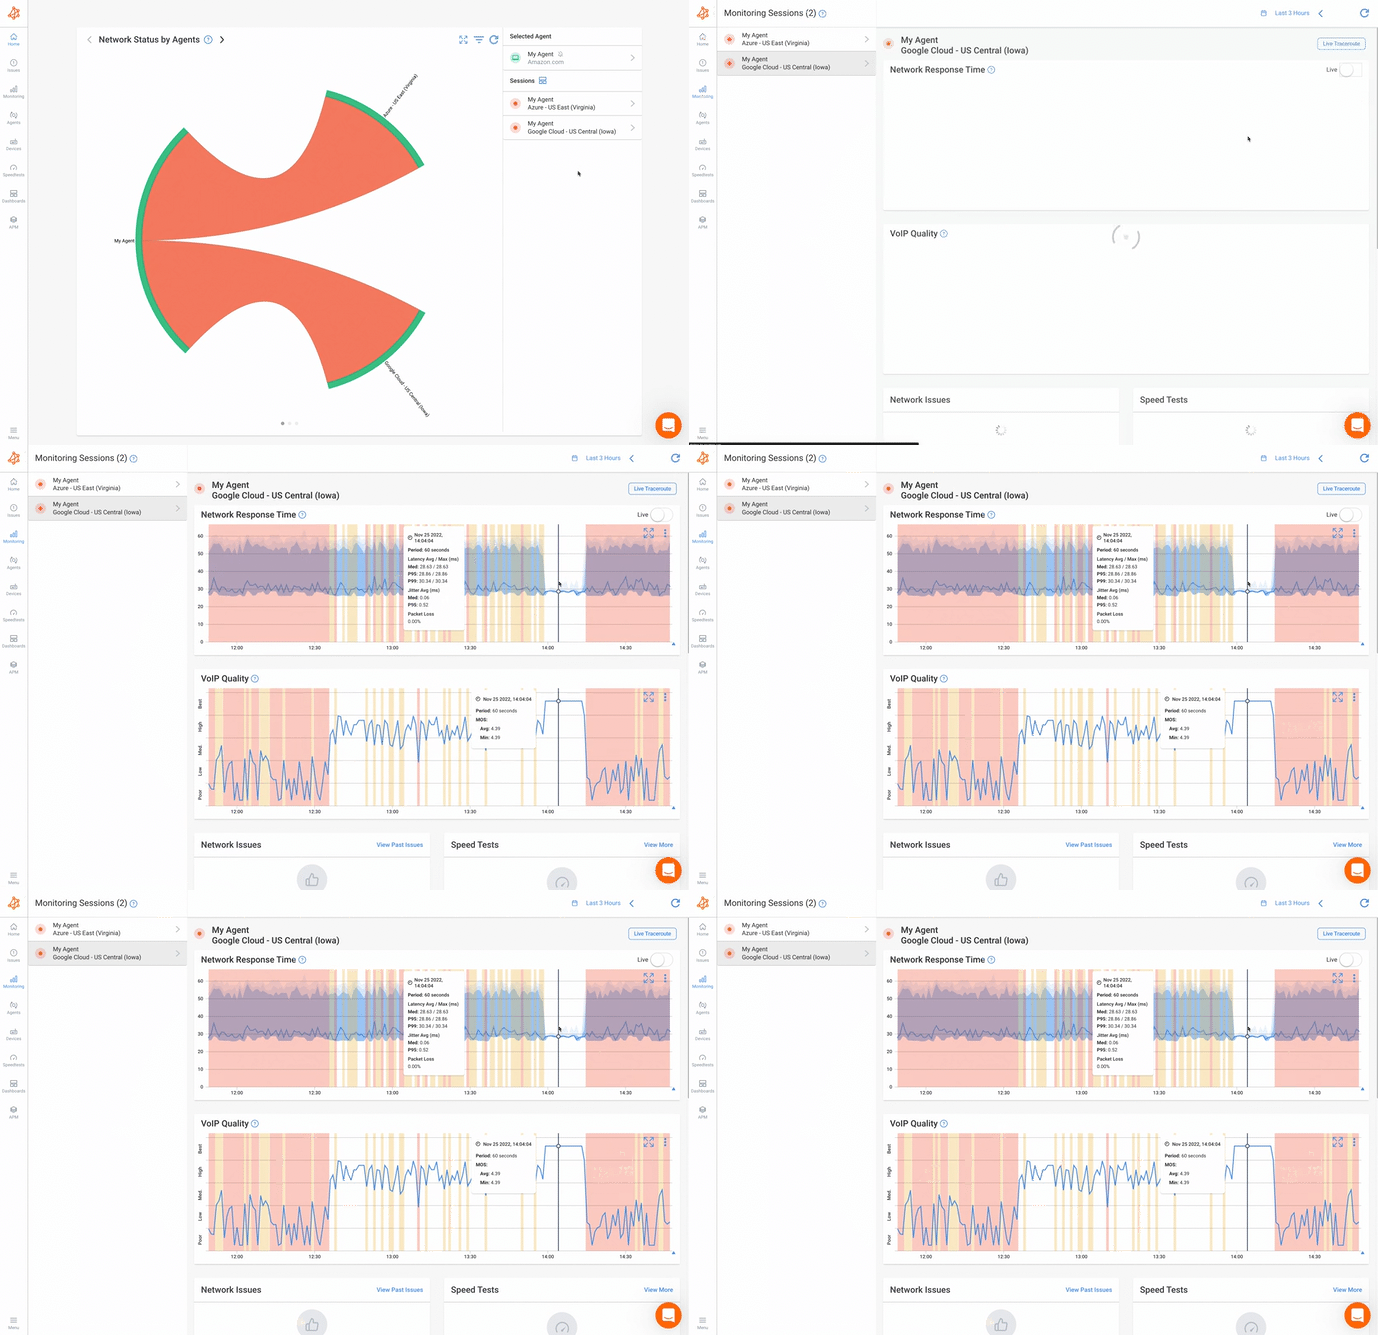

Understanding the performance of computer systems, networks, and services is crucial in today's digital landscape. Two key metrics that play a pivotal role in this assessment are latency vs. response time. While these terms are often used interchangeably, they represent distinct aspects of system behaviour.
Latency measures the time it takes for data to travel from source to destination, focusing on the delay between initiating an action and receiving a response. On the other hand, response time provides a more comprehensive view, encompassing the entire processing duration for a request, including latency and all other processing overheads.
In this section, we delve into the nuances of latency vs. response time to better understand their significance in evaluating and optimizing system performance.
Latency refers to the time delay between the initiation of an action and the beginning of its execution or response. In the context of networking or computer systems, it is the time taken for a data packet to travel from the source to the destination. Latency is typically measured in milliseconds (ms) and is essentially the time it takes for a signal to reach its destination. It is a crucial factor in determining the responsiveness of applications and services.
- Measuring Latency: Latency focuses on the time delay between sending a request or packet and receiving a response. It measures the time spent in transit or in queue before the processing of the request begins.
- Use Case: Latency measurements are crucial for assessing the responsiveness and efficiency of individual components in a system, such as network devices, storage systems, or microservices. Low latency is often desirable in real-time applications like online gaming, financial trading, and telecommunication.
- Example: If you send a ping request to a remote server and measure the time it takes for the server to respond, you are primarily measuring latency.
Response time, on the other hand, is the total time it takes for a system or application to respond to a user request, including the time spent processing the request and the time taken to transmit the response back to the user. It encompasses both the processing time on the server or system side and the network latency. Response time is usually measured in milliseconds (ms) as well.
- Measuring Response Time: Response time provides a more comprehensive view of system performance, as it encompasses both the latency and the time it takes to actually process the request. It measures the end-to-end time experienced by the user or client.
- Use Case: Response time measurements are valuable for understanding how long it takes for a system to deliver results to users. This is particularly important in web applications, database systems, and cloud services, where users care not only about network latency but also about the overall system performance.
- Example: If you visit a website and measure the time it takes from clicking a link to seeing the fully rendered page (including network latency, server processing, and rendering), you are primarily measuring response time.
- Latency: The time it takes for a signal or data packet to travel from the source to the destination.
- Response Time: The total time it takes for a system or application to process a request and send back the response to the user.
In practical terms, if you send a request to a server and it takes 50 ms for the server to receive the request, and then an additional 100 ms to process the request and send back the response, the latency would be 50 ms, and the network response time would be 150 ms. Reducing both latency and response time is desirable for improving the overall performance and user experience of applications and services.
Discover the importance of network response time and how Obkio's Network Monitoring tool facilitates network response time monitoring & optimization.
Learn more

In this guide, we showed you how to measure latency using Synthetic Network Performance Monitoring, which is the most complete and accurate way to measure latency in your entire network, from end-to-end, as well as other components of network performance.
But, you can measure latency using several methods, including:
- Difficulty : Easy
- Time : 30 Minutes
- Accuracy : Average
- Troubleshooting : Basic
- Monitoring : None
Ping is a simple command-line utility that sends a small packet of data to a specific IP address and tests the time it takes for the response to be received. This can be a quick and easy way to get a basic measurement of latency.
Or a simple https://www.speedtest.net/ can do the work for that. You can verify this on multiple devices and scenarios in your network
Here is an example of using the Ping command to measure latency:
Open a Command Prompt or Terminal window on your computer.
Type ping followed by the IP address or hostname of the device you want to test. For example:
ping www.google.com
Press Enter.
The command will send several packets of data to the target device (in this case, the Google website) and test the time it takes for the responses to be received. You will see the results of each ping attempt in the Command Prompt or Terminal window, including the round-trip time (RTT) in milliseconds.
Analyze the results of the ping test. If the RTT is consistently low (less than 50 ms), your latency is likely performing well. If the RTT is high (over 100 ms) or fluctuates significantly, you may have latency issues that require further investigation.
Repeat the test several times over a period of minutes or hours with multiple sites and devices to get a more accurate picture of latency over time.
Here is a an example of what the results of the Ping Command might look like:
Pinging www.google.com [216.58.194.196] with 32 bytes of data:
    Reply from 216.58.194.196: bytes=32 time=11ms TTL=118
    Reply from 216.58.194.196: bytes=32 time=12ms TTL=118
    Reply from 216.58.194.196: bytes=32 time=10ms TTL=118
    Reply from 216.58.194.196: bytes=32 time=9ms TTL=118
Ping statistics for 216.58.194.196:
    Packets: Sent = 4, Received = 4, Lost = 0 (0% loss),
    Approximate round trip times in milli-seconds:
    Minimum = 9ms, Maximum = 12ms, Average = 10ms
In this example, the Ping command sent four packets of data to the IP address associated with www.google.com and received all four packets back without any loss. The "time" value for each packet represents the round-trip time in milliseconds, or the amount of time it took for the packet to travel from the computer to the Google server and back.
The Ping statistics at the bottom of the output show that the minimum, maximum, and average round-trip times were 9ms, 12ms, and 10ms, respectively.
Here are some scenarios using ping to troubleshoot latency (the following commands are different on mac and linux):
- Ping the Local Host: Start by pinging the local host to ensure that your computer is functioning correctly. Type
ping localhostin the command prompt or terminal to check if the response time is within an acceptable range. If the response time is high, it could indicate an issue with your computer's network adapter or other hardware problems. - Ping the Default Gateway: Ping the default gateway to verify that your computer can communicate with the local network. Type
ping <default gateway IP address>in the command prompt or terminal. If the response time is high or there are lost packets, it could indicate issues with the local network or router. - Ping a Remote Host: Ping a remote host on the Internet to check if latency issues are due to the network infrastructure or the remote host. Type
ping <remote host IP address>in the command prompt or terminal. If the response time is high or there are lost packets, it could indicate issues with the remote host or the network infrastructure. - Ping Traceroute: Use the ping command with the
-Tflag to perform a traceroute and identify the specific point where latency is occurring. Typeping -T <remote host IP address>in the command prompt or terminal. The output will display the response time and the IP address of each router the ping passes through. If there is a high response time at a specific router, it could indicate an issue with that router or network segment. - Ping Flood Test: Use the ping command with the
-fflag to perform a flood test and identify the maximum packet rate before lost packets occur. Typeping -f <remote host IP address>in the command prompt or terminal. The output will display the packet loss rate. If there is high packet loss, it could indicate issues with the network infrastructure or the remote host.
These scenarios using ping can help troubleshoot latency issues and identify specific points of failure in the network infrastructure. It's important to use multiple tools and tests to diagnose latency issues and ensure that your network is running smoothly.
Note that the actual round-trip time may vary depending on a variety of factors, including network congestion and the distance between the computer and the server.
Additionally, the results of the Ping command may not always be indicative of true latency, as factors such as network congestion or device processing times can impact the accuracy of the results.
However, like mentioned before, Ping can be a useful tool for quickly getting a basic measurement of latency.
- Difficulty : Easy
- Time : 30 Minutes
- Accuracy : Average
- Troubleshooting : Limited
- Monitoring : None

Traceroute is another command-line utility that can be used to identify the path that network traffic takes between two devices. By testing the time it takes for data to travel between each hop along the way, you can identify potential sources of latency.
Leverage Obkio Vision to monitor, detect and troubleshoot network problems with visual traceroutes, IP route historic and graphical network maps.
Try for Free

Here is an example of a Traceroute command to measure latency:
Open a Command Prompt or Terminal window.
Type "tracert" followed by the IP address or hostname of the device you want to test. For example: tracert 192.168.1.1 or tracert www.google.com
Press Enter.
The command will send packets of data to the target device and test the time it takes for the responses to be received at each hop along the network path. You will see the results of each hop in the Command Prompt or Terminal window, including the time it takes for each hop to respond.
To stop the Traceroute command, press Ctrl+C.
In this example, the Traceroute command traced the network path from the computer to the Google server associated with www.google.com.
Each line of the output represents a hop along the network path, with the first column showing the hop number, the second column showing the round-trip time for each hop in milliseconds, and the third column showing the IP address of the device at each hop.
Tracing route to www.google.com [172.217.11.196] over a maximum of 30 hops:

1   1 ms     1 ms     1 ms  192.168.1.1
2   8 ms     8 ms     9 ms  10.1.10.1
3   10 ms    11 ms    10 ms  68.85.106.245
4   13 ms    12 ms    14 ms  68.85.108.61
4   11 ms    12 ms    12 ms  68.86.90.5
5   19 ms    20 ms    19 ms  68.86.85.142
6   29 ms    29 ms    28 ms  72.14.219.193
7   29 ms    28 ms    28 ms  108.170.245.81
8   29 ms    29 ms    28 ms  216.239.47.210
9   29 ms    28 ms    28 ms  172.217.11.196

Trace complete.
Here are some scenarios using traceroute to troubleshoot latency (the following commands are different on mac and linux):
Download Obkio's free Complete Guide to Traceroutes to learn to identify network problems with the most popular network troubleshooting tool for IT Pros.
Download Now

- Traceroute the Local Host: Start by performing a traceroute to the local host to ensure that your computer is functioning correctly. Type
traceroute localhostin the command prompt or terminal to check if the response time is within an acceptable range. If the response time is high, it could indicate an issue with your computer's network adapter or other hardware problems. - Traceroute the Default Gateway: Traceroute the default gateway to verify that your computer can communicate with the local network. Type
traceroute <default gateway IP address>in the command prompt or terminal. If the response time is high or there are lost packets, it could indicate issues with the local network or router. - Traceroute a Remote Host: Traceroute a remote host on the Internet to check if latency issues are due to the network infrastructure or the remote host. Type
traceroute <remote host IP address>in the command prompt or terminal. The output will display the response time and the IP address of each router the traceroute passes through. If there is a high response time at a specific router, it could indicate an issue with that router or network segment. - Traceroute ICMP Ping: Use the traceroute command with the
-Iflag to perform an ICMP ping and identify the specific point where latency is occurring. Typetraceroute -I <remote host IP address>in the command prompt or terminal. The output will display the response time and the IP address of each router the traceroute passes through. If there is a high response time at a specific router, it could indicate an issue with that router or network segment. - Traceroute UDP Probe: Use the traceroute command with the
-Uflag to perform a UDP probe and identify the specific point where latency is occurring. Typetraceroute -U <remote host IP address>in the command prompt or terminal. The output will display the response time and the IP address of each router the traceroute passes through. If there is a high response time at a specific router, it could indicate an issue with that router or network segment.
These scenarios using traceroute can help troubleshoot latency issues and identify specific points of failure in the network infrastructure. It's important to use multiple tools and tests to diagnose latency issues and ensure that your network is running smoothly. You can use Traceroutes, Ping and IP Monitoring.
The Traceroute command can help identify potential sources of latency by showing the round-trip time for each hop along the network path. Note that the actual round-trip time may vary depending on a variety of factors, including network congestion and the distance between the computer and the server.
Additionally, Traceroute may not always provide an accurate measurement of true latency due to factors such as network congestion or device processing times.
Learn how to use Obkio Vision’s Visual Traceroute tool to troubleshoot network problems with traceroutes in your LAN, WAN, and everything in between.
Learn more

Pathping: Pathping is a combination of ping and traceroute. It sends packets to a target device and measures the round-trip time for each hop in the network path. This can help identify the network hops where latency may be occurring and provide a more detailed view of the network performance.
- Difficulty : Hard
- Time : 1 Hour
- Accuracy : Good
- Troubleshooting : Good
- Monitoring : Limited
Network analyzers can provide a detailed view of network traffic, including latency metrics. By capturing and analyzing packets of data, you can identify patterns and trends that may indicate latency issues.
Here is a list of popular network analyzers:
- Wireshark: This is a free and open-source network monitoring tool that can capture and analyze packets in real-time. It supports a wide range of protocols and features a user-friendly interface.
- Microsoft Network Monitor: This is a free network analyzer from Microsoft that can capture and analyze packets on Windows-based systems. It includes a user-friendly interface and supports a range of network monitoring protocols.
- Colasoft Capsa: This is a network analyzer that can capture and analyze packets in real-time. It includes features like protocol analysis, traffic analysis, and network diagnosis.
- Nmap: This is a free and open-source network scanner that can be used as a network analyzer. It can identify hosts and services on a network and provide information on network performance.
- NetWitness: This is a network analyzer that can capture and analyze packets in real-time. It includes features like deep packet inspection, application analysis, and network forensics.
These are just a few examples of the many network analyzers available. The best one for you will depend on your specific needs and requirements.
Network analyzers are powerful tools that can help measure latency in several ways. Here are some of the ways that network analyzers can be used to test network latency:
- Packet Capture: Network analyzers can capture packets traveling across the network and analyze them for latency issues. By looking at the time stamps on packets, network analyzers can identify the latency between devices on the network and pinpoint where delays are occurring.
- Protocol Analysis: Network analyzers can analyze network protocols to identify any issues that may be causing latency problems. This includes analyzing protocol-specific features like flow control and congestion avoidance, which can impact latency.
- Traffic Generation: Network analyzers can generate traffic on the network to simulate real-world conditions and measure latency under different load conditions. By generating traffic, network analyzers can identify where latency issues occur and how they impact the network.
- Network Simulation: Network analyzers can simulate network traffic to measure latency in a controlled environment. This allows network administrators to test different scenarios and identify potential latency issues before they occur in the real world.
- Network Visualization: Network analyzers can provide a visual representation of network traffic and latency, called network visualization, allowing network administrators to quickly identify potential issues and take corrective action.
In summary, network analyzers are essential tools for measuring latency because they can capture packets, analyze protocols, generate traffic, simulate networks, and provide network visualization.
By using these tools, network administrators can quickly identify and troubleshoot latency issues, ensuring that their network is running smoothly and providing the best possible experience for users.
- Difficulty : Medium (or Easy with Obkio <3)
- Time : 1 Hour
- Accuracy : Excellent
- Troubleshooting : Excellent
- Monitoring : Excellent


Network performance monitoring tools are essential for measuring latency because they provide a comprehensive view of network performance and can detect even minor issues that can impact the user experience. These tools allow you to continuously monitor latency values and provide real-time alerts when there are problems.
Additionally, they can help you diagnose issues and troubleshoot problems more quickly, reducing the time it takes to resolve issues and minimize downtime.
With network performance monitoring tools, you can gain a deeper understanding of your network, optimize its performance, and ensure that your users have the best possible experience.
There are several reasons why a network performance monitoring tool is essential for latency problems, including:
- Continuous Monitoring: Network performance monitoring tools can continuously monitor latency values, allowing you to detect issues as soon as they arise. This ensures that you are alerted to any latency problems before they impact the user experience.
- Real-Time Alerts: Network performance monitoring tools can provide real-time alerts when latency exceeds certain thresholds, ensuring that you can take immediate action to address the issue.
- Accurate Diagnostics: Network performance monitoring tools can accurately diagnose the cause of latency problems, allowing you to identify the root cause of the issue and take appropriate tests to address it.
- Troubleshooting Assistance: Network performance monitoring tools can assist with troubleshooting by providing detailed information on network latency patterns and trends. This information can help you identify potential sources of latency problems and take corrective action.
- Performance Optimization: Network performance monitoring tools can help you optimize network performance by identifying areas of the network where latency is occurring. With this information, you can make adjustments to network routing, increase bandwidth, and reduce congestion, improving overall network performance.
- SLA Compliance: Network performance monitoring tools can help ensure that you are meeting your service level agreements (SLAs) for network latency. By monitoring latency values, you can ensure that you are meeting your SLAs and avoid any penalties for non-compliance.
In summary, latency can be measured using several methods, including ping, traceroute, pathping, network analyzers, and synthetic monitoring tools. The method you choose will depend on your business' needs and resources.
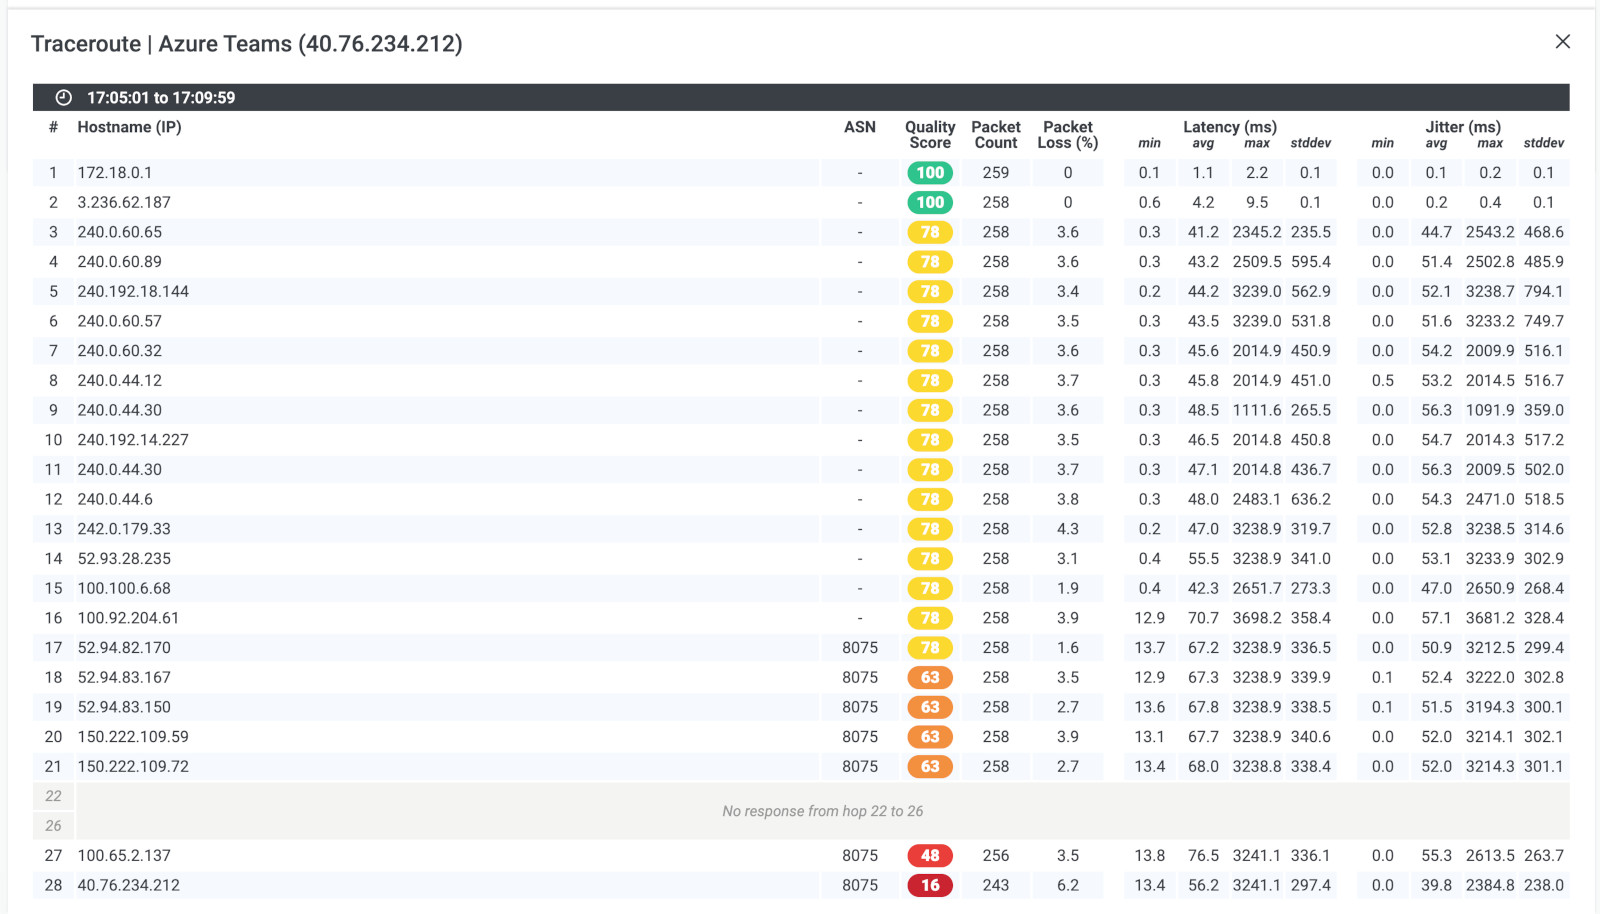
When it comes to measuring latency in network communications, two distinct approaches emerge: dedicated latency monitoring tools and end-to-end network monitoring tools. While both aim to assess and address latency issues, they differ in their scope and focus.
In this article, we showed you how to measure latency with a Network Monitoring tool, because it is the most complete solution for understanding and troubleshooting your network performance. But let's explore the differences in more detail.
A dedicated latency monitoring tool focuses specifically on measuring and analyzing latency in network communications. These tools are designed to provide granular insights into latency metrics, such as round-trip time (RTT), packet loss, jitter, and latency variations. They often employ specialized techniques, such as sending test packets or pinging specific network endpoints, to accurately measure latency.
- Highly specialized: Latency monitoring tools are optimized for measuring and analyzing latency metrics with precision.
- Granular insights: These tools provide detailed information about latency, allowing administrators to pinpoint latency issues and troubleshoot them efficiently.
- Real-time monitoring: Latency monitoring tools offer real-time data updates and visualizations, enabling administrators to monitor latency fluctuations as they occur.
- Limited scope: Latency monitoring tools typically focus solely on latency-related metrics and may not provide comprehensive information about other aspects of network performance.
- Lack of context: They may not offer insights into the broader network infrastructure or identify potential root causes of latency issues.
An end-to-end network monitoring tool provides a comprehensive view of the entire network infrastructure, including latency monitoring as one of its features. These tools monitor various network parameters, such as bandwidth utilization, network congestion, network utilization, device health, and application performance, in addition to latency. Pros:
- Holistic view: End-to-end network monitoring tools provide a comprehensive perspective on network performance, including latency metrics, as part of a broader monitoring solution.
- Contextual insight: These tools analyze latency in relation to other network parameters, allowing administrators to identify correlations and potential causes of latency issues.
- Scalability: End-to-end network monitoring tools can handle large-scale networks, making them suitable for enterprises with complex infrastructures.
- Less specialized: While end-to-end network monitoring tools offer latency monitoring capabilities, they may not provide the same level of granularity and focus as dedicated latency monitoring tools.
- Potential complexity: The comprehensive nature of end-to-end network monitoring tools may require additional configuration and setup, making them more complex to implement and maintain.
In summary, a dedicated latency monitoring tool excels in providing specific and detailed insights into latency metrics, while an end-to-end network monitoring tool offers a broader perspective on network performance, including latency, within a comprehensive monitoring framework. The choice between the two depends on the specific needs and priorities of the network administrators.
When you're measuring latency, you'll often come across two important terms: one-way latency and round-trip time (RTT). Both measure network delay, but they do so in different ways. Here's what you need to know about each:
RTT is the total time it takes for a packet to travel from your device to a destination and back again. This is often what tools like ping measure by default. The packet goes to the destination and then returns, so RTT captures the full round journey.
How to Measure RTT:
- Ping (built-in command): When you use the ping command, it measures the RTT for each packet sent and provides a time in milliseconds (ms).
ping www.example.com
The result will look something like:
Reply from 93.184.216.34: bytes=32 time=25ms TTL=50
The time=25ms is your RTT.
RTT is most commonly used because it gives you a quick look at how long it takes for data to travel to and from a destination.
One-way latency measures the time it takes for a packet to travel from its source to its destination. Unlike RTT, which includes both the outbound and return journey, one-way latency focuses only on the time in one direction.
How to Measure One-Way Latency:
Measuring one-way latency is trickier because it requires synchronized clocks between the source and destination. Without synchronized clocks, it's impossible to measure it accurately just from one end. However, some tools, like iPerf, can provide an estimate of one-way latency by calculating the time taken for packets to travel from the sender to the receiver.
One-way latency is particularly important for real-time applications like VoIP, gaming, and live video streaming, where delays in only one direction can be very noticeable.
- Ping and Traceroute typically measure RTT by default.
- iPerf and Obkio allow you to measure one-way latency with more precision when using synchronized clocks across endpoints.
Knowing the difference and how to measure each type of latency helps you diagnose specific issues, whether it’s a round-trip problem or a one-way delay that’s impacting your applications.
In conclusion, measuring latency may not be the most thrilling activity, but it's certainly essential for ensuring optimal performance and user satisfaction. Remember, when it comes to latency, speed isn't everything - sometimes it's the lack thereof that can make all the difference.
Businesses need to be aware of the impact latency can have on their operations and bottom line. The need for speed is often a top priority, but it's important to remember that a lack thereof can be equally detrimental. By measuring and optimizing latency, businesses can improve their customer experience, reduce downtime, and increase productivity.
So don't wait around - take control of your latency with the only tool that simplifies the process: Obkio's Network & Latency Monitoring tool/
After all, time is money, and in the fast-paced world of business, every millisecond counts.
- 14-day free trial of all premium features
- Deploy in just 10 minutes
- Monitor performance in all key network locations
- Measure real-time network metrics
- Identify and troubleshoot live network problems


 Obkio Blog


