Table of Contents
Table of Contents
If you've ever wondered why your Internet connection seems slow or experiencing connection problems with a website, you might have heard of a tool called "traceroute." But what is a traceroute, and how does it work? In this article, we'll be teaching you everythignt hat you need to know about what are traceroutes, key traceroute details, how to run traceroutes, and how traceroutes work to help identify and troubleshoot network problems.
Traceroute is the most popular tool that network engineers use to troubleshoot networks. Traceroutes allow you to trace the route taken by packets of data from your computer to a destination on the Internet. By identifying each hop along the way, traceroute can help pinpoint where a connection issue or network disconnection may be occurring.
Traceroutes were invented in 1987 and are still highly relevant in today's world of network monitoring tools and network troubleshooting tools.
Traceroutes are always sometimes referred to a Tracert for Windows or IP Traceroute.
Traceroute helps identify the network path, including routers and servers, that data travels through, and can reveal issues such as network congestion, timeouts, or routing problems. Before we get into all the nitty-gritty details, let's look over some traceroute details you should know:
1. Purpose: Traceroute is primarily used to diagnose network connectivity issues. It helps pinpoint where packets are being lost or experiencing delays along the path to a destination.
2. Command: Traceroute is commonly accessed through the command line interface (CLI) on Unix-like operating systems (such as Linux or macOS) or through the Command Prompt on Windows. The basic syntax is:
traceroute [destination]
Replace [destination] with the IP address or domain name you want to trace.
- You can also use Traceroute tool like Obkio Vision: Visual Traceroute Tool, which is offered as a standalone tool, or as a feature part of Obkio's complete Network Monitoring solution.
3. Output: When you run traceroute, it sends a series of UDP or ICMP packets to the destination with increasing Time-To-Live (TTL) values. Each router along the path decrements the TTL, and when it reaches zero, the router sends back an ICMP "Time Exceeded" message. Traceroute collects these messages to build a map of the network path. The output typically includes:
- IP addresses of routers along the path.
- Round-trip time (RTT) for each hop, indicating the delay between sending a packet and receiving a response.
- Hostnames, if available, for the IP addresses encountered.
4. Hop-by-Hop Analysis:
- Hop Number: Each line in the traceroute output represents a "hop" along the path, numbered sequentially.
- IP Address: Shows the IP address of the router or server at each hop as a form of IP monitoring.
- RTT: The round-trip time for each hop, often displayed in milliseconds. High RTT values can indicate network congestion or delays.
- Hostname: If DNS resolution is enabled, traceroute may display the hostname associated with each IP address.
5. Options:
-n: Prevents traceroute from performing reverse DNS lookups for IP addresses, which can speed up the output.-m max_ttl: Sets the maximum number of hops to trace.-w timeout: Specifies the timeout in seconds for waiting for a response from each hop.
6. Interpretation:
- Asterisks (*) or Timeouts: Indicates hops where no response was received within the specified timeout period. This could be due to firewall rules, network congestion, or routing issues.
- Increasing RTT: If RTT values increase significantly at certain hops, it may indicate network congestion or problematic routers.
- Loop or Redundant Paths: Traceroute can detect loops or redundant paths in the network, which can lead to inefficiencies or connectivity issues.
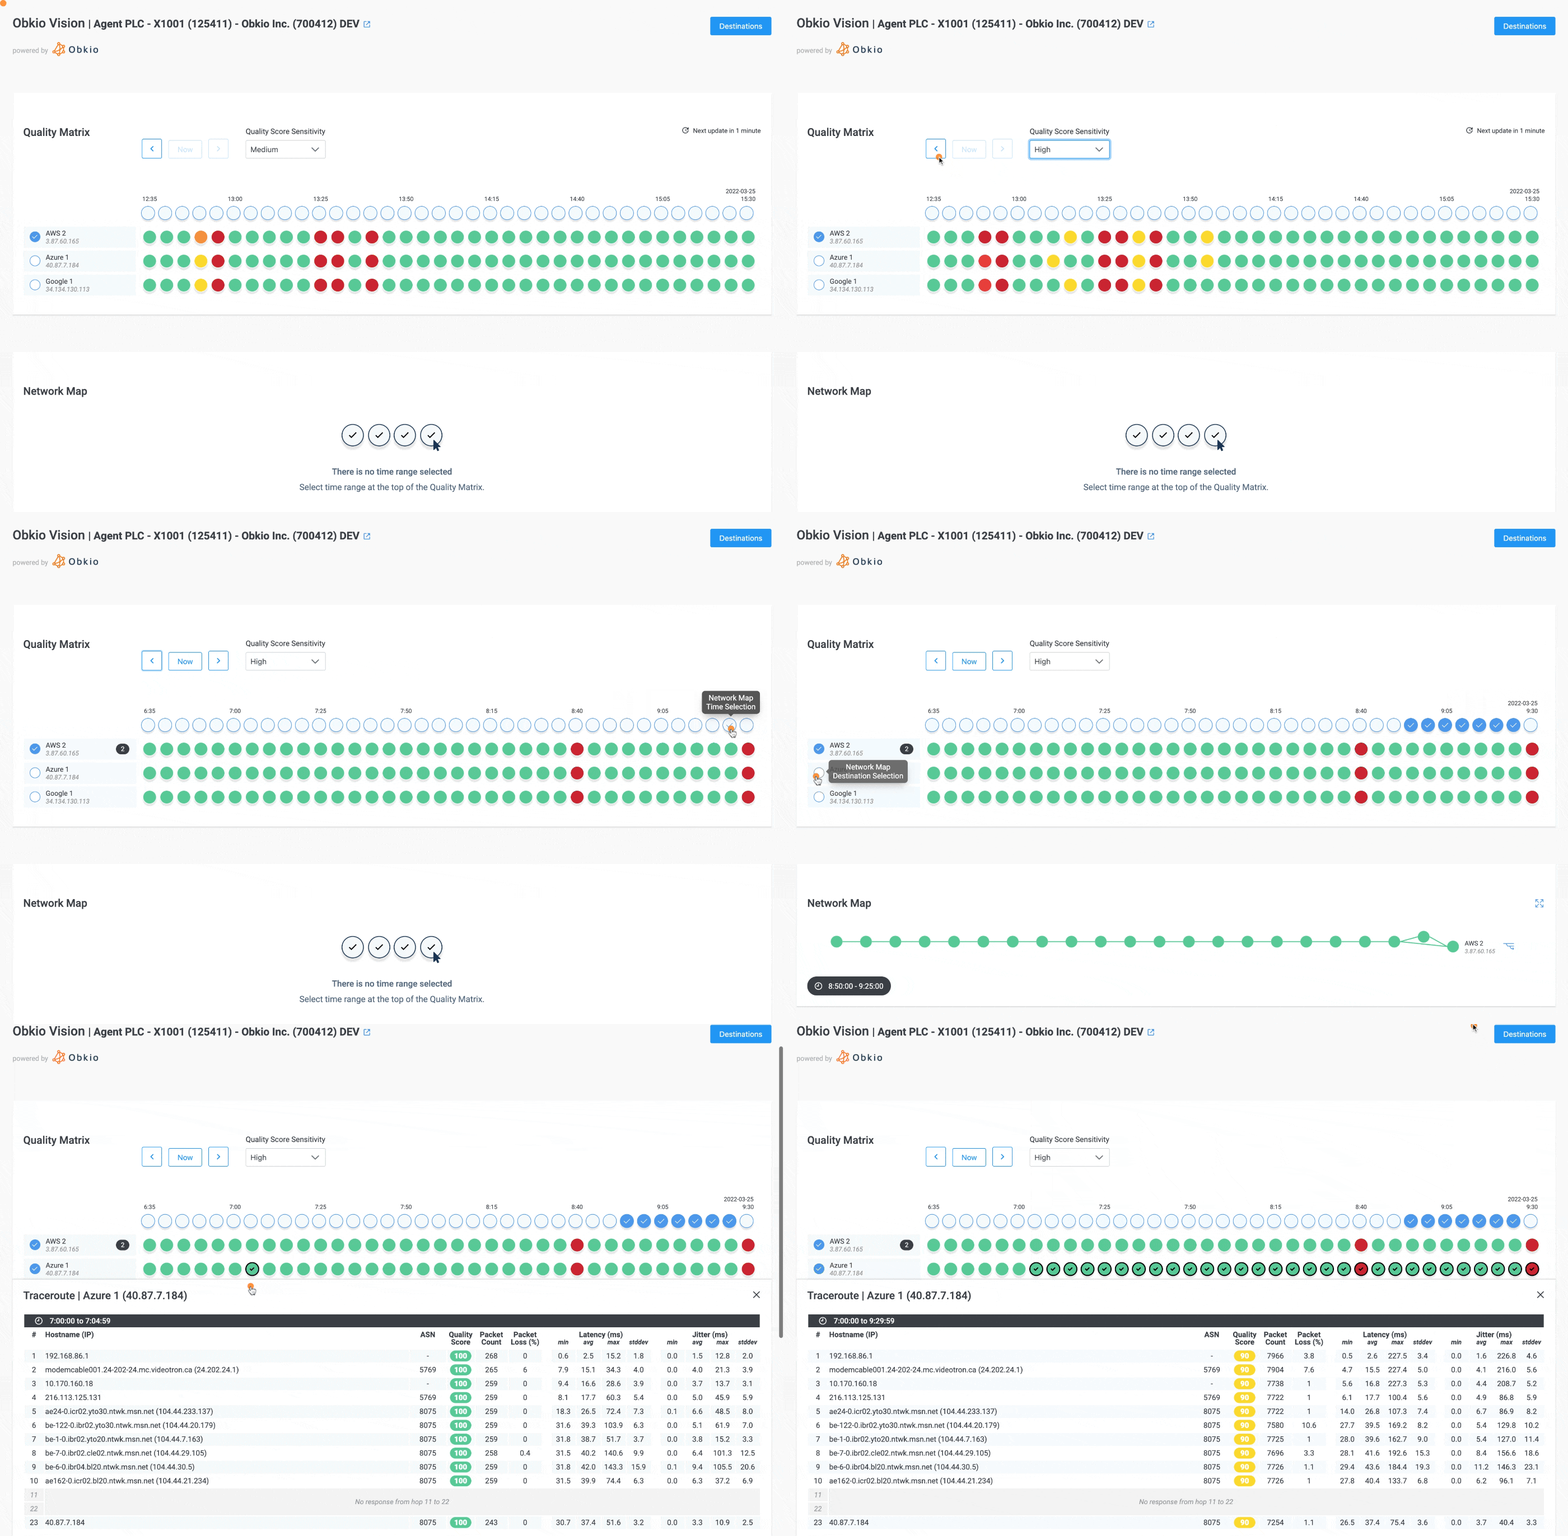 From Obkio Vision: Visual Traceroute Tool
The traceroute command is available on various operating systems, including Unix-like systems (such as Linux and macOS) and Windows. It is used from the command line or terminal.
In Unix-like systems (Linux and macOS), the syntax for the traceroute command is typically as follows:
traceroute [options] destination
In Windows, the equivalent command is "tracert":
tracert [options] destination
Here's a breakdown of the basic usage and some common options of the traceroute command:
- Options: Traceroute commands often come with various options that allow you to customize the behavior of the command. Some common options include:
-q: Specifies the number of probes (query packets) to be sent to each hop.-m(or-h): Specifies the maximum number of hops or TTL (Time-to-Live) value.-w: Specifies the timeout for waiting for a response from each hop.- Destination: The "destination" parameter is the target host or server to which you want to trace the route. You can provide either an IP address or a domain name.
"Tracert" and "traceroute" refer to the same type of network diagnostic tool, but they are used in different operating systems.
Tracert is the command used in Windows operating systems (such as Windows 10, Windows 7, etc.) to perform the traceroute functionality. It stands for "Trace Route" and is used to trace the route that data packets take from a source to a destination over a network. Tracert provides information about the routers or intermediate devices that the packets encounter along the way, as well as the time it takes for the packets to travel to each of these devices.
Traceroute is the command used in Unix-like operating systems (such as Linux, macOS, etc.) to achieve the same traceroute functionality. It's a network diagnostic tool that traces the path of data packets as they travel from the source to the destination. Traceroute displays a list of routers or hops, along with their IP addresses, domain names (if available), and the round-trip time for the packets to reach each hop.
In essence, both "tracert" and "traceroute" serve the same purpose and provide similar information, but they are specific to their respective operating systems. They help network administrators and users diagnose network connectivity issues and identify potential bottlenecks or delays in data transmission across networks.
Now, what does traceroute do? As its name suggests, the main purpose of a traceroute is to trace the IP route from a source to a destination inside an IP network. A network traceroute shows the user the routers but also the round-trip latency from the source to each of the routers.
Traceroute commands are available on almost any host. On Windows, there is the tracert.exe command and on Linux and MacOS it’s the traceroute command. There are other free and commercial software that do traceroutes such as the Obkio Monitoring Agent. Here is an example from Obkio Live Traceroute feature:
+---+-------------------+-------+-----+------+------+------+------+
| # | Hostname          | Loss% | Snt | Last |  Avg | Best | Wrst |
+---+-------------------+-------+-----+------+------+------+------+
| 1 | 192.168.1.1       |   0.0 |  20 |  4.3 |  1.5 |  0.4 |  4.3 |
| 2 | router1.ispA.com  |   0.0 |  20 |  6.8 | 15.4 |  6.8 | 35.9 |
| 3 | router2.ispB.com  |   0.0 |  20 | 12.3 | 13.7 |  8.4 | 28.1 |
| 4 | router3.ispC.com  |   0.0 |  20 | 11.3 | 13.8 |  9.0 | 38.4 |
| 5 | website.com       |   0.0 |  20 | 12.8 | 16.1 | 10.4 | 38.4 |
+---+-------------------+-------+-----+------+------+------+------+
It's important to understand that traceroutes will only trace Layer 3 IP Routers or Hosts. If there is a switch or wifi access point between two routers, a traceroute will not show them even if they have a management IP to access them. A switch with Layer 3 / IP routing features will appear only if it is routing the packets.
Learn everything you need to know about what is a traceroute, how traceroutes work, how to read a traceroute, and how they help network engineers troubleshoot network issues in our free complete guide to traceroutes! Download the guide to take it access it anytime, anywhere.

Now that we've discussed what traceroutes are, let's go over what traceroutes are actually used for in the world of networking.
- Troubleshooting Network Issues: Traceroutes are commonly used by network administrators and technicians to identify where network issues are occurring. By tracing the path of data packets, they can identify which network node is causing packet loss, latency, or other issues.
- Identifying Internet Service Provider (ISP) Issues: If you're experiencing slow internet speeds or connection issues, a traceroute can help determine if the issue is with your ISP or with the website or service you're trying to connect to.
- Verifying Routing: Traceroutes can be used to verify that data packets are taking the correct route through a network, ensuring that they're passing through the necessary security and performance checks.
- Investigating Cyberattacks: Traceroutes can be used to track the path of a cyberattack, helping to identify the source and potentially prevent future attacks.
- Testing Network Performance: Traceroutes can be used to measure network performance, such as latency and packet loss, allowing you to optimize your network for better performance.
Stop looking for the perfect Traceroute tool - Obkio Vision is right here!
Obkio Vision is a free visual traceroute tool and IP route historic monitor that runs continuously to interpret Traceroute results for you and help troubleshoot network problems (in your WAN and over the Internet) faster and easier than ever.
Unlike traditional traceroute commands and tools, Obkio Vision visualizes and interprets traceroutes for you, so you can see the information that really matters. In addition, you can use Obkio Vision with Obkio's Complete Network Performance Monitoring tool, for continuous network monitoring and troubleshooting.
Some of Obkio Vision’s next-generation features include:
Monitor multiple network destinations during a span of 3 hours. IP addresses can be used as destinations such as SaaS Websites, VoIP Service Providers, Network devices, etc.
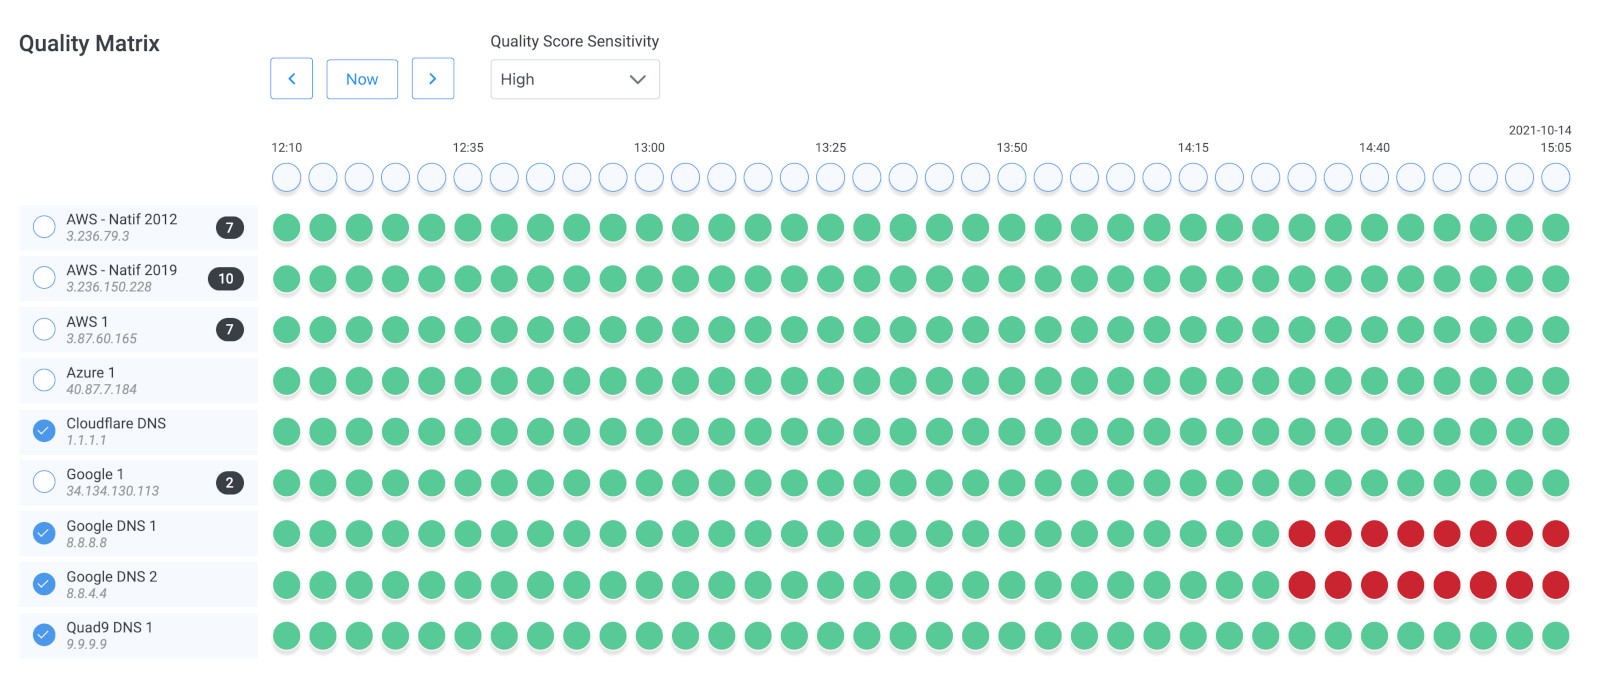
Get a visual representation of each network path to their destinations. Each router displays its own Quality Score to help pinpoint where network issues are located.
The network map (which can also be referred to as a Traceroute Map or Tracert Map) is a graphical representation or visualization of the results obtained from a "tracert" or "traceroute" command. It can help you visualize the geographic locations of the routers, the connections between them, and potentially identify patterns or issues in the network path.

Measure hop-by-hop core network metrics like packet loss, latency and jitter with wide time ranges (from 5 minutes to 3 hours).

Download Obkio Vision for Free or use it with Obkio's Complete Network Performance Monitoring Tool.
Leverage Obkio Vision to monitor, detect and troubleshoot network problems with visual traceroutes, IP route historic and graphical network maps.
Try for Free

Using the traceroute command involves opening a command prompt or terminal window on your operating system and entering the appropriate command. This is the traditional way of using Traceroute.
For an easier, more complete Traceroute solution, consider using a Traceroute tool, like Obkio Vision Visual Traceroute, which interprets traceroute results for you.
The steps to use traceroute are quite similar across different operating systems, but there might be slight variations in the command syntax.
So we'll be recovering how to use Windows Traceroute, macOS Traceroute & Linux Traceroute!
- On Windows: Press the
Win + Rkeys, type "cmd," and press Enter. - On macOS: Go to Applications > Utilities > Terminal.
- On Linux: Press
Ctrl + Alt + Tor search for "Terminal" in your applications.
- For a Windows Traceroute, use the
tracertcommand:
tracert [options] destination
- For a macOS Traceroute or Linux Traceroute, use the
traceroutecommand:
traceroute [options] destination
Replace "destination" with the IP address or domain name of the server or host you want to trace the route to. For example, to trace the route to Google's website, you can use:
traceroute www.google.com
You can customize the traceroute process by adding various options (flags) to the command. Some common options include:
traceroute -q: Specify the number of probe packets sent to each hop.traceroute -mortraceroute -h: Set the maximum number of hops or TTL value.traceroute -s: Specify the source IP address for the traceroute packets.traceroute -g: Specify intermediate gateways to follow a specific path
Press Enter to run the traceroute command. The tool will start sending packets to the destination and display the results for each hop along the route.
The traceroute output will show you a list of routers or hops along the path, along with their IP addresses, domain names (if available), and round-trip times. Analyze the information to understand the route and potential network issues.
Pay attention to "Request timed out" messages, high round-trip times, and patterns in the route. You can use this information to diagnose connectivity issues and troubleshoot network problems.
Traceroutes are an advanced tool, but here is a brief explanation of how traceroutes work.
Traceroutes work by sending out a series of packets with increasing Time To Live (TTL) values, which essentially act as a countdown timer for how long a packet can stay in the network before it's discarded. As each packet reaches a network node, it's discarded and the node sends an ICMP "time exceeded" message back to the sender, indicating that the packet has reached its TTL limit.
In the IP Header, there is an 8-bit field called Time-to-live (TTL) that goes from 0 to 255. The value of the TTL is decremented by 1 each time a packet is routed by a router. When the TTL value is 0, the packet is discarded and an ICMP TTL Exceeded message might be sent back to the source of the packet.
The main objective of the TTL field is not to trace a route but to discard packets if there is a routing loop in a network. So if there is a loop, since each router decrements the TTL value, at one point, it goes to 0 and gets discarded.
So the traceroute software uses the TTL to discover the routers between a source and a destination.
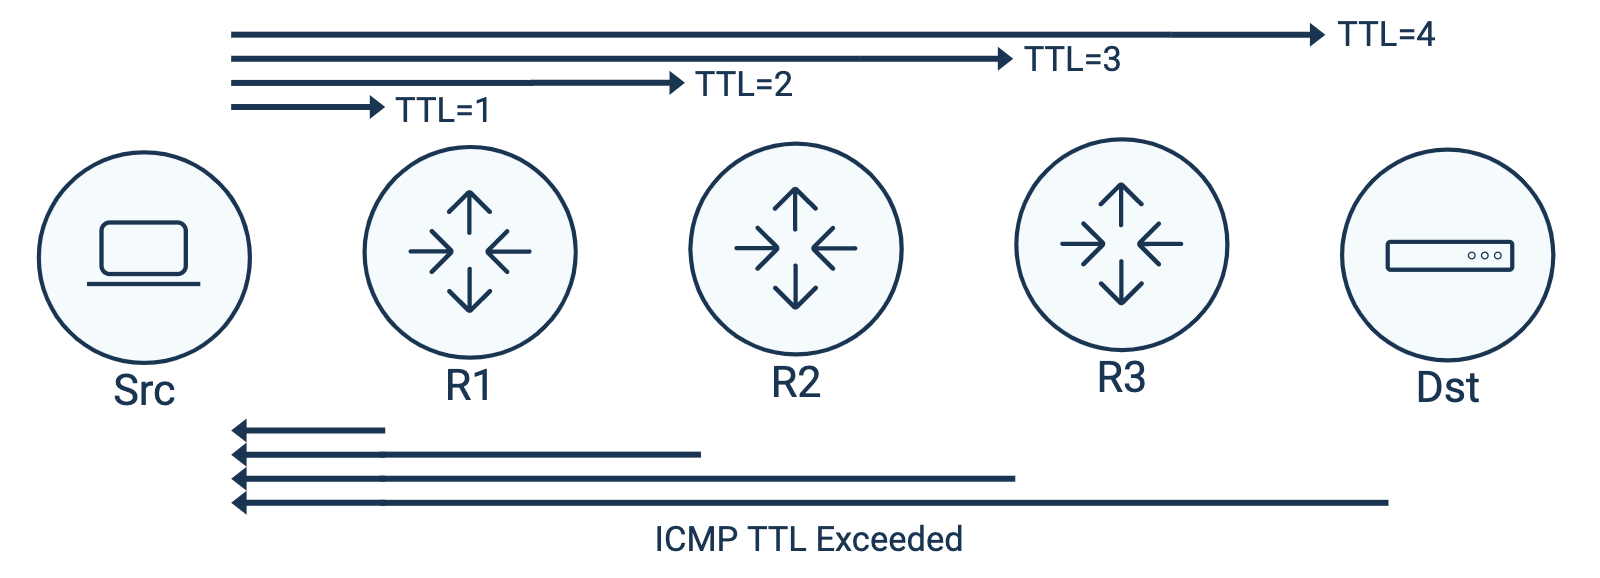
By receiving and analyzing these messages from each node, a traceroute can map out the path that the data takes to reach its destination. This information can be invaluable for diagnosing network issues, such as identifying where packet loss or latency may be occurring.
You can follow along with the picture above to get a better understanding.
- Firstly, the Source (Src) sends a packet with TTL=1.
- The Router decrements the TTL by 1, which changes the value to 0. The packet is dropped and the router sends an ICMP TTL Exceeded message. The destination IP address for the ICMP message equals the source IP address of the discarded packet. The source IP address of the discarded packet is the IP address of the interface on which the packet was received.
- The Source receives the "ICMP TTL Exceeded" message and adds the router IP to the Traceroute hops table.
- Then the process starts over again with TTL=2.
- The packet is routed through the first Router (R1), which also decrements the packet value.
- The second Router (R2) receives the packet, decrements the TTL, discards the packet and sends the "ICMP TTL Exceeded" message.
- And it continues like this by incrementing the TTL by 1 until it reaches its destination.
The latency measured for each router in the trace is the time difference between when the message is sent and when the TTL exceeded message is received.
It's important to note that there is no obligation for the router to send that ICMP TTL Exceeded message. So if a router never sends the message, it will not be discovered in the traceroute, but since it is still decrementing the TTL value, it will count as an unknown hop in the trace. Here is an example with hop #3 not sending ICMP TTL Exceeded packets:
+---+-------------------+-------+-----+------+------+------+------+
| # | Hostname          | Loss% | Snt | Last |  Avg | Best | Wrst |
+---+-------------------+-------+-----+------+------+------+------+
| 1 | 192.168.1.1       |   0.0 |  20 |  4.3 |  1.5 |  0.4 |  4.3 |
| 2 | router1.ispA.com  |   0.0 |  20 |  6.8 | 15.4 |  6.8 | 35.9 |
| 3 | ???               | 100.0 |  20 |    - |    - |    - |    - |
| 4 | router3.ispC.com  |   0.0 |  20 | 11.3 | 13.8 |  9.0 | 38.4 |
| 5 | website.com       |   0.0 |  20 | 12.8 | 16.1 | 10.4 | 38.4 |
+---+-------------------+-------+-----+------+------+------+------+
When looking at a traceroute, there are usually two important values for each hop or router: latency and packet loss..
Let’s take a look at this traceroute from the Obkio Live Traceroute feature:
+---+-------------------+-------+-----+------+------+------+------+
| # | Hostname          | Loss% | Snt | Last |  Avg | Best | Wrst |
+---+-------------------+-------+-----+------+------+------+------+
| 1 | 192.168.1.1       |   0.0 |  10 |  1.0 |  1.6 |  0.5 |  3.9 |
| 2 | router1.ispA.com  |  10.0 |  10 |  5.0 |  5.6 |  4.5 |  7.9 |
| 3 | router2.ispB.com  |   0.0 |  10 | 10.0 | 10.6 |  9.5 | 15.9 |
| 4 | router3.ispC.com  |   0.0 |  10 | 12.0 | 12.6 | 11.5 | 22.9 |
| 5 | router4.ispC.com  |   0.0 |  10 | 13.0 | 13.6 | 12.5 | 23.9 |
| 6 | router5.ispC.com  |   0.0 |  10 | 14.0 | 14.6 | 13.5 | 21.9 |
| 7 | router6.ispC.com  |   0.0 |  10 | 15.0 | 15.6 | 14.5 | 29.9 |
| 8 | website.com       |   0.0 |  10 | 16.0 | 16.6 | 15.5 | 39.9 |
+---+-------------------+-------+-----+------+------+------+------+
Figure A
- Latency is the round-trip latency calculated by the source. It refers to the time it takes from when a packet was sent to when a response was received. In the table above, we have 10 latency values because 10 packets have been sent (column Snt). The last packet latency is Last, the average latency is Avg, the best and worst are the two last columns.
- Packet Loss simply refers to the percentage of sent packets which never received a response out of the total number of sent packets. In this example, packet loss of 10% at hop 2 is quite significant. However, the first thing to look at is the number of packets that have been sent (Snt column).
In this case, we lost 1 packet out of the 10 that were sent, resulting in a packet loss rate of 10%. So 10% packet loss is a lot but out of 10 packets, it’s not very significant. Out of 1,000 or 10,000 packets, it would be another story. Traceroute tools often have a configuration option to change the number of packets that are sent and the interval at which they are sent.
The rule of thumb when looking at a traceroute is very simple:
If the packet loss doesn't continue, don’t panic, it’s not an issue!
+---+-------------------+-------+-----+------+------+------+------+
| # | Hostname          | Loss% | Snt | Last |  Avg | Best | Wrst |
+---+-------------------+-------+-----+------+------+------+------+
| 1 | 192.168.1.1       |   0.0 |  10 |  1.0 |  1.6 |  0.5 |  3.9 |
| 2 | router1.ispA.com  |  50.0 |  10 |  5.0 |  5.6 |  4.5 |  7.9 |
| 3 | router2.ispB.com  |   0.0 |  10 | 10.0 | 10.6 |  9.5 | 15.9 |
| 4 | router3.ispC.com  |   0.0 |  10 | 12.0 | 12.6 | 11.5 | 22.9 |
| 5 | router4.ispC.com  |   0.0 |  10 | 13.0 | 13.6 | 12.5 | 23.9 |
| 6 | router5.ispC.com  |   0.0 |  10 | 14.0 | 14.6 | 13.5 | 21.9 |
| 7 | router6.ispC.com  |   0.0 |  10 | 15.0 | 15.6 | 14.5 | 29.9 |
| 8 | website.com       |   0.0 |  10 | 16.0 | 16.6 | 15.5 | 39.9 |
+---+-------------------+-------+-----+------+------+------+------+
Figure B
In Figure B: 50% packet loss over a connection is terrible and makes it almost unusable. So are there any issues with this new traceroute example? Let’s apply the rule of thumb and figure it out.
- Does the 50% packet loss continue in the traceroute?
- Does every hop report that same 50% that we see with hop #2?
The answer is no, otherwise we would see packet loss with hops #3 through #8.
Should we panic and call our ISP to tell them we have packet loss on the path? No! Does it mean there is an issue with that router? No! It only tells us that hop #2 is responding to 50% of the packet or that 50% of the “ICMP TTL Exceeded” message returns to the source.
A deep dive on why we have packet loss with that hop is covered in Why Do Some Routers Drop Packets or Have High Latencies?.
Find out why single routers can drop traceroute packets or have higher latencies and why that’s normal.
Learn more

Looking at the example above, is the latency good? Is it normal? With only this traceroute and no more information, we don’t know.
The Internet latency between two hops can be affected by a number of things such as:
- the distance between them
- the medium connecting them (fiber optic, coax cable, copper lines, wireless, etc.)
- the technology used (cable Docsis, DSL, GPON, dedicated fiber, etc.)
- the configuration on the routers such as traffic shaping
- the network condition such as congestion
So to understand if the latency in a traceroute as good or bad, we need to know more information about the path. That information can come from our experience or knowledge of the path and routers, but the best one comes from historical traceroutes.
By comparing the latency over time, it’s much easier to know if the latency we are looking at is normal or not. Of course, a network performance monitoring solution such as Obkio has historical traceroute features that can help with that.
Here is another example similar to Figure B. We have the same path from the source to the destination but the packet loss and the latency values are different.
+---+-------------------+-------+-----+------+------+------+------+
| # | Hostname          | Loss% | Snt | Last |  Avg | Best | Wrst |
+---+-------------------+-------+-----+------+------+------+------+
| 1 | 192.168.1.1       |   0.0 |  10 |  1.0 |  1.6 |  0.5 |  3.9 |
| 2 | router1.ispA.com  |  50.0 |  10 | 50.0 | 55.6 | 33.5 | 77.9 |
| 3 | router2.ispB.com  |  50.0 |  10 | 52.0 | 54.6 |  9.5 | 56.9 |
| 4 | router3.ispC.com  |  50.0 |  10 | 54.0 | 53.6 | 32.5 | 66.9 |
| 5 | router4.ispC.com  |  50.0 |  10 | 55.0 | 55.6 | 44.5 | 72.9 |
| 6 | router5.ispC.com  |  50.0 |  10 | 53.0 | 52.6 | 21.5 | 58.9 |
| 7 | router6.ispC.com  |  50.0 |  10 | 52.0 | 56.6 | 29.5 | 99.9 |
| 8 | website.com       |  50.0 |  10 | 56.0 | 55.6 | 43.5 | 87.9 |
+---+-------------------+-------+-----+------+------+------+------+
Figure C
Does the packet loss continue after it started? Oh yes! In this case, we see 50% packet loss increase between hop #1 and hop #2 and it continues all the way to the last hop. So in this case, there are chances that there is indeed some packet loss between hop #1 and #2.
Be careful, Internet traffic is asymmetrical so the issue can be on the reverse path! This topic is covered in Internet Traffic is Asymmetrical - How to Catch Reverse Path Issues?.
So if there is packet loss with routers at ISP A, ISP B and ISP C, maybe we should call all of them and tell them they have 50% packet loss on their routers… or maybe post that on social media... or maybe not… We should focus on where the packet loss starts and where it is between hop #1 and hop #2.
Let’s take a look at the other network metric in this traceroute: latency.
By comparing Figure B and C, it’s clear that there is an increase in the latency values, and it all starts between hop #1 and #2, just like the packet loss. In this case, with an increase of packet loss and an increase of latency, it looks like network congestion.
Since Hop #1 (192.168.1.1) is the business’ firewall and Hop #2 (router1.ispA.com) is the ISP A router, the congestion is probably on the business Internet connection. By looking at the bandwidth usage on the firewall, the IT administrator of the business can easily validate if there is congestion. A solution such as Obkio’s Network Device Monitoring solution is able to get that info.
In the case where there is no congestion, a trouble ticket can be opened with ISP A to troubleshoot the network issues and the traceroute must be shared with them to accelerate the troubleshooting.
Traceroutes are a powerful tool for diagnosing network issues, and can help identify potential problem areas along the path of data packets. Above, we explained how traceroutes work, how to run traceroutes, and how to interpet traceroute results. You can now use all the information you received to troubleshoot network issues.
P.S. We talk more in detail about troubleshooting with Obkio's free traceroute tool in our article on How to Troubleshoot Networks with Obkio Vision Visual Traceroute
Learn how to use Obkio Vision’s Visual Traceroute tool to troubleshoot network problems with traceroutes in your LAN, WAN, and everything in between.
Learn more

When troubleshooting network issues with traceroutes, there are a few key steps to follow:
- Identify the source of the issue: Use traceroutes to identify where along the path of data packets the issue is occurring. This can help you determine if the issue is with your local network, your ISP, or with the website or service you're trying to connect to.
- Work with your ISP: If you're experiencing issues with your ISP, traceroutes can help you pinpoint where the issue is occurring and work with your ISP to resolve it. By providing your ISP with the results of your traceroute, they can identify any issues on their network and work to fix them. Use other network diagnostic tools: While traceroutes are a valuable tool for troubleshooting network issues, they shouldn't be the only tool in your arsenal. Other network diagnostic tools, such as ping and pathping, can also provide valuable information on network performance and potential issues.
- Identify potential bottlenecks: When analyzing traceroute results, look for areas where data packets are taking longer to travel between network nodes. These areas may be potential bottlenecks, and may require further investigation to determine the cause of the latency.
By following these steps and using traceroutes in conjunction with other network diagnostic tools, like Obkio Network Performance Monitoring you can quickly and effectively troubleshoot network issues and improve network performance.
Earlier in this article, we also talked about Tracert, which is the command used in Windows operating systems (such as Windows 10, Windows 7, etc.) to perform the traceroute functionality. For those of you who do use Tracert over Traceroutes, let's dive into this with a little more detai.
The "tracert" command in networking is a network diagnostic tool used to trace the route that data packets take from a source computer to a destination computer or server over a network, such as the Internet. It provides information about the various intermediate devices (routers) that the data packets encounter on their journey and the time it takes for the packets to travel to each of these devices.
The "tracert" command is available in Windows operating systems and is used from the Command Prompt. To use the "tracert" command, you typically follow this syntax:
tracert [options] destination
Here, "destination" is either an IP address or a domain name. You can also include various options to customize the behavior of the command. When you run the "tracert" command, it sends a series of Internet Control Message Protocol (ICMP) packets with gradually increasing Time-to-Live (TTL) values. The TTL value determines the number of hops a packet can take before being discarded.
When you run a tracert command, the tool sends a series of ICMP (Internet Control Message Protocol) or UDP (User Datagram Protocol) packets with gradually increasing Time-to-Live (TTL) values.
The TTL value specifies the number of hops a packet can take before being discarded. As each packet reaches a router along the path, the router decrements the TTL value, and if the TTL reaches zero, the router sends an ICMP "Time Exceeded" message back to the sender.
The "tracert" command displays a list of routers along with their IP addresses, domain names (if available), and the round-trip time (RTT) for the packets. This information helps network administrators and users troubleshoot network connectivity issues, identify network congestion or slowdowns, and understand the path that data takes from source to destination.
Reading the output of a "tracert" command can provide valuable information about the route that data packets take from your computer to a destination server or host. Here's how to interpret the information displayed in a typical "tracert" output:
- Hop Number: Each line of the output represents a "hop" along the route that the packets take. The hop number is usually displayed on the left side of the output. It indicates the sequence of routers or intermediate devices that the packets pass through to reach the destination.
- IP Address or Hostname: The IP address or hostname of the router or intermediate device for each hop is displayed in the output. This information helps you identify the specific devices along the path.
- Round-Trip Time (RTT): The time it takes for a packet to travel from your computer to each hop and back is displayed in milliseconds (ms). This RTT value provides an indication of the latency or delay between your computer and each hop. Generally, higher RTT values might indicate congestion or slower network connections.
- Host Unreachable or Time Exceeded: If a hop displays "Request timed out" or "Destination host unreachable," it means that the corresponding router did not respond to the ICMP packet within a certain time frame. This could be due to network congestion, router misconfiguration, or firewall settings.
- DNS Resolving: Some "tracert" outputs might display domain names alongside IP addresses if the hostnames are resolved from the IP addresses. This can help you identify the actual names of routers or intermediate devices.
- Final Destination: The last hop in the output should ideally be the destination server or host that you entered in the "tracert" command. If the final hop displays the destination's IP address or hostname, it indicates that the packets successfully reached the intended destination.
- Network Path Analysis: By analyzing the sequence of hops, you can identify the path that data takes to reach the destination. Network path monitoring can be useful for diagnosing network issues, understanding potential bottlenecks, and pinpointing the location of any connectivity problems.
Keep in mind that the results of a "tracert" command can vary based on network conditions, routing changes, and network configurations. Some routers or networks might also block ICMP traffic, which could result in "Request timed out" messages.
Overall, reading a "tracert" output involves interpreting the hop numbers, IP addresses or hostnames, RTT values, and any error messages to gain insights into the route and potential network issues between your computer and the destination.
Now let's take all that we learned and analyze a Tracert example!
Command:
tracert www.google.com
Output:
Tracing route to www.google.com [172.217.1.100]
over a maximum of 30 hops:

+---+-------+-------+-------+----------------+
| 1 | <1 ms | <1 ms | <1 ms | 192.168.1.1    |
| 2 | 5 ms  | 4 ms  | 4 ms  | 10.0.0.1       |
| 3 | 6 ms  | 7 ms  | 7 ms  | 203.45.147.89  |
| 4 | 11 ms | 9 ms  | 9 ms  | 203.45.147.49  |
| 5 | 15 ms | 14 ms | 14 ms | 72.14.212.167  |
| 6 | 22 ms | 21 ms | 21 ms | 108.170.248.145|
| 7 | 23 ms | 22 ms | 22 ms | 216.239.42.129 |
| 8 | 26 ms | 25 ms | 25 ms | 216.239.56.108 |
| 9 | 28 ms | 27 ms | 28 ms | 172.217.1.100  |
+---+-------+-------+-------+----------------+
Trace complete.
In this example, the "tracert" command is used to trace the route to the website "www.google.com." Here's how to interpret the output:
- The destination IP address is displayed:
www.google.com [172.217.1.100]. - The output shows each hop's number, round-trip time (RTT) in milliseconds, and IP address.
- The first hop (your local network gateway) has an IP address of
192.168.1.1. - Subsequent hops represent routers along the path to the destination.
- The "Request timed out" or
<1 msindicates whether the router responded or not. - The last hop's IP address
172.217.1.100is associated with Google's server. - The "Trace complete" message indicates that the tracing is finished.
This example gives you a glimpse into the route that data packets take from your computer to the Google server. The round-trip times provide an indication of the latency experienced at each hop. Remember that the actual output can vary depending on network conditions and routing configurations.
Beyond its basic usage, traceroute commands offer a range of options to tailor the tracing process to specific needs. This section delves into some key variations of the traceroute command: Traceroute -s, Traceroute -q, Traceroute -g, and Traceroute -m. Each option empowers users to refine their network analysis, gaining a deeper understanding of network routes, response times, and connectivity challenges.
By exploring these traceroute variants, you'll gain a comprehensive toolkit for uncovering the intricacies of network communication and troubleshooting effectively.
Let's explore each variation in more detail:
The "Traceroute -s" option is used to specify the source IP address when sending packets during the traceroute process. The source IP address is the IP address of the computer from which you are running the traceroute command.
When you use the "-s" option, you provide the source IP address that you want to appear as the origin of the traceroute packets. This can be useful in scenarios where you have multiple network interfaces or IP addresses on your computer and you want to explicitly specify which one to use for the traceroute.
Here's the general syntax for using the "-s" option with the traceroute command:
traceroute -s <second_ip_address> www.example.com
For example, let's say you have two network interfaces on your computer, each with its own IP address. You want to perform a traceroute from the second IP address. You would use the following command:
traceroute -s <second_ip_address> www.example.com
By using the "traceroute -s" option, you can control which IP address is used as the source for the traceroute packets, which can be helpful in various network troubleshooting scenarios. Keep in mind that the availability of this option and its behavior might vary depending on the specific implementation of the traceroute command in your operating system.
The "traceroute -q" option is used to specify the number of probes or query packets sent to each hop along the route. Each hop represents a router or intermediate device that the packets traverse on their way from the source to the destination.
The "traceroute -q" option allows you to customize the number of probe packets sent to each hop. The default behavior of traceroute is to send three probe packets to each hop by default. By using the "traceroute -q" option, you can increase or decrease the number of probe packets to be sent.
Here's the general syntax for using the "traceroute -q" option with the traceroute command:
traceroute -q <num_probes> <destination>
For example, if you want to send five probe packets to each hop, you would use the following command:
traceroute -q 5 www.example.com
Increasing the number of probe packets might provide a more accurate picture of network latency and round-trip times for each hop. However, keep in mind that sending more probe packets might also increase the time it takes to complete the traceroute, especially if some hops are slow to respond.
The availability and behavior of the "traceroute -q" option can vary depending on the specific implementation of the traceroute command in your operating system. It's a useful option for fine-tuning the traceroute process and obtaining more detailed information about the network path between your computer and the destination.
The "traceroute -g" option in the traceroute command allows you to specify loose source routing.
With the "traceroute -g" option, you can specify a list of intermediate gateway hosts through which the traceroute packets should pass. This allows you to investigate the path that packets take through specific routers or gateways. The specified gateways are considered "loose" because the actual routing may still involve other intermediate routers not explicitly specified in the list.
Here's an example of how the "traceroute -g" option might be used in a traceroute command:
traceroute -g gateway1 gateway2 destination_host
In this example, the traceroute packets would first be sent to "gateway1," then to "gateway2," and finally to the "destination_host," while the exact routing may involve other intermediate routers as well.
The "-m" option is used to specify the maximum number of hops or the maximum TTL (Time-to-Live) value that traceroute will use during the tracing process. The TTL value indicates the number of hops a packet can take before being discarded.
By using the "traceroute -m" option, you can limit the number of hops that the traceroute command will attempt to reach. This can be useful if you want to control the depth of the trace or if you suspect that a specific hop count is causing problems.
Here's the general syntax for using the "-m" option with the traceroute command:
traceroute -m <max_hops> <destination>
For example, if you want to limit the traceroute to a maximum of 15 hops, you would use the following command:
traceroute -m 15 www.example.com
Using the "traceroute -m" option allows you to tailor the traceroute to your needs, such as focusing on a specific portion of the route or avoiding very long traces that might take a significant amount of time to complete.
In conclusion, traceroutes are a powerful tool for diagnosing and troubleshooting network issues. By sending packets of data with increasing TTL values, traceroutes allow you to trace the path of data packets through a network, identifying potential problem areas, verifying routing, and measuring network performance.
Traceroutes are commonly used by network administrators and technicians to troubleshoot network issues, identify ISP issues, investigate cyberattacks, and test network performance. By following best practices for performing and interpreting traceroutes, and using them in conjunction with other network diagnostic tools, you can quickly and effectively diagnose and resolve network issues, improving network performance and ensuring that your network is operating at peak efficiency.
You can start using Traceroutes for yourself! Download Obkio Vision for Free or use it with Obkio's Complete Network Performance Monitoring Tool.
Leverage Obkio Vision to monitor, detect and troubleshoot network problems with visual traceroutes, IP route historic and graphical network maps.
Try for Free

This is the end of this first article on traceroutes. Now that you know how traceroutes work, the next articles will cover how to analyze traceroutes, how to read a traceroute, and which information is the most important.
We hope you enjoyed this article in the traceroute series.
- What is a Traceroute and How Do Traceroutes Work? (this article)
- How To Identify Network Issues with Traceroutes?
- Why Do Some Routers Drop Packets or Have High Latencies?
- Decode the Hidden Information from Traceroute DNS
- Internet Traffic is Asymmetrical - How to Catch Reverse Path Issues?
- How to Share a Traceroute With an ISP NOC?
- Impact of Load Balancing or Multiple Paths on Traceroutes
- MPLS Networks, TTL Propagation and ICMP Tunneling


 Obkio Blog


