Table of Contents
Table of Contents
In today's interconnected world, network performance is critical for businesses of all sizes. Whether you are a network administrator, a system engineer, or an IT professional, ensuring the smooth operation of your network is vital to maintaining productivity and delivering a seamless user experience. However, diagnosing and troubleshooting network issues can be a complex and time-consuming task. That's where Visual Traceroutes come into play.
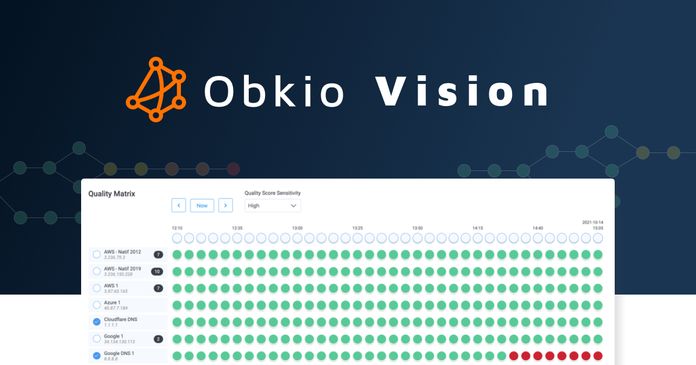
Obkio Vision Visual Traceroute is a cutting-edge network troubleshooting tool that provides network administrators with a powerful and intuitive way to identify and resolve network issues quickly. With its advanced visualizations and comprehensive data analysis, Obkio Vision takes the traditional traceroute concept to a whole new level, enabling users to gain deep insights into network performance and diagnose problems with ease.
In this blog post, we will explore the various features and benefits of a Visual Traceroute tool, and discuss how it can help you troubleshoot network issues effectively. Whether you are facing slow network speeds, intermittent connectivity problems, or other network-related challenges, Visual Traceroutes provide the visibility and tools you need to diagnose and resolve these issues promptly.
Whether you are an experienced network professional or a novice in the field, this blog post will provide you with practical insights and guidance on leveraging Visual Traceroutes to troubleshoot network issues effectively. So, let's dive into the world of Visual Traceroutes!
Before we dive it, let's briefly introduce the tool we'll be working with: Visual Traceroutes.
Visual traceroutes are graphical representations of network paths taken by data packets from a source to a destination. They offer a visual depiction of the routers or hops along the network path, along with their geographic locations and other relevant information.
A visual traceroute typically displays the network path on a map, allowing users to visualize the physical locations of the routers involved in transmitting data packets. Each hop is represented by a point on the map, and lines connect these points to illustrate the path taken by the packets. Additionally, visual traceroutes often include details such as IP addresses, response times, and the number of hops at each stage.
Visual traceroutes are invaluable tools for troubleshooting network connectivity problems. They provide a clear visualization of the entire path, which aids in identifying areas of packet loss, slow response times, or failed connections. This information helps network professionals to diagnose issues accurately and take appropriate steps to resolve them, improving network performance and minimizing downtime.
In the world of Networking, most IT pros and network admins are familiar with Traceroutes. Still today, the remain the most popular network troubleshooting tool out there. But since the days of traditional text-based traceroutes, there's been some changes.
By presenting network paths in a visual format, visual traceroutes offer several benefits over traditional text-based traceroutes. They enable network administrators, engineers, or even non-technical users to quickly understand the network topology and the flow of data. This visual representation simplifies the identification of network congestion (WAN or LAN congestion), latency issues, or any anomalies along the path.
- Enhanced Visualization: Visual traceroutes provide a clear and intuitive graphical representation of the network path (network visualization). This visual format allows users to quickly grasp the overall network topology and understand the relationships between different routers or hops. By visualizing the network path on a map, administrators can identify patterns, bottlenecks, or irregularities more easily compared to reading through lines of text.
- Simplified Analysis: The visual nature of traceroute tools simplifies the analysis of network paths. Instead of relying solely on numerical data and textual output, visual traceroutes present information in a visual format that is easier to interpret and understand. By seeing the network path at a glance, administrators can identify any abnormal routing, excessive hops, or unexpected detours that may be causing performance issues.
- Geographical Context: Visual traceroutes incorporate geographical information, such as the physical locations of routers or hops, into the visualization. This geographical context can be invaluable in troubleshooting network problems. Administrators can identify any regional or location-specific issues that might impact network performance, such as long-distance routing or congested regions. This information helps in targeting troubleshooting efforts and optimizing network paths accordingly.
- Rapid Troubleshooting: Visual traceroutes enable administrators to quickly identify problematic areas or routers causing performance issues. Instead of manually analyzing text-based outputs, they can visually inspect the network path and pinpoint potential bottlenecks or points of failure. The ability to visualize the path in real-time or historically provides a faster and more efficient troubleshooting process, allowing for timely resolution of network problems.
- Improved Collaboration: Visual traceroutes facilitate better collaboration among team members involved in network troubleshooting. The visual representation allows for easy information sharing and comprehension across technical and non-technical stakeholders. By providing a visual snapshot of the network path, visual traceroutes promote effective communication and enable team members to collaborate more effectively on identifying and resolving network issues.
So, as you've probably guessed, Visual Traceroutes are a troubleshooting tool. So how do you access this magnificent tool.
Enter, Obkio Vision Visual Traceroute tool, a modern and simplified version of traceroutes that interprets real data for you and identifies Internet and WAN problems more effectively.
While trafitional text-based Traceroutes show the IP addresses of the intermediate routers or hops along the path to identify network delays or failures, Obkio Vision Visual Traceroute tool takes it a step further.
Obkio Vision is Obkio’s free Visual Traceroute tool that runs continuously to interpret Traceroute results for you and help troubleshoot network problems (in your WAN and over the Internet) faster and easier than ever. It takes the concept of traceroutes a step further by presenting the traceroute results in a visual format, typically on a map or a graphical user interface (GUI).
Instead of just displaying textual information, a visual traceroute tool allows users to see the geographical locations of the routers or hops, as well as the latency or response times at each step of the network path.
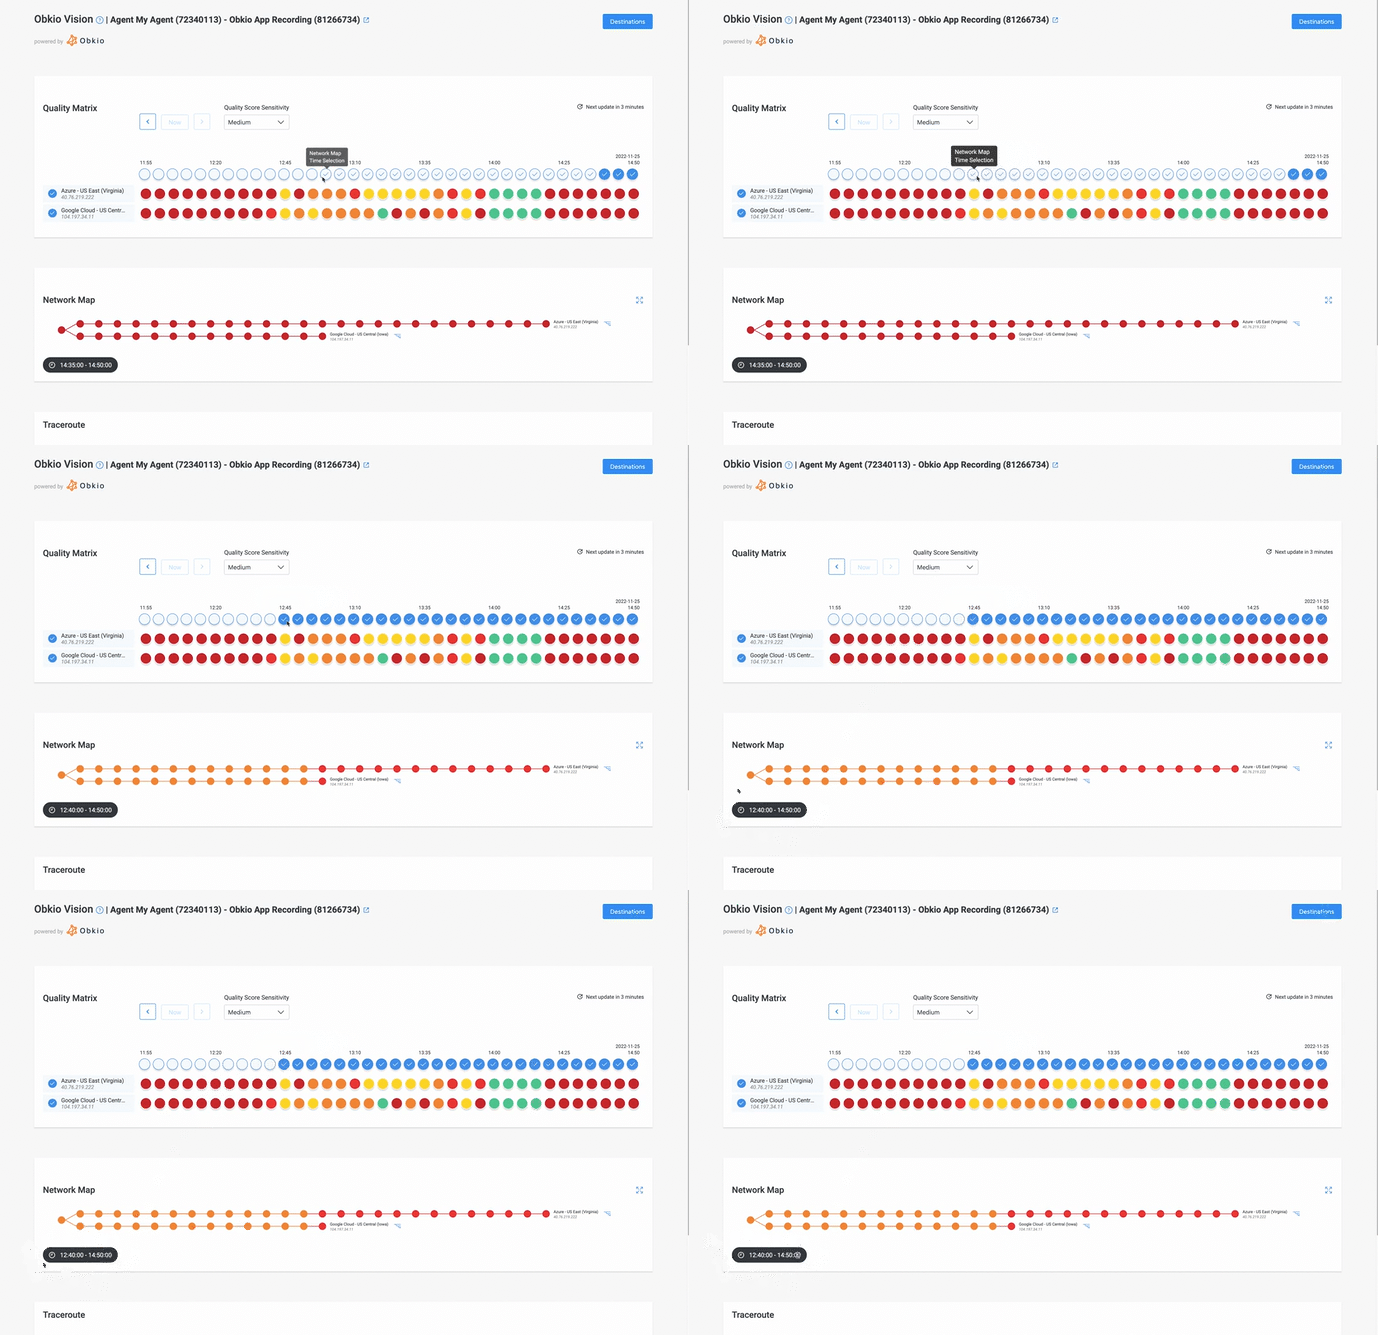
Visual traceroute tools, including Obio Vision, work by combining the functionality of traditional traceroute tools with graphical representations and mapping capabilities. Before we get into how to troubleshoot with Visual Traceroutes, here's a general overview of how visual traceroute tools work:
The deployment process here with all depend on the Visual Traceroute tool of your choice. Some Visual Traceroute tools are stand-alone, and some are integrated with more extensive Network Monitoring and Troubleshooting solutions. Obkio Vision offers both. Download and use Obkio Vision for free for Windows, macOS and Linux, or use Obkio Vision as a complementary feature with Obkio’s complete Network Monitoring & Troubleshooting SaaS solution.
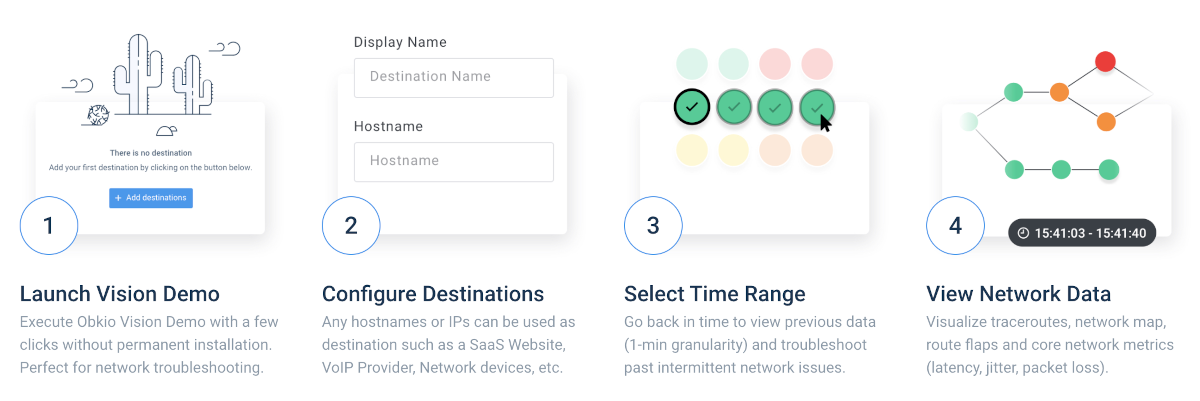

At this point, you need to tell your Visual Traceroute tool what part of your network it needs to monitor. The user provides the destination IP address or hostname that they want to trace the network path to. This is typically entered into the visual traceroute tool's user interface. Obkio's Visual Traceroutes also have a specific IP monitoring feature to do this.
The visual traceroute tool initiates the traceroute process by sending a series of ICMP (Internet Control Message Protocol) or UDP (User Datagram Protocol) packets with incrementing TTL (Time-to-Live) values. The TTL value determines the maximum number of hops a packet can traverse before being discarded.
As the packets travel through the network, each router or hop encountered along the path decrements the TTL value. When the TTL value reaches zero, the router discards the packet and sends an ICMP "Time Exceeded" message back to the source. The visual traceroute tool receives these responses for each hop.
The visual traceroute tool collects and processes the received responses, which include information such as the IP address of each hop, response times, and other relevant metadata. It uses this data to build a network path representation.
Using the collected data, the visual traceroute tool generates a visual representation of the network path. This representation can take the form of a map, where each hop is represented by a point or marker on the map. The connections between the markers indicate the sequence of hops traversed by the packets.
The visual traceroute tool displays the visual representation to the user, typically in its user interface. The map may include additional information, such as geographical locations, latency values, or other metrics associated with each hop. This visualization allows users to analyze the network path, identify patterns, and spot any anomalies or issues that may affect network performance.
Visual traceroute tools often provide interactive features to enhance the analysis process. Users may be able to zoom in and out of the map, click on individual hops for more detailed information, or access historical data to compare network paths over time. These features enable users to gain deeper insights and troubleshoot network issues effectively.
By combining the functionality of traditional traceroute tools with graphical representations, visual traceroute tools provide an intuitive and comprehensive way to understand network paths, analyze performance, and identify potential issues. They simplify the process of network troubleshooting and empower network administrators to optimize their networks for improved performance and reliability.
Learn about Obkio Vision, the new free visual traceroute tool with IP route history to quickly identify and troubleshoot network problems faster than ever.
Learn more

Network troubleshooting can be complex for large, modern networks, especially when troubleshooting intermittent network problems. In the world of network troubleshooting, having access to effective tools can make all the difference in quickly identifying and resolving network issues.
One such tool that stands out is Obkio Vision, a powerful visual traceroute solution. By providing a visual representation of network paths and performance metrics, Obkio Vision simplifies the troubleshooting process and empowers network administrators to optimize their networks for peak performance.
Let's get into you how easy it can be to troubleshoot using Visual Traceroutes.
Of course, to be able to troubleshoot using this advanced Visual Traceroute tool, you’ll need to deploy it. Luckily, we’ve made it easy for you! We touched on this in the last section, but here's a little more detail.
Download and use Obkio Vision for free network troubleshooting for Windows, macOS and Linux.
- The demo version is limited to 3 hours.
- The data is erased when the demo is closed.
- The demo web interface port is random and changes on every relaunch.

Additionally, it's worth noting that Obkio Vision can also be used as a complementary feature with Obkio's complete Network Monitoring & Troubleshooting SaaS (Software-as-a-Service) solution. This comprehensive solution offers a range of network monitoring and troubleshooting features beyond visual traceroutes, allowing you to gain even deeper visibility into your network infrastructure.
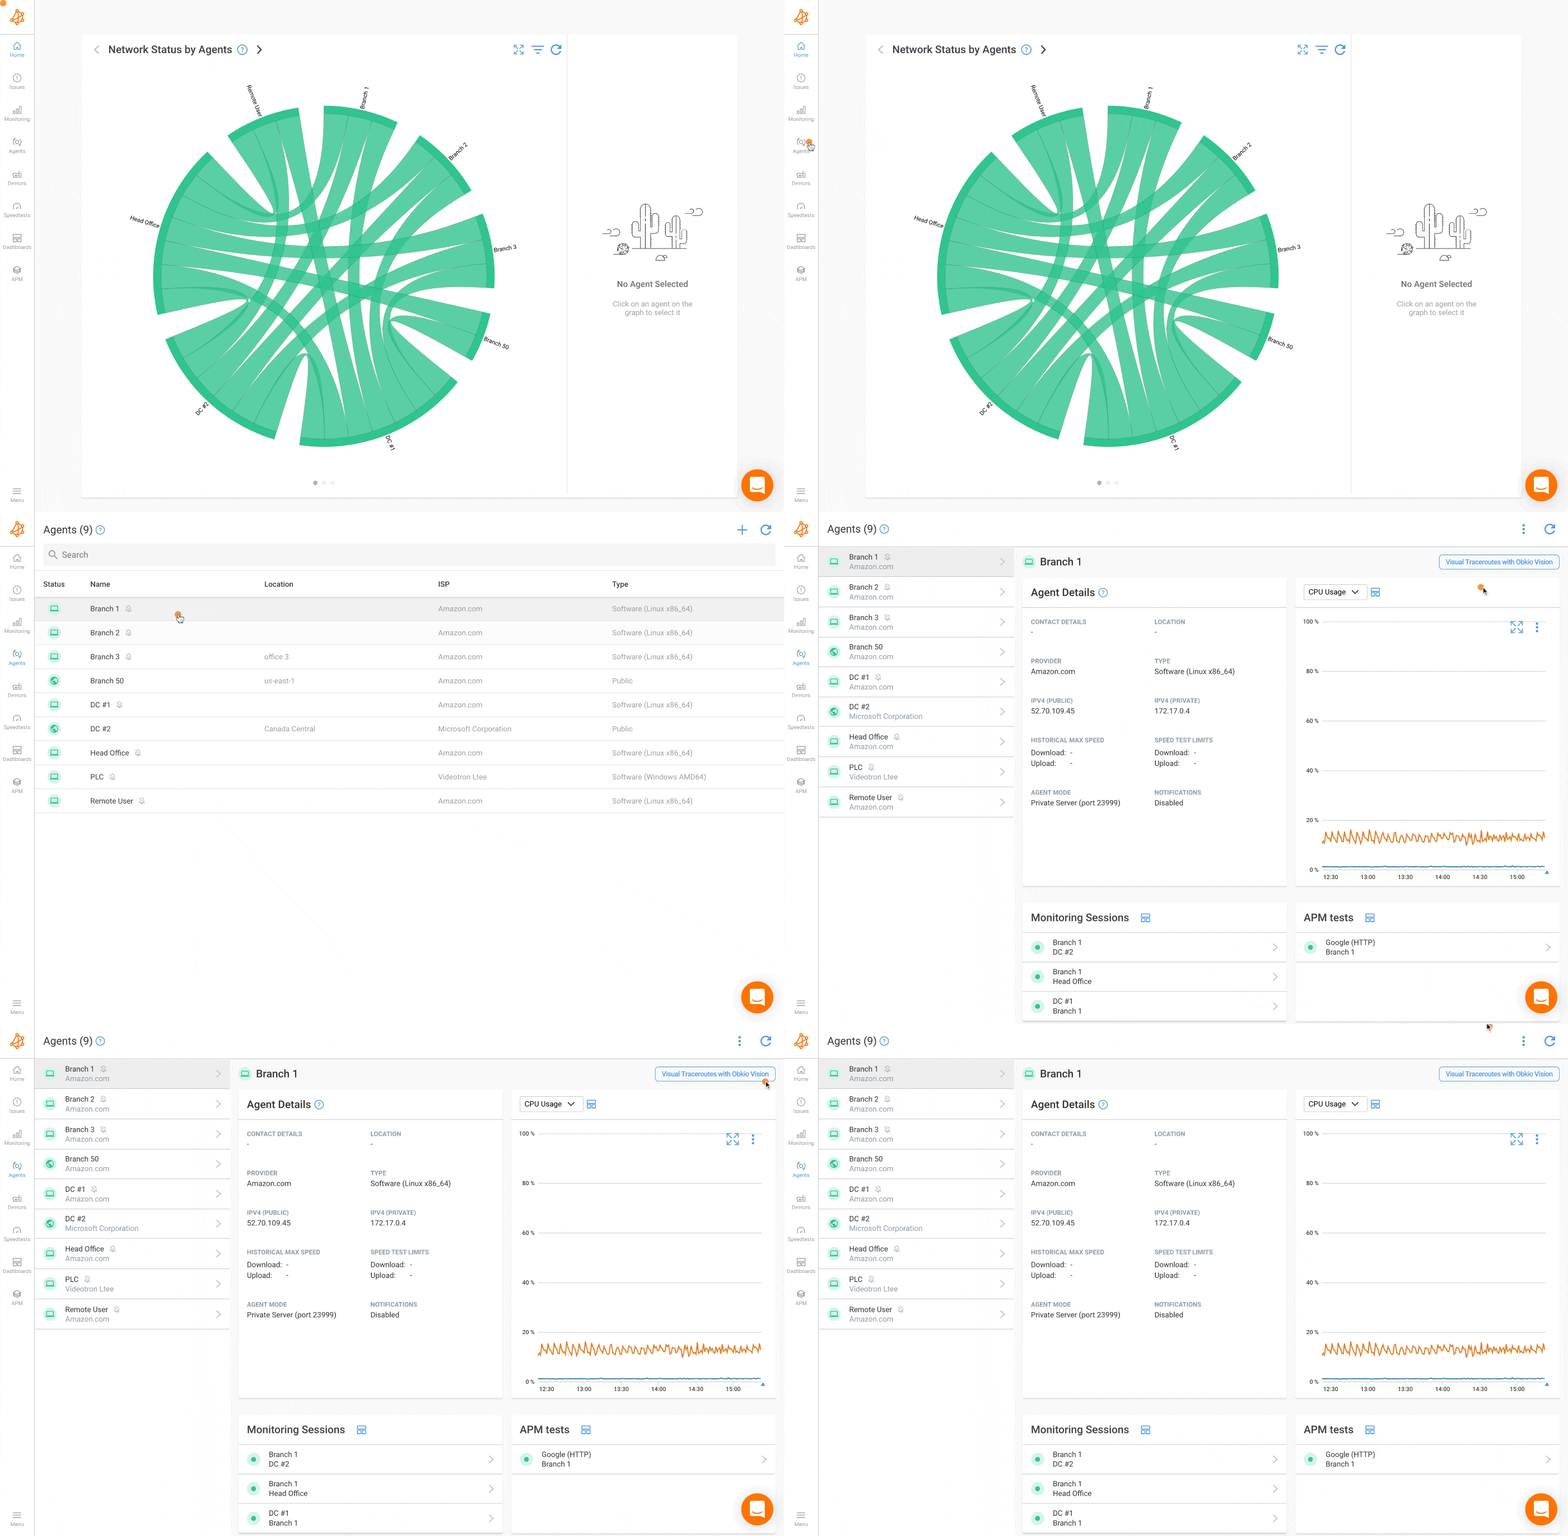
By integrating Obkio Vision with the SaaS solution, you can access a holistic suite of tools to monitor, analyze, and troubleshoot your network effectively.
- Use Obkio Vision for an unlimited amount of time
- Add extra Destination IPs
- Get access to 1-5 Monitoring Agents, depending on your Obkio Plan
- Use Visual Traceroutes along with Obkio's comprehensive Network Monitoring features
Start Obkio's Free Trial to get started with Obkio Vision Visual Traceroute Tool

Before you can troubleshoot your network using the Visual Traceroute Tool, you need to identify network problems that are causing disruptions or performance issues.
The best way to do that is by looking at key network metrics. By examining key network metrics, you can gain insights into the health and performance of your network infrastructure.
Obkio continuously monitors end-to-end network performance and network metrics with synthetic traffic using Network Monitoring Agents deployed in key network locations like Head Offices, Data Centers, Clouds, etc.
- The Agents exchange synthetic traffic to measure network metrics and network health
- They identify network issues, like network slowness, anywhere in your LAN, WAN or network devices
- And collect the information to help you troubleshoot network slowness internally or with your Service Provider
Therefore to start measuring network metrics, you'll need to deploy the following Monitoring Agents. When you start Obkio's Free Trial, the Onboarding Wizard will deploy them for you:
- Local Agents: Installed in the targeted office location experiencing network slowness issues. There are several Agent types available (all with the same features), and they can be installed on MacOS, Windows, Linux and more.
- Public Monitoring Agent: These are deployed over the Internet and managed by Obkio. They compare performance up to the Internet and quickly identify if the network slowness issue is global or specific to the destination. This will be great information for later in the troubleshooting process. You can use an AWS or Google Cloud Agent.
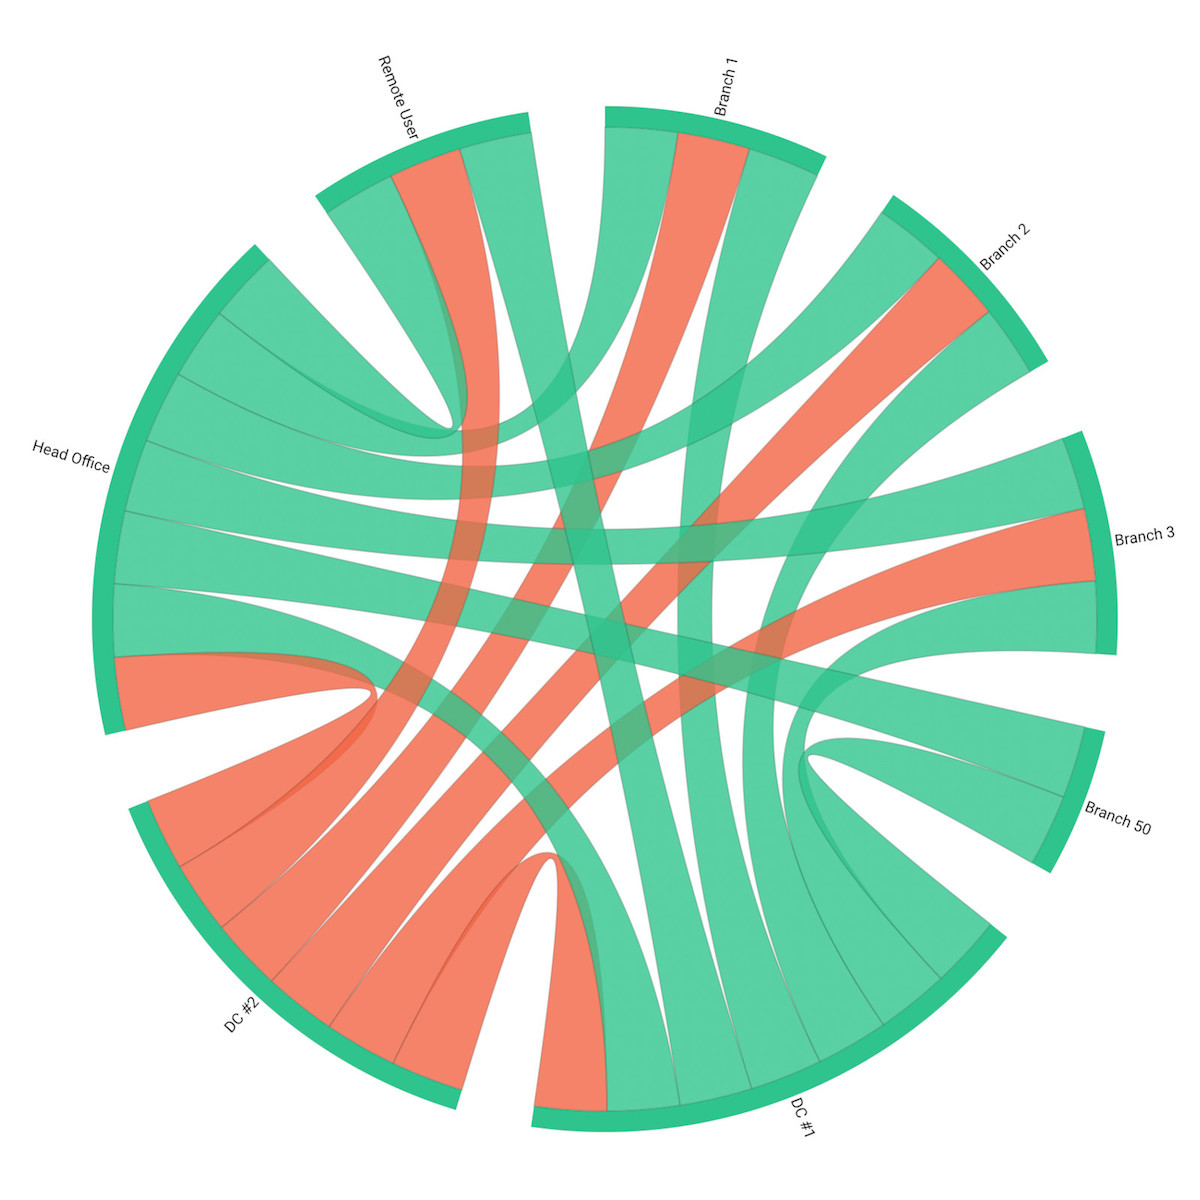
Once Obkio Network Monitoring is deployed, you can view all your network metrics on Obkio’s Network Response Time Graph. There are several important network metrics to consider when diagnosing network problems.
- Latency measures the time it takes for data packets to travel from the source to the destination. High latency can indicate potential bottlenecks or delays within the network.
- Packet loss refers to the percentage of data packets that do not reach their intended destination. Excessive packet loss can lead to poor network performance, degraded user experience, and disrupted communications.
- Network bandwidth is also a critical metric to consider. It represents the maximum amount of data that can be transmitted through the network within a given timeframe. Insufficient bandwidth can result in congestion, slow data transfer rates, and reduced overall network performance.
- Network Utilization measures the amount of network capacity being utilized at a given time. High network utilization can indicate potential congestion or overloading of network resources.
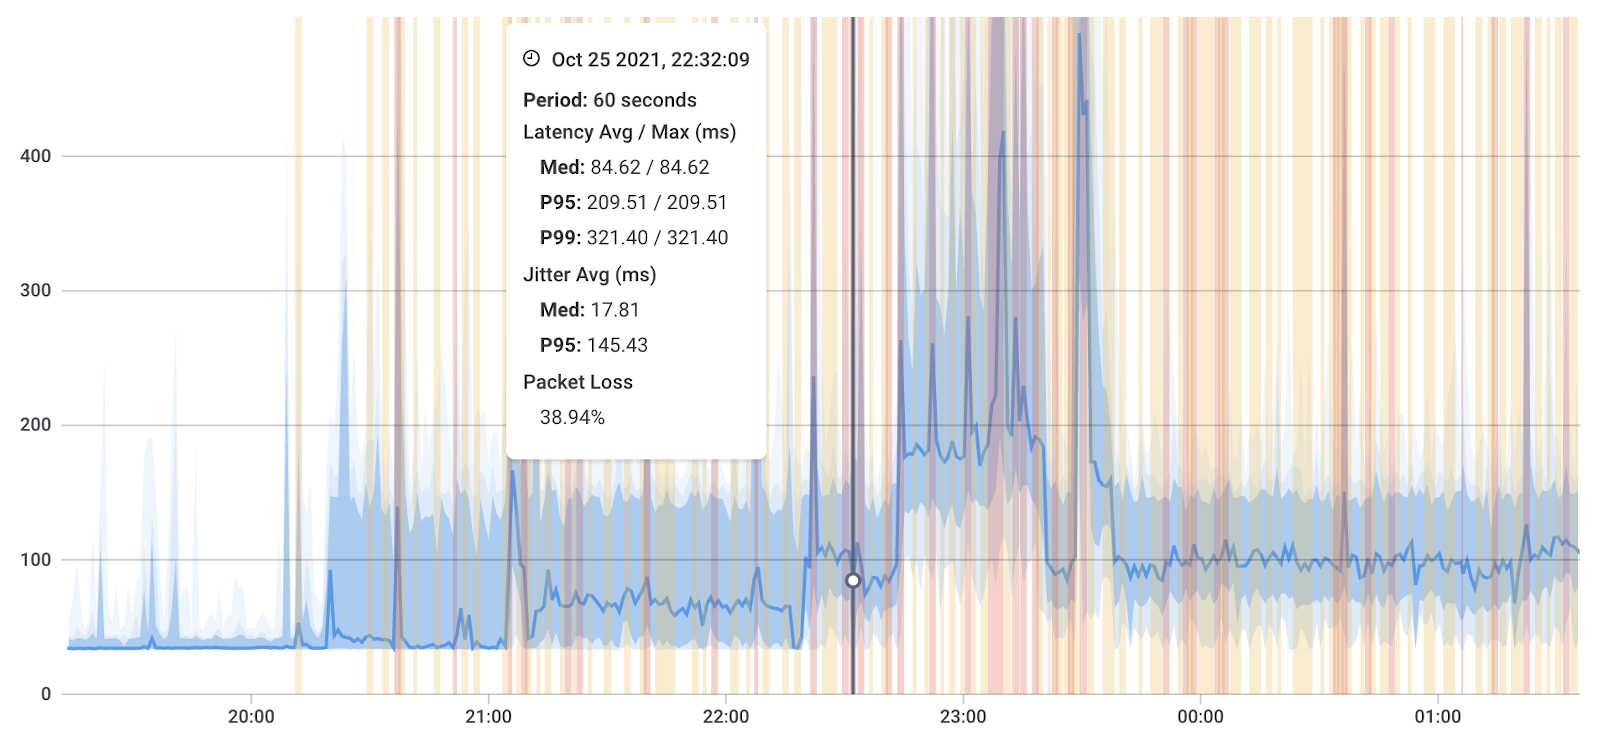
Analyze the metric measurements during a specific timeframe in your network to identify when a network problem began. The moment when your network performance has begun deviating from your baseline performance is a great starting point for identifying a problem.
Maybe you can see a clear pattern of packet loss during a specific period of time, or maybe you see intermittent jitter at seemingly random intervals. Either way, this is the time frame you should look into.
By examining these key network metrics, you can identify anomalies, trends, or patterns that may be contributing to network performance issues. Once you have identified potential problem areas, you can then utilize the Visual Traceroute Tool provided by Obkio to gain a deeper understanding of the network path, visualize the hops, and analyze the performance metrics at each step.
Once you have identified a specific time frame during which your network performance has changed or issues have been reported, it is essential to analyze that timeframe using the Obkio Vision Visual Traceroute tool. This tool provides a visual representation of your network paths and performance metrics, allowing you to gain deeper insights into potential issues.
To effectively analyze the chosen time frame, it is recommended to examine the network performance before, during, and after the identified period. By doing so, you can obtain a comprehensive and comparative view of your network's behavior, enabling you to determine whether there have been any significant changes.
- First, draw the Network Map for the 3 time periods.
- Then look at the Traceroutes for the 3 time periods.
This will give you a more visual picture of whether something has actually changed in your network.

- Before: Analyzing the network performance before the identified time frame helps establish a baseline or reference point for normal network behavior. By comparing the performance during the problematic period to the pre-existing network baseline, you can identify any deviations or anomalies that may have contributed to the network issues.
- During: During the identified time frame, closely examine the network performance. Observe the visual traceroute results, latency values, packet loss, and other relevant metrics provided by Obkio Vision. Look for any sudden changes, patterns, or irregularities that may indicate network congestion, bottlenecks, or other performance issues.
- After: Once the problematic period has passed, continue to analyze the network performance after the identified time frame. This analysis allows you to assess whether the network has returned to normal or if any lingering issues persist. Comparing the post-period performance to both the baseline and the during-period performance can provide further insights into the effectiveness of any troubleshooting measures undertaken.
By conducting a thorough analysis of the network performance before, during, and after the identified time frame using the Obkio Vision Visual Traceroute tool, you can obtain a comprehensive visual picture of your network's behavior. This approach enables you to better understand whether significant changes have occurred within your network, helping you to pinpoint the root causes of any performance issues and take appropriate actions to rectify them.
After analyzing the network performance before, during, and after the identified time frame using the Obkio Vision Visual Traceroute tool, the next step is to focus on finding out where the network issue was introduced. This can be done by analyzing the Network Maps and Traceroutes and Traceroutes provided by Obkio Vision.
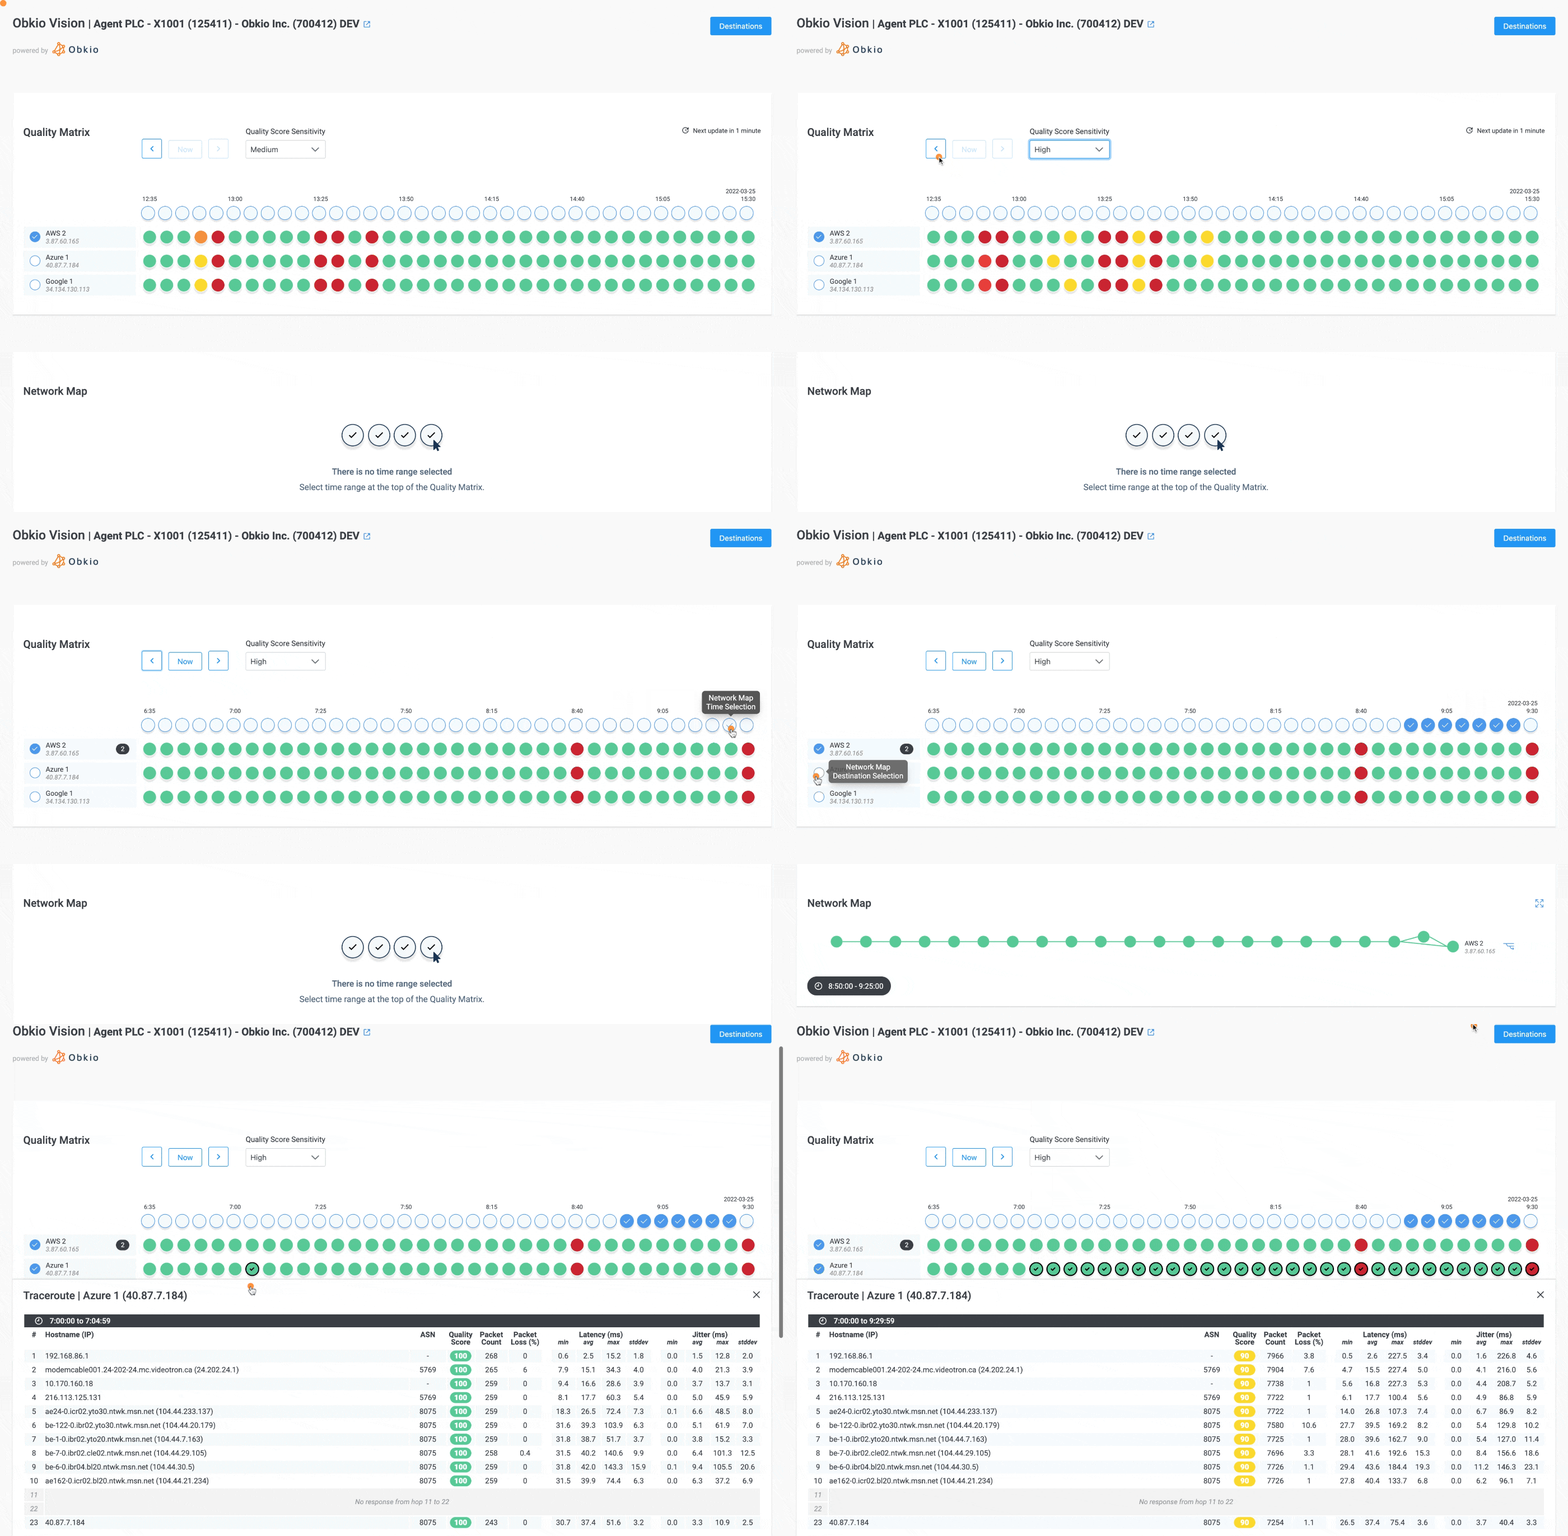

Start by examining the Network Maps. These maps provide a visual representation of your network infrastructure, illustrating the various components and their connections. By studying the Network Maps, you can identify different segments of your network and pinpoint where the issue might have originated.
Next, analyze the Traceroutes provided by Obkio Vision. Traceroutes show the network path taken by data packets from the source to the destination. By closely examining the Traceroutes, you can identify specific routers, hops, or networks along the path that may be causing the network issue.
To isolate the issue, it's important to continue analyzing the data before, during, and after the identified time frame. This broader analysis allows you to compare and contrast network behavior and identify any changes or abnormalities that occurred specifically within the problematic period.
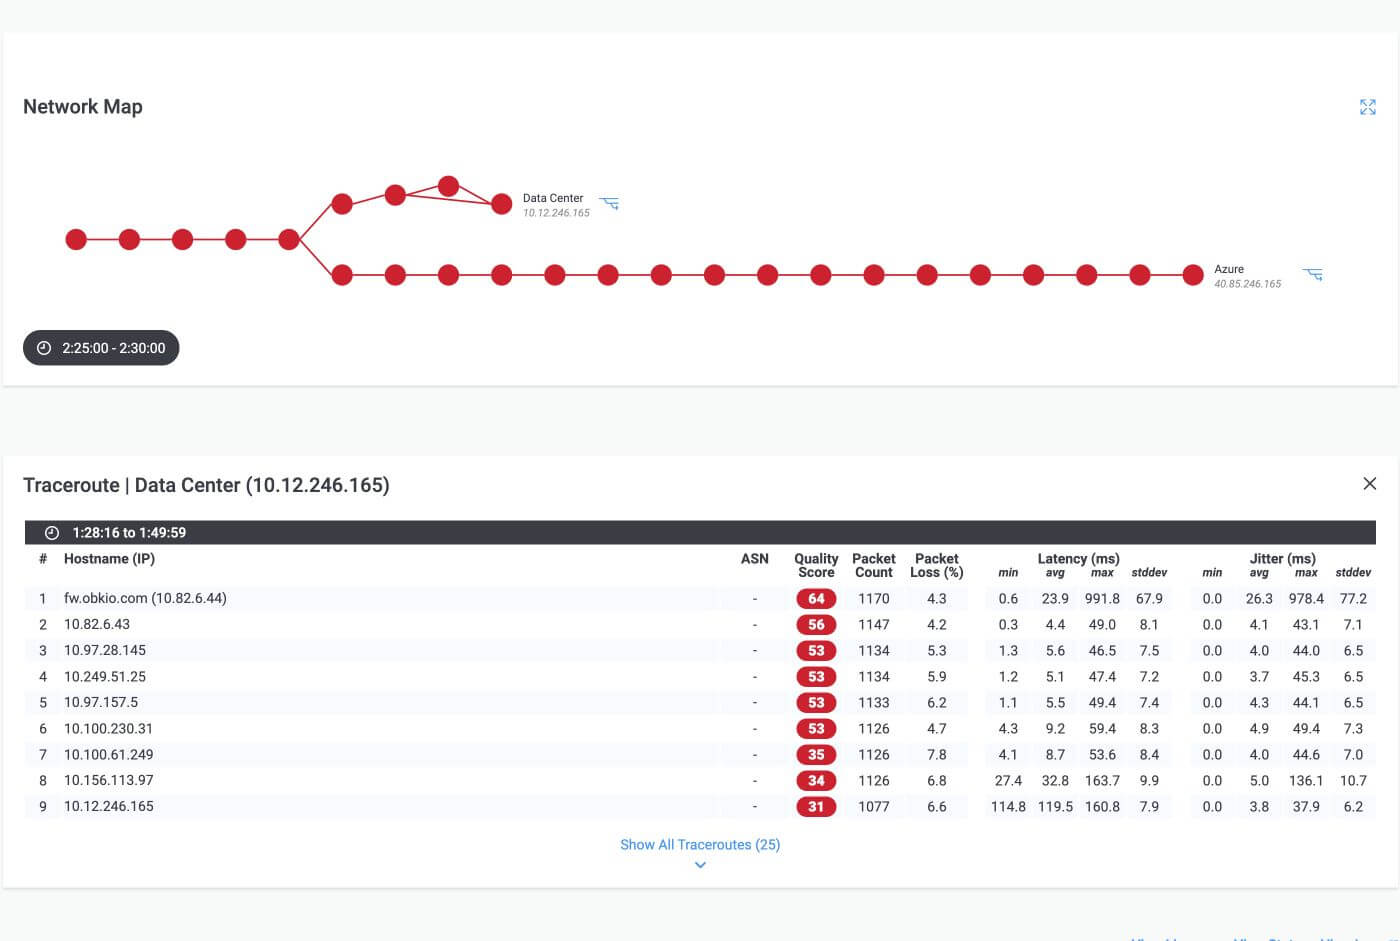
 This screenshot shows a Traceroute identifying WAN issues within the ISP network.
During the analysis, you may encounter various scenarios where the network issue could be located. Here are some examples:
- LAN: The issue may be within your local network infrastructure, such as network switches, routers, or connected devices.
- Between the LAN and Your ISP's Network: The issue could arise at the boundary between your local network and your Internet Service Provider's (ISP) network, typically involving the firewall or router connecting the two.
- Your ISP Network: The issue might be within your ISP's network infrastructure, which encompasses their routers, switches, or other network components.
- Between Your ISP Network and other Networks: The issue may arise when your traffic passes through various networks, such as peering or transit networks, on its way to the destination.
- Transit Network: The issue could be within one of the intermediary ISP networks that your traffic traverses before reaching the destination.
- Between the Transit Network and the Destination Network: The issue might occur at the boundary between the transit network and the network of the intended destination.
- The Actual Network of your destination: The issue may lie within the network infrastructure of the destination itself.
By carefully analyzing the Network Maps, Traceroutes, and conducting a thorough examination of the network behavior, you can narrow down the potential location of the network issue. This information will help you focus your troubleshooting efforts and collaborate with the relevant teams or service providers to resolve the problem efficiently.
When you’re analyzing your data to troubleshoot with traceroutes, here are some things to consider:
- ASN identifies where the hop has reached (in whose network). Googling the ASN ID will provide you with the name of the company (who’s network it is).
- Route Changes indicate if the path used to reach the destination in the network has changed during a certain moment. There can be multiple route changes happening within a few seconds.
- Switching from Private to Public IPs will tell you when you move out of your LAN to the WAN and enter into your ISP network.
At this point, you’ll either have identified your network issue, or you may need to dive deeper. If you’re ready to start troubleshooting, go to the next step.
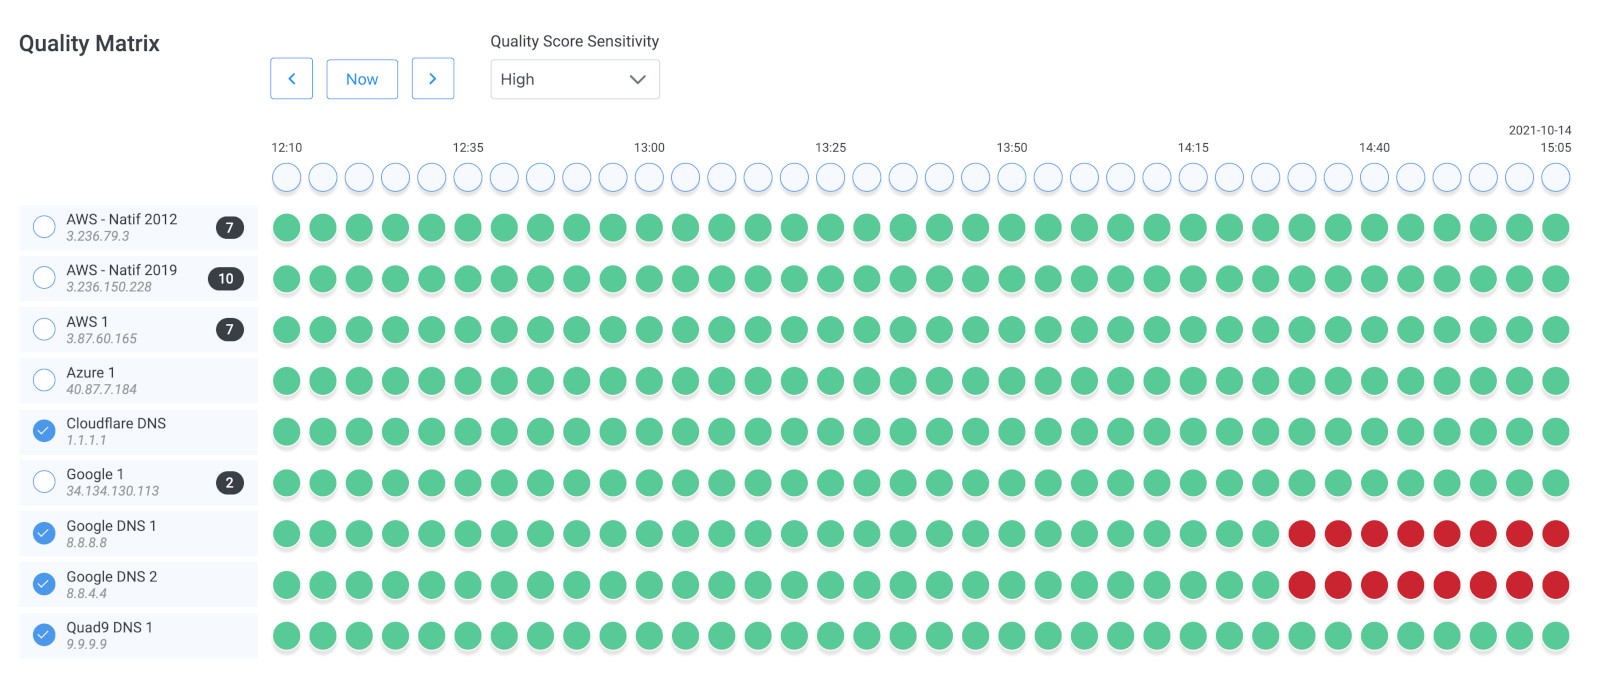
Maybe you haven’t been able to locate where exactly the network issue is coming from, or maybe you’ve isolated the problem to a specific network segment but you don’t know exactly what’s going on.
At this point, you need to add data to continue troubleshooting!
- Add Additional Network Destinations: If you haven't been able to locate the exact source of the network issue, consider adding additional Network Destinations in Obkio Vision. By monitoring additional destinations, you can gather more comprehensive data and compare the network performance across multiple endpoints. This expanded data set can help you identify patterns or commonalities that may lead to the discovery of the underlying problem.
- Add or Move Obkio Network Monitoring Agents: To gain a better understanding of specific network segments, you can strategically add or relocate Obkio Network Monitoring Agents within your network infrastructure. By placing agents in different segments, you can collect targeted data and analyze the performance within those areas. This can help in isolating the problem and determining if it is specific to a particular network segment.
- Add Network Device Monitoring: If you have network equipment that is not being monitored via SNMP (Simple Network Management Protocol), you can add Network Device Monitoring to capture data from those devices. By monitoring additional network devices, such as switches, routers, or firewalls, you can gather more detailed insights into their performance and identify any issues that may be contributing to the overall network problem.
- Modify your Dashboards: As you gather more data and insights, it is important to modify your dashboards in Obkio Vision to include all the relevant information you have collected. By customizing your dashboards to display the data you've gathered, you can easily visualize and correlate the information. This helps in identifying correlations, anomalies, or trends that may provide further clues to the root cause of the network issue.
By following these steps and expanding your data collection efforts, you can continue troubleshooting with a more comprehensive dataset. This additional data will aid in identifying the source of the network issue and further narrowing down the problem. With a more detailed understanding of the network performance and correlations, you can take informed actions to resolve the issue efficiently.
Learn about what SNMP monitoring is & how to use it to monitor performance of networking devices like firewalls, routers, switches and wifi access points.
Learn more

Effective collaboration and reporting are crucial elements of network troubleshooting and ensuring smooth communication among team members or with external service providers. Obkio Vision provides features that facilitate collaboration and reporting, allowing you to share visual traceroute results and generate comprehensive reports. Here's how you can leverage Obkio Vision for collaboration and reporting:
- Sharing visual traceroute results: Obkio Vision allows you to easily share visual traceroute results with your team members or external stakeholders. You can export the visual traceroute images or share them directly from the Obkio Vision interface. By sharing the visual representation of the network path, hops, and performance metrics, you can effectively communicate the troubleshooting findings and provide a clear understanding of the network issues.
- Collaborating with team members: Obkio Vision enables collaboration among team members involved in the troubleshooting process. You can invite team members to access and view the visual traceroute results, allowing them to contribute their insights and observations. This collaborative approach fosters a collective effort to diagnose and resolve network issues efficiently. Team members can provide feedback, share their expertise, and contribute to the troubleshooting process.
- Collaborating with service providers: When troubleshooting network issues that extend beyond your LAN or require collaboration with external service providers, Obkio Vision plays a valuable role. You can share the visual traceroute results with your Internet Service Provider (ISP) or other third-party service providers to help them understand the network path and any anomalies observed. This collaboration streamlines the communication process and facilitates a common understanding of the issue, leading to faster resolution times.
- Generating comprehensive reports: Obkio Vision allows you to generate detailed reports that summarize the network path information, performance metrics, and historical data. These reports provide a comprehensive overview of the troubleshooting process, including the identified issues, their impact on network performance, and the steps taken to resolve them. The reports serve as valuable documentation for future reference, compliance purposes, or sharing findings with stakeholders.
- Customizing dashboards for data correlation: Obkio Vision offers customizable dashboards that allow you to organize and present the collected data in a way that suits your specific troubleshooting needs. You can include key performance metrics, visual representations of network paths, and other relevant data points on your dashboards. By customizing your dashboards, you can easily correlate the data, spot trends, and gain insights into the network performance over time.
If you’ve been able to locate your network issue - that’s fantastic! Here’s how to troubleshoot with traceroutes based on where the network problem is located.
When troubleshooting network issues, it's important to distinguish between LAN (Local Area Network) issues, which occur within your own network infrastructure, and issues that may lie outside of your network boundaries. LAN issues are typically more localized and can be addressed internally.

Here are some steps to consider when troubleshooting LAN issues:
If the issue is isolated to specific devices within your LAN, focus on troubleshooting those devices individually. Check for software or firmware updates for the affected devices and apply them if necessary. Restart devices to clear any temporary glitches or errors. Additionally, you can perform connectivity tests, such as pinging or accessing resources, to identify specific devices that are experiencing connectivity issues.
- Look at the Network Sessions of all your local Monitoring Agent to isolate the issue down to a common Network Device.
- Analyze your Device Monitoring Metrics of the related Network Device to find out the cause of the issue (i.e. high bandwidth usage for example).
- Connect to the targeted Network Device to fix the issue.
- Continue looking at your Network Device and Network Sessions Metrics following your change to confirm the resolution.
Examine the configuration settings of your network devices, such as routers, switches, or firewalls, within the LAN. Check for any misconfigurations or discrepancies that could be impacting network performance. Verify IP addressing, subnet masks, gateway settings, and VLAN configurations to ensure they align with your network requirements.
Start by ensuring that all network cables and connections within your LAN are properly connected. Look for any loose or damaged cables that could be causing connectivity problems. Verify that devices are connected to the correct network ports and that network equipment, such as switches or routers, are powered on and functioning correctly.
Utilize network monitoring tools, such as Obkio Vision or other network monitoring software, for LAN monitoring and to track LAN traffic patterns. Monitor network utilization, bandwidth usage, and performance metrics within your LAN to identify any anomalies or excessive traffic that may be causing network issues. Analyze the data collected to pinpoint potential bottlenecks or areas of congestion within your LAN.
Collaborate with your internal IT team, network administrators, or other relevant stakeholders to share information, discuss observations, and collectively troubleshoot LAN issues. Effective communication and coordination among team members can expedite the troubleshooting process and lead to quicker resolution.
Master LAN Monitoring: Learn the essentials, best practices, and improve LAN network performance with Obkio's Network Performance Monitoring tool.
Learn more

When troubleshooting network issues between the LAN (Local Area Network) and WAN (Wide Area Network), it's essential to use the Visual Traceroute Tool to monitor network paths and identify potential problem areas. Here are the steps to troubleshoot issues between LAN and WAN using the Visual Traceroute Tool:
Determine the network segment where the LAN and WAN connection is established. This is typically the point where your LAN connects to your ISP's network or the edge router/firewall that serves as the gateway between your LAN and the external network.
Utilize the Visual Traceroute Tool, such as Obkio Vision, to initiate a traceroute from a device within your LAN towards an external destination or a specific IP address on the WAN side. Observe the visual representation of the traceroute, which will display the network path and the routers/hops involved.
Examine the visual traceroute results provided by the tool. Focus on the specific hops or routers between your LAN and the WAN side. Look for any significant changes, high latency values, packet loss, or deviations from the expected network path. These abnormalities may indicate potential issues or bottlenecks impacting the communication between your LAN and the WAN.
Pay close attention to specific hops in the visual traceroute that are part of the network path between your LAN and the WAN. Identify the IP addresses or hostnames associated with those hops and investigate further. Check for any known issues or reports associated with those network nodes. Additionally, examine the latency values and response times at each hop to identify any performance anomalies.
Assess the configurations of your network devices, such as routers, switches, or firewalls, within your LAN. Verify that the necessary routing and firewall rules are properly configured to allow smooth communication between your LAN and the WAN. Any misconfigurations or rule conflicts could potentially cause issues with the LAN-WAN connectivity.
- Analyze the Device Monitoring Metrics of your related edge equipment (i.e. SD-WAN Edge, Firewall or WAN Switches) to identify if a performance issue is being caused by one of your Network Devices.
- If you find something: Connect to the targeted equipment, apply a change to the issue, and look at your Device Monitoring and Network Session Metrics to confirm the resolution.
- If everything looks good on your end: Move on to troubleshooting WAN issues in the next point.

When troubleshooting network issues, it's important to understand that WAN (Wide Area Network) issues are typically located outside of your own network infrastructure, often within your Internet Service Provider's (ISP) network. In such cases, it is recommended to reach out to your ISP for further support.
- Contact your ISP to get technical support using the screenshots of Monitoring Sessions, Dashboards or Traceroutes in Vision.
- Share results of Live Traceroutes with your ISP using a public link.
- If your ISP wants to analyze your data further, you can create a temporary Read-Only User in your Obkio account for them.

ISPs have comprehensive visibility into their network infrastructure, including the connections, routers, and transit points that make up their network. They can analyze network traffic, monitor performance, and identify potential bottlenecks or congestion points that may impact your WAN connectivity. By collaborating with your ISP, you can tap into their network visibility and benefit from their insights and troubleshooting capabilities.
Additionally, ISPs are responsible for delivering reliable and stable WAN connectivity as part of their service offerings. They typically have Service-Level Agreements (SLAs) that outline the expected performance and uptime guarantees. By reporting WAN issues to your ISP, you can hold them accountable for delivering the agreed-upon service quality. They are obligated to investigate and resolve network problems within their control.
Learn how to identify and diagnose Internet problems and Internet connectivity issues in your network using Network Monitoring and Traceroutes.
Learn more

Troubleshooting network issues is a critical task for network administrators and IT teams to ensure optimal performance and user experience. With the Obkio Vision Visual Traceroute Tool, network troubleshooting becomes more efficient, insightful, and collaborative. By leveraging the power of visual traceroutes, network administrators can gain a deeper understanding of network paths, identify bottlenecks or anomalies, and pinpoint the root causes of performance issues.
With Obkio Vision, network administrators have a powerful tool at their disposal to troubleshoot networks effectively. Whether it's isolating LAN issues, identifying problems between the LAN and WAN, or collaborating with service providers, Obkio Vision empowers network administrators to optimize network performance and ensure a seamless user experience.
Now that you know how to troubleshoot networks with Obkio Vision, our Advanced Visual Traceroute tool, it’s time to get started!
Remember, the longer that network issues go unsolved, the more havoc they can cause in your network.
Download and use Obkio Vision for quick network troubleshooting for Windows, macOS and Linux.
You can also use Obkio Vision as a complementary feature with Obkio’s full Network Monitoring & Troubleshooting SaaS solution along with a variety of other Network Monitoring features.
- 14-day free trial of all premium features
- Deploy in just 10 minutes
- Monitor performance in all key network locations
- Measure real-time network metrics
- Identify and troubleshoot live network problems


 Obkio Blog


