




 Obkio Blog


 Subscribe
Table of Contents
Table of Contents
Network congestion usually shows up as the same few complaints: video calls that stutter, applications that hang, and file transfers that take far longer than they should. The connection is up, but traffic is arriving faster than a link or device on the path can forward it.
For a business, the hard part usually isn't knowing that the network is slow. It's finding out where the congestion is, whether that's your LAN, your Internet circuit, a firewall or your ISP's network, and who needs to fix it.
Network congestion happens when more traffic tries to cross a link or network device than it can handle. Packets wait in buffers or get dropped, which shows up as higher latency, jitter and packet loss, and slower speeds. Common causes include high traffic volume, inadequate bandwidth, outdated or overloaded hardware, misconfigurations, network attacks, unnecessary traffic and crowded Wi-Fi.
This article covers how to recognize network congestion, what causes it, how to find where it's happening, and how to fix and prevent it.
What is Network Congestion? 
Network congestion happens when the traffic on a network is more than a link or device can carry. Every link has a fixed capacity, and every router, switch and firewall can only process so many packets per second. When traffic goes past that limit, the extra packets wait in a buffer until there's room to send them. If the buffer fills up, new packets are dropped.
It works a lot like a traffic jam. A highway can only carry so many cars per lane. During rush hour, more cars arrive than the road can handle, so traffic slows down and everyone takes longer to reach their destination. On a network, packets are the cars and the link's capacity is the number of lanes. When too many packets try to use the same link at once, they queue up, and data takes longer to arrive.
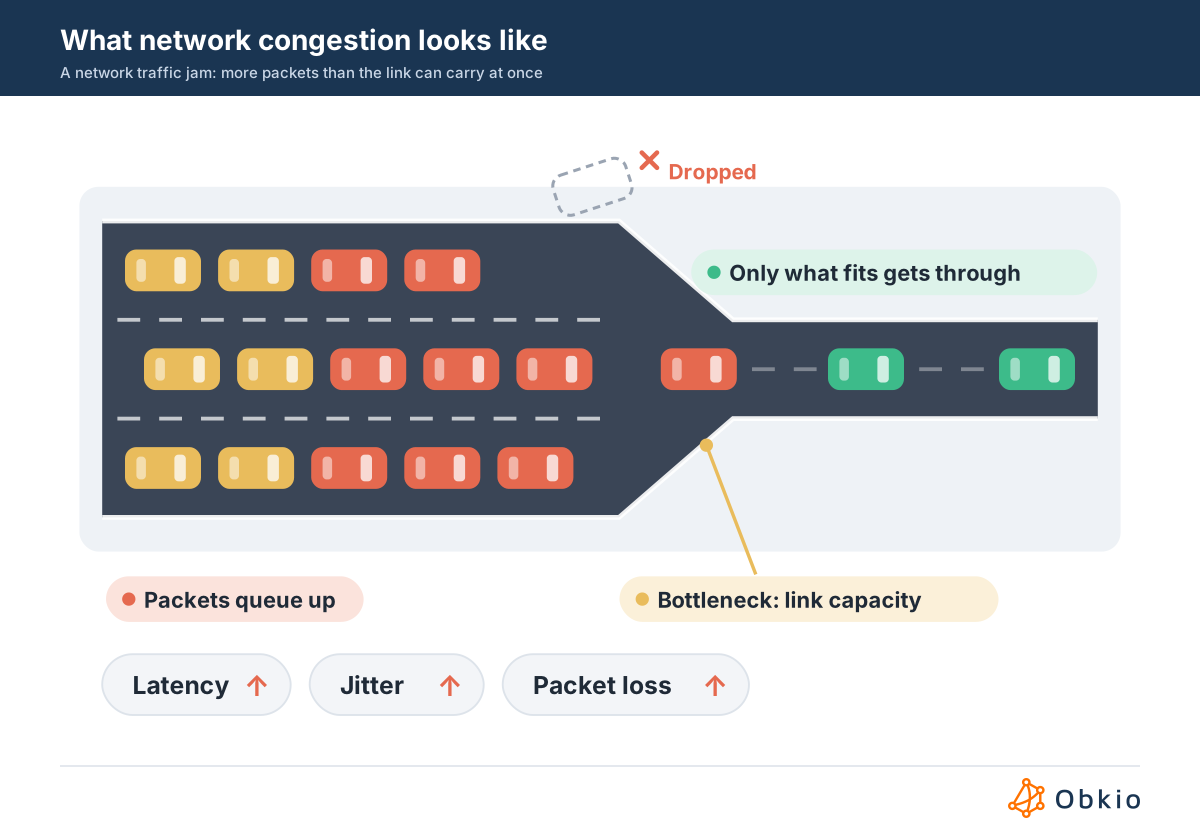
That's why congestion rarely looks like a full outage. The network still works, but latency climbs while packets wait in queues, jitter increases as queue lengths change, and packet loss rises once buffers overflow. Applications that need a steady stream of data, like VoIP and video calls, feel it first.
Congestion can happen anywhere on the path: in your local network (LAN congestion), on your WAN or Internet circuit, on a firewall or router, or in your ISP's network and beyond.

What Are the Symptoms of Network Congestion?
Network congestion doesn't always announce itself, and its symptoms overlap with other network problems. These are the ones that usually point to it:
- Slow Internet Speeds: Web pages load slowly, downloads and uploads take longer than usual, and cloud apps feel sluggish, even though the connection is up.
- Packet Loss: Once buffers overflow, packets are dropped. Applications have to resend them, which slows transfers down even more.
- High Latency: Packets waiting in queues add delay, which you notice as lag in video calls, remote desktop sessions and anything interactive.
- Connection Timeouts: When delay and loss get bad enough, connections time out or fail to establish, and users can't reach some applications at all.
- Poor voice or video quality: Calls become choppy, robotic or frozen, and video turns pixelated. Real-time traffic can't wait for lost packets to be resent, so it's usually the first thing users complain about.
- Unresponsive Applications: Applications hang while waiting for data, especially SaaS and VPN-based applications that depend on a steady connection.
If you're seeing several of these at once, especially at the same times each day, congestion is a likely cause.
7 Common Causes of Network Congestion
Most network congestion comes down to one of two things: more traffic than the network was sized for, or a device or configuration that can't handle the traffic it receives. These are the most common causes:
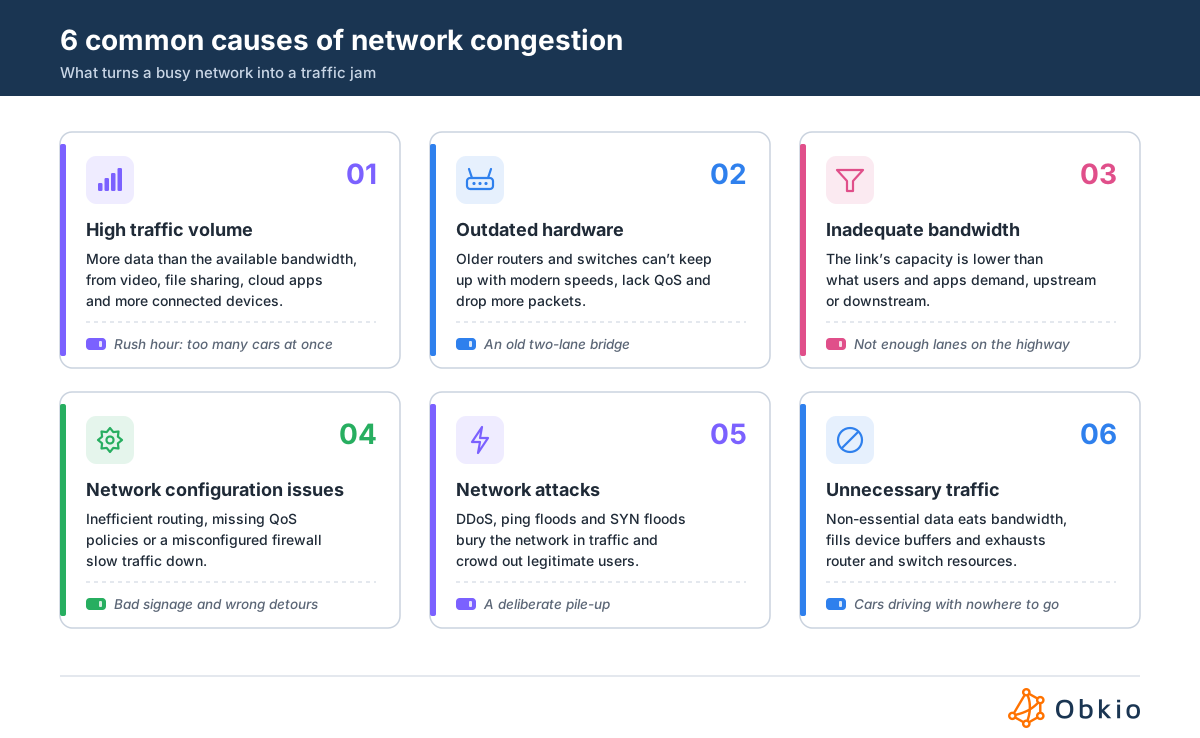
Network Congestion Cause #1: High Traffic Volume
Every network has a limited amount of bandwidth. When more data needs to cross a link than the link can carry, it becomes congested.
This usually happens where traffic converges: an Internet circuit shared by an entire office, an uplink between switches, or a firewall that handles every connection for a site.
The traffic itself is usually legitimate. Video calls, cloud backups, file sync, large software updates and data-heavy SaaS applications all add up, and every new user and device adds more. When several of them peak at the same time, you get high bandwidth usage and congestion.
Network Congestion Cause #2: Outdated Hardware
Older routers, switches and firewalls can become the network bottleneck even when the circuit has enough bandwidth:
- They can't keep up with the traffic. A device sized for a 100 Mbps circuit five years ago may not be able to forward the traffic of a 1 Gbps circuit today. Firewalls are especially affected: their real throughput drops sharply once features like intrusion prevention, SSL inspection or VPN encryption are turned on.
- They lack traffic management features. Without Quality of Service (QoS) or proper queuing, low-priority traffic competes equally with calls and business applications.
- They're more prone to errors. Aging hardware and outdated firmware are more likely to drop packets or generate errors, which forces devices to retransmit data and adds even more load.
Network Congestion Cause #3: Inadequate Bandwidth
Inadequate bandwidth is one of the most common causes of network congestion or network overload. The link simply doesn't have enough capacity for the devices and applications using it.
How much bandwidth you need depends on the number of users and devices, the applications they use, and when they use them. A circuit that was fine for email and web browsing can be overwhelmed once everyone moves to video calls and cloud storage.
Don't forget the upload direction. Many business Internet circuits, especially cable and DSL, have much less upload than download capacity. Video calls, cloud backups and file uploads can fill the upload side while the download side still looks fine. Because a saturated upload also delays the acknowledgments that downloads depend on, a full upload link can slow down everything on a slow Internet connection.
Network Congestion Cause #4: Network Configuration Issues
A correctly sized network can still congest if network devices are configured incorrectly. Common examples include:
- Speed and duplex mismatches between a device and a switch port, which cause errors and retransmissions that cut real throughput on that link.
- Missing or wrong QoS policies, so low-priority traffic uses bandwidth that calls and business applications need, or real-time traffic lands in the wrong queue.
- Missing or misconfigured traffic shaping. If your edge device sends traffic faster than the circuit can carry it, the queue forms in your ISP's equipment, where your QoS policies don't apply.
- Inefficient routing, like a full-tunnel VPN or SASE setup that sends all Internet and SaaS traffic through headquarters or one distant point of presence, or traffic that stays on a backup link after the primary link has recovered.
Network Congestion Cause #5: Network Attacks
Some attacks are designed to create congestion. In a Distributed Denial of Service (DDoS) attack, a large number of compromised devices, often called a botnet, flood a target with traffic until its links or devices are overwhelmed.
DDoS attacks are hard to block because the attack traffic often looks legitimate. A large enough attack also fills your Internet circuit before the traffic ever reaches your firewall, so it can't be fixed from inside your network.
Other attacks target devices rather than bandwidth. A Ping flood sends large numbers of ICMP echo requests to a target, and a SYN flood opens large numbers of half-finished connections that exhaust a firewall's or server's connection tables. Compromised devices inside your own network, like malware-infected machines sending spam or scanning the network, can also generate enough traffic to congest a link.
Network Congestion Cause #6: Unnecessary Traffic
Unnecessary traffic is data that crosses your network but doesn't contribute to the work the network is there to support. Common sources include personal video streaming, every device downloading the same software update separately, cloud sync of large folders, and backups running during business hours.
Here's how unnecessary traffic causes network congestion:
- Bandwidth consumption: It uses capacity that business traffic needs, leaving less room for calls and applications.
- Resource exhaustion: Routers, switches and firewalls have to process every packet, so excess traffic uses up CPU and memory that legitimate traffic needs.
- Buffer overflow: Excess traffic fills device buffers, so new packets are delayed or dropped.
- Broadcast storms: A switching loop or a misbehaving device can flood the LAN with broadcast or multicast traffic that every device has to process, which can bring a whole network segment to a crawl.
Network Congestion Cause #7: Wi-Fi Congestion
Wi-Fi is a shared medium. On a given channel, only one device can transmit at a time, so every client connected to an access point competes for the same airtime. Congestion builds up when:
- Too many clients share one access point, like in a busy meeting room or open office.
- Nearby networks use the same channels, especially in the crowded 2.4 GHz band, so devices wait longer and collide more often.
- Slow clients use up airtime. A device far from the access point connects at a low data rate and takes much longer to send the same amount of data, slowing down every other client.
Wi-Fi congestion is local to the wireless network, so wired users at the same site won't see it. That makes Wi-Fi monitoring and monitoring your access points useful for telling it apart from congestion on your Internet circuit.
Peak-Hour Congestion: When Your Network Slows Down at the Same Time Every Day
Some congestion has a schedule. Everything works fine in the morning, then latency climbs, calls get choppy and pages crawl at roughly the same time every day. That's peak-hour congestion: a link somewhere on your path runs out of capacity when the most people are using it.
It can happen in a few places:
- Inside your ISP's network, where many customers share the same equipment and links. When everyone in the area comes online, the shared capacity fills up.
- Between networks, on the links where your ISP hands traffic off to other providers. In that case, only the services that cross that link slow down.
- In your own network, when backups, updates or large syncs are scheduled at the same time every day.
For home connections, the busiest window is usually the evening. Regulators like the FCC measure peak performance between 7 and 11 PM for that reason. Business networks don't follow one standard window, so the only reliable way to know your peak hours is to look at your own history.
How to tell it's peak-hour congestion and not something else:
- It repeats. The slowdown starts and ends at about the same times over several days.
- Latency rises first. Queues fill before packets drop, so latency and jitter climb, then packet loss follows.
- It isn't tied to your own usage. If it only happens when someone in your office is uploading or downloading, your own connection is full, not your ISP's.
- It affects more than one destination. If only one service slows down, the problem is more likely on that specific path.
A one-off speed test won't show any of this. Continuous monitoring will, because it builds the history you need to see the pattern and to show your ISP exactly when and where performance drops.
If this sounds like what happens to your connection every evening, read Why Is My Internet Slow at Night? for the causes and fixes, and How to Prove Your ISP Is the Problem when you're ready to escalate.

Internet slows down at night when your ISP’s network, or your own, runs out of capacity at peak hours. Here’s how to find the cause & prove it to your ISP.
Learn more

What is the Impact of Network Congestion?
When a network is congested, it takes longer for data to reach its destination, and some of it doesn't arrive at all. Applications retransmit the lost packets, which adds more traffic to a link that's already full. Users notice slow applications and choppy calls, open tickets, and lose time on tasks that should take seconds.
Congestion also spreads. A congested Internet circuit or firewall affects every user and application behind it, so a problem at one point can slow down an entire site.
The cost adds up: lost productivity, time spent troubleshooting, and bandwidth or hardware upgrades bought in a hurry, sometimes for a link that wasn't the problem.
What Network Applications Are Impacted By Network Congestion?
Some applications are more sensitive to congestion and other network problems than others, depending on how much bandwidth they need and how well they tolerate delay and loss:
- Real-time applications are hit first and hardest. VoIP, video conferencing like Zoom and Microsoft Teams, and other UCaaS tools can't buffer their way around delay or resend lost packets in time. Even a small amount of loss or jitter degrades VoIP quality.
- Interactive applications feel slow. SaaS and cloud applications, web browsing, remote desktop and VDI, and connections over a VPN all wait on round trips, so every extra millisecond of queuing delay makes them feel less responsive.
- Bulk transfers take longer, and often cause the problem. Backups, large file transfers, cloud sync and software updates tolerate delay well, but they're also the traffic most likely to fill a link and slow everything else down.
Detect and Diagnose Network Congestion with Obkio
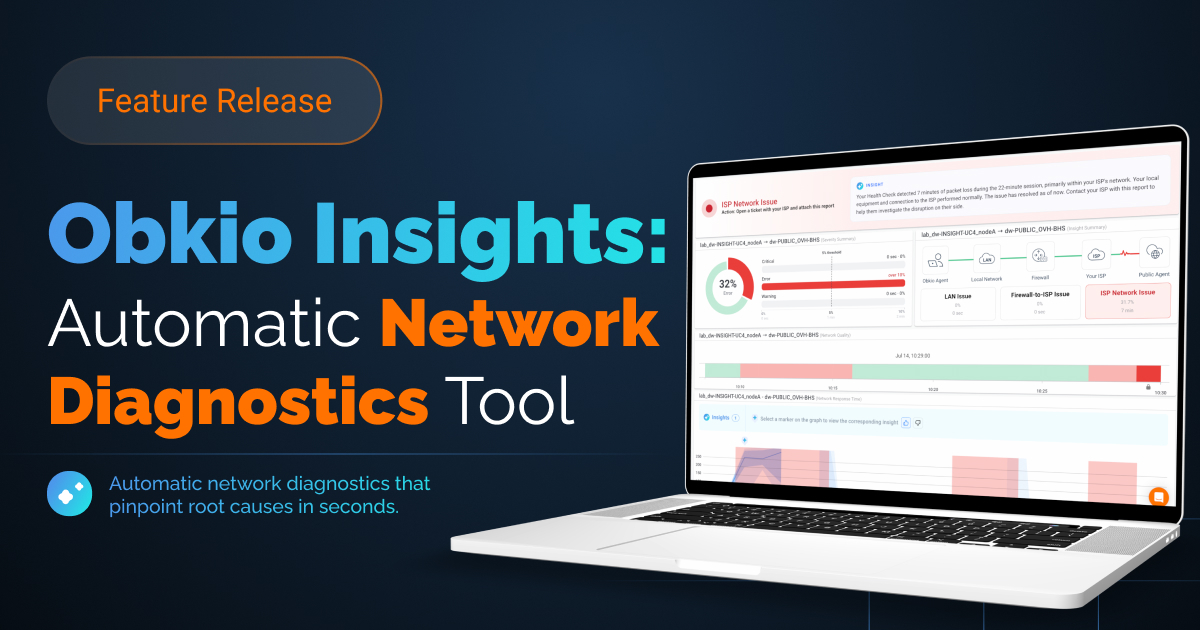
Knowing the common causes is one thing. Finding out which one is behind the slowdown on your network is another. Obkio continuously monitors network performance from end to end, and Obkio Insights automatically diagnoses what's causing a slowdown, where in the network it's happening, and who needs to fix it.
Instead of comparing graphs to work out whether it's a saturated Internet circuit, an overloaded firewall or congestion in your ISP's network, you get a written explanation backed by the data.
- 14-day free trial of all premium features
- Deploy in just 10 minutes
- Monitor performance in all key network locations
- Measure real-time network metrics
- Get automatic network diagnostics with Obkio Insights
- Identify and troubleshoot live network problems

How to Detect Network Congestion
Symptoms tell you something is wrong, but not where. To find congestion, you need data from the network path and from the devices along it, collected while the problem is happening. The four steps below start with end-to-end performance and narrow down to individual devices and metrics.
Step 1: Monitor End-to-End Network Performance
Congestion can be anywhere between your users and the services they rely on, so start with a view of the whole path. Synthetic monitoring sends test traffic between points in your network and measures latency, jitter and packet loss continuously, so you can see when performance drops and which locations are affected.
Obkio does this with Network Monitoring Agents deployed at your sites, in the cloud and on the Internet. The agents exchange synthetic traffic to measure network metrics in both directions, so you have data from the moment congestion starts, not just from the moment someone reports it.
Obkio Insights then adds automatic network diagnostics. It cross-references the data Obkio already collects (performance sessions between your agents, Visual Traceroutes, speed tests, and bandwidth, CPU, and memory from your network devices) to tell you:
- What's causing the congestion: Bandwidth saturation on your Internet circuit, a firewall running out of CPU or memory, or packet loss in your ISP's network.
- Where it's happening: In your local network, at the edge, or somewhere along the path in your provider's network.
- Who needs to fix it: Your team, your ISP, or your cloud or service provider.
Instead of a graph showing that latency spiked, you get a named cause and an owner, backed by the data to prove it.


Step 2: Check Your Network Devices
Congestion often starts on overloaded network equipment, so check your devices next. Obkio's Network Device Monitoring polls your routers, switches and firewalls for the bandwidth going through each interface, along with CPU and memory.
If an interface or your Internet connection is close to its capacity when the slowdown happens, you've likely found the congestion point.
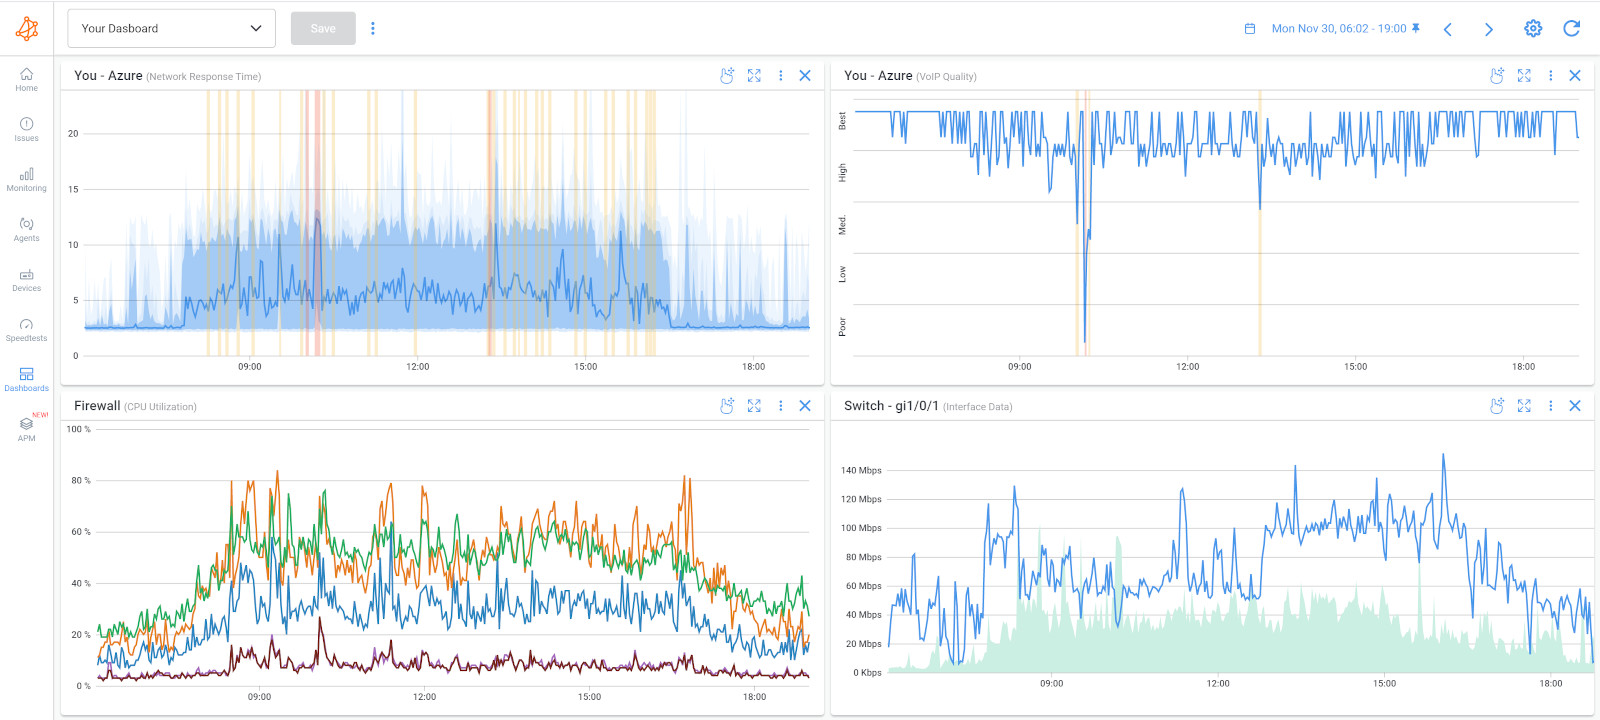
Devices worth monitoring for congestion include:
- Routers and switches: They forward traffic between every part of your network, so their interfaces show where traffic converges. Monitoring network switches and routers shows how much traffic each link carries and which ones are close to capacity.
- Firewalls: Every connection to and from the Internet passes through the firewall, so it's one of the most common congestion points. Watch its bandwidth alongside its CPU and memory.
- Servers and storage devices: Busy servers and storage can be the destination of heavy traffic, like backups and file transfers, and their links can congest just like any other.
- Endpoints: Desktops, laptops and mobile devices are where bandwidth-hungry applications and misconfigured devices usually show up.
Monitoring these network devices shows you which parts of your network are close to their limits, before they start dropping traffic.
Step 3: Look for Devices Running Out of Resources
Congestion isn't always about bandwidth. A device can also become the bottleneck when it doesn't have enough CPU or memory to process the traffic going through it, even when the link still has capacity left. Check CPU usage and memory on your devices alongside their bandwidth.
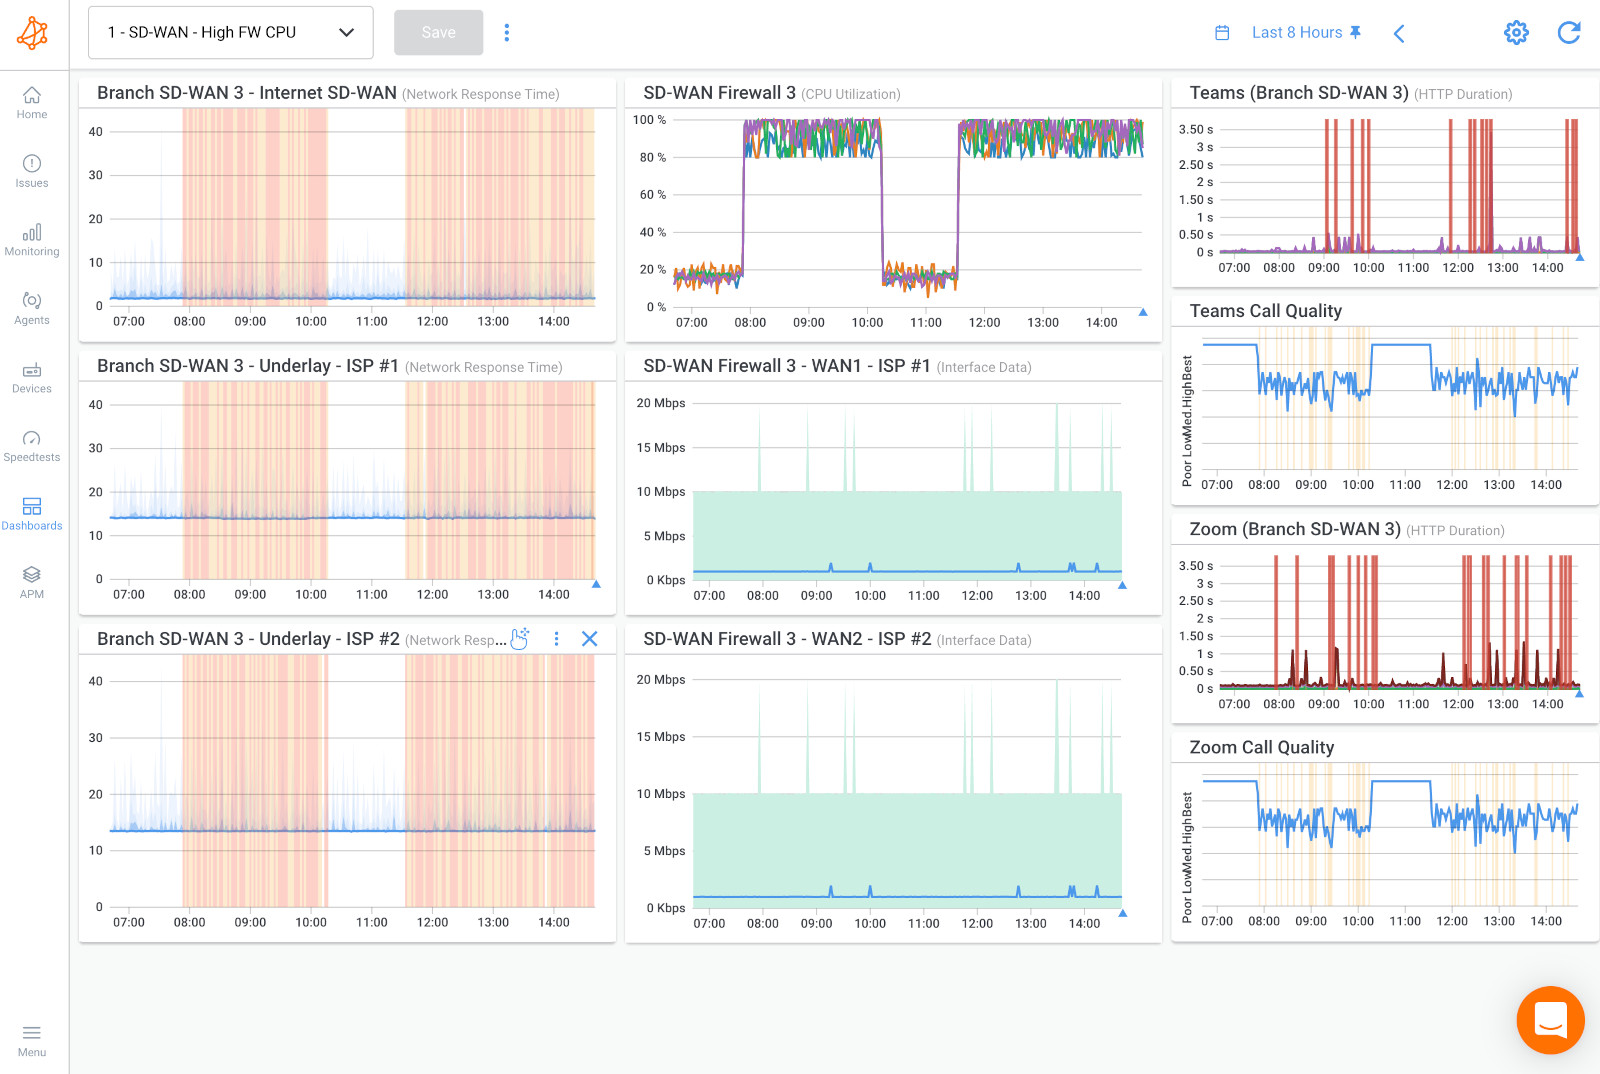
The screenshot above is an example of high CPU usage on SD-WAN Devices affecting all sessions (in the second column). This means that the network device does not have enough available resources to manage the throughput. Since it can't process packets fast enough, it drops them, which causes packet loss.
Step 4: Measure the Network Metrics That Signal Congestion
Device data only covers equipment you can access. Many businesses rely on equipment managed by their ISP or MSP, and congestion can also happen outside your network entirely: in your ISP's network, on the local loop or further out on the Internet.
In those cases, you can still identify network congestion from end-to-end network metrics. These are the ones to watch, with common rules of thumb for when they point to a problem:
- Bandwidth utilization: How much of a link's capacity is in use. Short bursts to 100% are normal. Sustained utilization above roughly 70 to 80% during busy hours means the link is at risk of congestion.
- Packet loss: The percentage of packets that never reach their destination. Real-time applications start to suffer at around 1% loss, and loss that rises and falls with traffic levels is a strong sign of congestion. See how much packet loss is acceptable for details by application.
- Round-trip time (RTT): The time it takes a packet to reach its destination and come back. Distance sets a baseline, so what matters is RTT rising above its normal level when traffic increases. For voice, ITU-T G.114 recommends keeping one-way delay under 150 ms.
- Network jitter: The variation in delay between packets. It rises as queue lengths change, and voice and video quality usually suffer once jitter goes above about 30 ms.
- Network Throughput: The amount of data actually delivered over a period of time. If network throughput drops well below what the link should deliver while utilization is high, traffic is being delayed or dropped somewhere on the path.
- Interface discards and errors: Most devices count the packets they drop when an interface's queue is full (output discards). A rising discard count on a busy interface tells you exactly which link is congested.
These metrics work because of how congestion behaves: network congestion causes packet loss, increased latency and jitter. When a link is congested, packets accumulate in the device's buffer.
It takes time to drain that buffer, which increases latency and jitter. If the buffer is small, latency doesn't increase as much, but more packets are dropped. If the buffer is very large, few packets are dropped, but latency can climb by hundreds of milliseconds under load. That's known as bufferbloat. Depending on the equipment, buffer size can be adjustable or fixed in hardware.
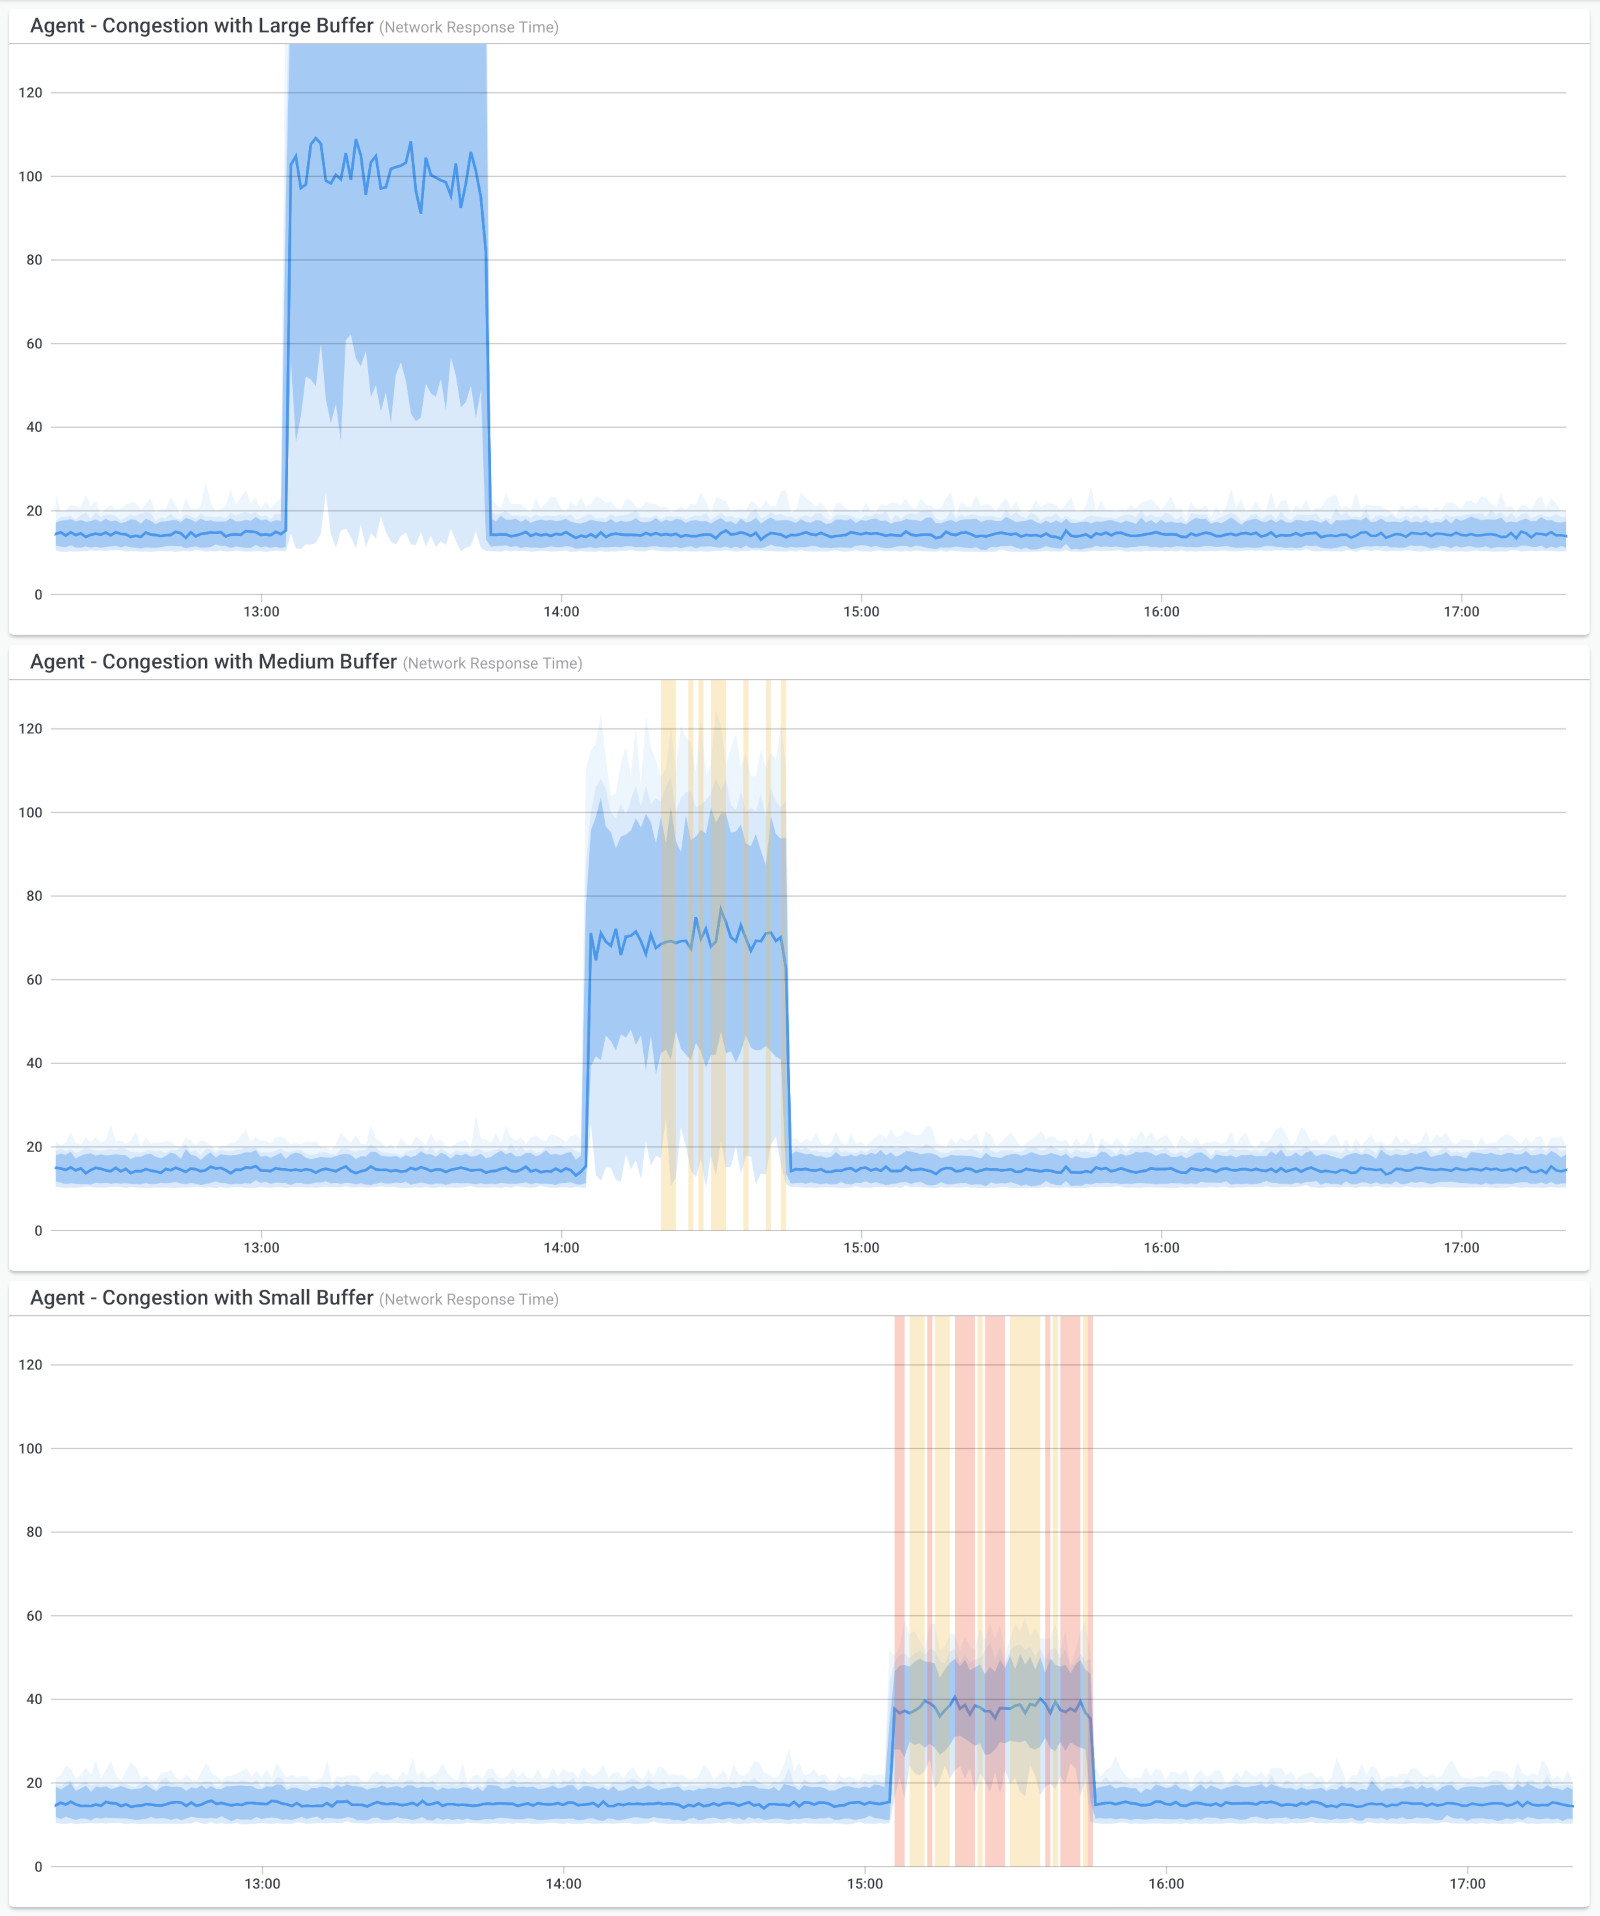
In this screenshot, we can see three graphs.
- In the first graph, you can see there is network congestion and the buffer is very large. Therefore there is little packet loss but a lot of latency and jitter.
- In the second graph, there is network congestion with a medium buffer, so the packet loss, latency and jitter are all moderate.
- In the third graph, there is network congestion with a small buffer, so the latency and jitter don’t increase too much but there is more packet loss.
6 Techniques for Identifying Network Congestion
The steps above rely on network monitoring, which is the most complete way to monitor network congestion and network performance as a whole. These are the other techniques network teams use, along with their limitations:
1. Network Monitoring Software to Identify Network Congestion
Network performance monitoring is a crucial technique for identifying network congestion. By measuring various metrics related to network performance, network administrators can detect signs of congestion and take proactive steps to address the issue.
There are a number of different network performance metrics that can be monitored to identify congestion. Some of the key metrics include:
- Bandwidth utilization: This metric measures the amount of bandwidth being used on a network. If bandwidth utilization approaches 100%, it may indicate that the network is becoming congested.
- Packet loss: This metric measures the number of packets that are lost or dropped during transmission. If packet loss rates are high, it may indicate that the network is congested and unable to handle the volume of traffic.
- Latency: This metric measures the time it takes for data packets to travel from one point on the network to another. If latency rates are high, it may indicate that the network is congested and unable to handle the volume of traffic.
- Jitter: This metric measures the variation in latency over time. High levels of jitter can indicate that the network is experiencing congestion, as packets are being delayed or dropped.
By monitoring these and other network performance metrics, network administrators can quickly detect signs of congestion and take steps to address the issue. For example, they may need to optimize network configurations, increase available bandwidth, or implement Quality of Service (QoS) policies to prioritize critical traffic.
There are a number of network performance monitoring tools available, like Obkio that can help automate the process of monitoring network performance metrics. These tools can provide real-time network monitoring alerts when congestion is detected, allowing network administrators to quickly respond to and resolve issues before they impact network performance.

Learn how to detect network congestion & perform a network congestion test inside & outside your network with Network Monitoring & Network Device Monitoring.
Learn more
2. Flow Analysis to Identify Network Congestion
Flow analysis is another important technique for identifying network congestion. Flow analysis involves capturing and analyzing network traffic to gain insight into how traffic is flowing through the network and to identify potential congestion points.
Flow analysis tools capture and analyze data at the flow level, which refers to a set of packets that share common attributes, such as the same source and destination IP addresses, protocol, and port numbers. By analyzing flows, these tools can provide detailed information about how traffic is flowing through the network, including the source and destination of traffic, the protocols being used, and the amount of data being transferred.
By analyzing flow data, network administrators can identify potential congestion points and take steps to address the issue. For example, they may need to reconfigure network devices to optimize traffic flow, implement network load balancing to distribute traffic across multiple paths, or identify and block high-bandwidth applications that are consuming too much network resources.
Flow analysis tools can also provide insight into network security threats, such as Distributed Denial of Service (DDoS) attacks, by identifying anomalous traffic patterns or unusual levels of traffic from specific sources. By monitoring flow data for signs of suspicious activity, network administrators can quickly detect and respond to potential security threats.
3. Ping to Identify Network Congestion
Ping is a simple yet useful technique for identifying network congestion. It involves using the Ping utility to send ICMP (Internet Control Message Protocol) packets to a remote device on the network and measuring the response time. ICMP packets are a type of network packet that are used to test network connectivity and diagnose network problems.
By measuring the response time of ICMP packets, network administrators can quickly identify potential congestion points on the network. If response times are slow or there are significant delays, it may indicate that the network is experiencing congestion.
However, it is important to note that Ping is not always a reliable indicator of network congestion, as there are many factors that can impact response times, such as network latency, distance between devices, and the processing power of the remote device. In addition, Ping only measures response times between two devices, and does not provide a comprehensive view of network performance.
To obtain a more accurate picture of network congestion, network administrators should use Ping in conjunction with other network monitoring and analysis tools, such as flow analysis or network performance monitoring tools. These tools can provide a more comprehensive view of network performance and help identify the root cause of congestion issues.
4. Traceroutes to Identify Network Congestion
Traceroute is another useful technique for identifying network congestion. It involves using the Traceroute utility to trace the route of network packets from the source device to the destination device, and measuring the response times of each hop along the way.
Traceroute works by sending a series of packets with increasing TTL (Time-to-Live) values, which causes the packets to expire and be discarded at each hop along the route. When a packet is discarded, the hop sends an ICMP error message back to the source device, which includes information about the hop's IP address and response time.
By analyzing the response times of each hop along the route, network administrators can identify potential congestion points and determine where delays are occurring. If response times are consistently slow at a particular hop or set of hops, it may indicate that there is congestion at that point in the network.
However, it is important to note that Traceroute has limitations and may not always provide a complete picture of network congestion. Traceroute only traces the route of packets along a single path, and does not take into account other paths that traffic may be flowing through. In addition, Traceroute may be blocked or return inaccurate results due to network security policies or other factors.
To obtain a more accurate picture of network congestion, network administrators should use Traceroute in conjunction with other network monitoring and analysis tools, such as flow analysis or network performance monitoring tools. These tools can provide a more comprehensive view of network performance and help identify the root cause of congestion issues.

5. Network Performance Testing to Identify Network Congestion
Network performance testing is another technique for identifying network congestion. This involves running network traffic tests to simulate different traffic loads and measure the response times and other performance metrics.
One common method of network performance testing is to use a traffic generator, which can simulate different types of traffic loads and measure response times, throughput, and other performance metrics. Traffic generators can simulate different types of traffic, including voice, video, and data traffic, and can also simulate different network conditions, such as latency, jitter, and packet loss.
By running network performance tests under different traffic loads and conditions, network administrators can identify potential congestion points and determine how the network performs under different scenarios. If response times and other performance metrics degrade under heavier traffic loads, it may indicate that the network is experiencing congestion.
However, it is important to note that network performance testing can be resource-intensive and may require specialized equipment or software. In addition, network performance testing only provides a snapshot of network performance at a particular point in time and may not reflect ongoing network conditions.
To obtain a more complete view of network congestion, network administrators should use network performance testing in conjunction with other network monitoring and analysis techniques, such as flow analysis or network performance monitoring tools. These tools can provide ongoing monitoring and analysis of network performance and help identify the root cause of congestion issues.
6. User Feedback to Identify Network Congestion
User feedback is another useful technique for identifying network congestion. This involves soliciting feedback from end-users, such as employees or customers, about their network experience, including any issues or problems they may have encountered.
There are several ways to collect user feedback, including surveys, focus groups, or informal discussions. By gathering feedback from a broad range of users, network administrators can gain insights into how the network is performing from the end-user's perspective and identify potential areas of congestion or other issues.
For example, if users report slow response times when accessing certain applications or websites, it may indicate that there is congestion on the network. Similarly, if users report frequent disconnects or other issues, it may indicate a problem with network connectivity or hardware.
User feedback can also provide valuable insights into how users are utilizing the network and what types of traffic are being generated. By understanding user behavior and traffic patterns, network administrators can optimize network resources and ensure that the network is configured to meet the needs of its users.
However, it is important to note that user feedback should be used in conjunction with other network monitoring and analysis techniques, such as network performance testing and flow analysis. User feedback is subjective and may not always provide a complete picture of network performance or identify the root cause of congestion issues. By combining user feedback with other monitoring techniques, network administrators can gain a more comprehensive understanding of network performance and make informed decisions about network optimization and troubleshooting.
How to Fix Network Congestion
The right fix depends on what you found and where. Match the fix to the cause:
- Your Internet circuit or WAN link is saturated: Find out what's using it with bandwidth usage monitoring or flow data. Move bulk transfers like backups and updates outside business hours, prioritize real-time traffic with QoS, and shape traffic to just below the circuit's rate so the queue forms on your device, where QoS applies. If the link is still full with only business traffic on it, upgrade the circuit or add a second one and balance traffic across them, for example with SD-WAN.
- The upload direction is full: Apply the same QoS and shaping to outbound traffic. If uploads regularly fill the link, move to a circuit with more upload capacity, like a symmetric fiber connection.
- Latency spikes under load, with little packet loss (bufferbloat): Turn on Active Queue Management (AQM), such as fq_codel or CAKE, on your edge device if it supports it. It keeps queues short so latency stays low even when the link is busy.
- A router or firewall is running out of CPU or memory: Check which features use the most resources, like intrusion prevention, SSL inspection or VPN encryption. Tune or offload them, or replace the device with one sized for your throughput with those features enabled.
- A configuration problem: Fix speed and duplex mismatches, correct QoS policies and queue assignments, and use split tunneling so trusted SaaS and collaboration traffic goes directly to the Internet instead of through headquarters.
- Wi-Fi congestion: Add access points in crowded areas, move clients to the 5 GHz and 6 GHz bands, adjust channels to avoid overlap, and connect fixed devices like desktops and printers by cable.
- Unnecessary or malicious traffic: Block or rate-limit non-business traffic, isolate infected devices, and fix switching loops. For volumetric DDoS attacks, use your ISP's or a third-party DDoS protection service, since the traffic has to be filtered before it reaches your circuit.
- Congestion in your ISP's network or beyond: You can't fix it yourself, but you can prove it to your ISP with monitoring data that shows when it happens and which hops are affected, and escalate from there.
Once the fix is in place, keep monitoring the same metrics to confirm that latency, jitter and packet loss stay down during your busiest hours.

6 Best Practices for Avoiding Network Congestion
Network congestion and network overload are easier to prevent than to troubleshoot in the middle of a workday. These practices help optimize network performance and keep congestion from coming back:
- Plan capacity from real usage data: Track bandwidth utilization over weeks and months, not just today. Network capacity planning shows you when a link is trending toward its limit, so you can upgrade before users feel it.
- Set QoS policies before you need them: Define which traffic matters most, like voice, video and key business applications, and make sure your devices prioritize it. QoS monitoring confirms that your policies actually work across the network.
- Schedule bulk traffic off-peak: Run backups, large syncs and software updates outside business hours, and use local update caching so devices don't each download the same files from the Internet.
- Monitor continuously and alert early: Use network monitoring tools with alerts on latency, jitter and packet loss, so you hear about congestion when it starts, not when the tickets pile up.
- Build in redundancy: A second Internet circuit with load balancing or SD-WAN gives traffic somewhere to go when one link is full or down.
- Review hardware and configuration regularly: Check that routers, firewalls and access points are still sized for your traffic with all their features enabled, and that QoS, shaping and VPN settings still match how your users work.
Find and Fix Network Congestion with Obkio
Network congestion happens when traffic exceeds what a link or device can handle, and it shows up as higher latency, jitter and packet loss well before anything goes down. Fixing it starts with knowing where it is: in your LAN, on your Wi-Fi, on your Internet circuit, on a firewall or in your ISP's network.

Obkio monitors your network performance 24/7 from every location that matters. When congestion hits, Obkio Insights automatically diagnoses the root cause, shows where it's happening and tells you who needs to fix it. Deploy an agent today, and you'll have the data to pinpoint the next slowdown while it's happening.


