


Table of Contents
Table of Contents
Network monitoring and alerting is basically your backstage pass to watch over the hustles of network traffic, device connectivity, and overall network performance. It's like having a backstage crew making sure the show goes on without a hitch. Because let's face it, in today's web of complexities and massive networks, trying to oversee everything manually is like signing up for a marathon without your running shoes.
Network monitor alerts lay the groundwork for smooth IT operations and cyber resilience. By constantly monitoring the health and performance of your network infrastructure and applications, these Network Monitoring tools step up and shoot out alerts when certain thresholds are crossed or specific events go down. It's all about a heads-up game, so your team can swoop in, take charge, and keep disruptions to a minimum.
Understanding Network Monitoring Alerts 
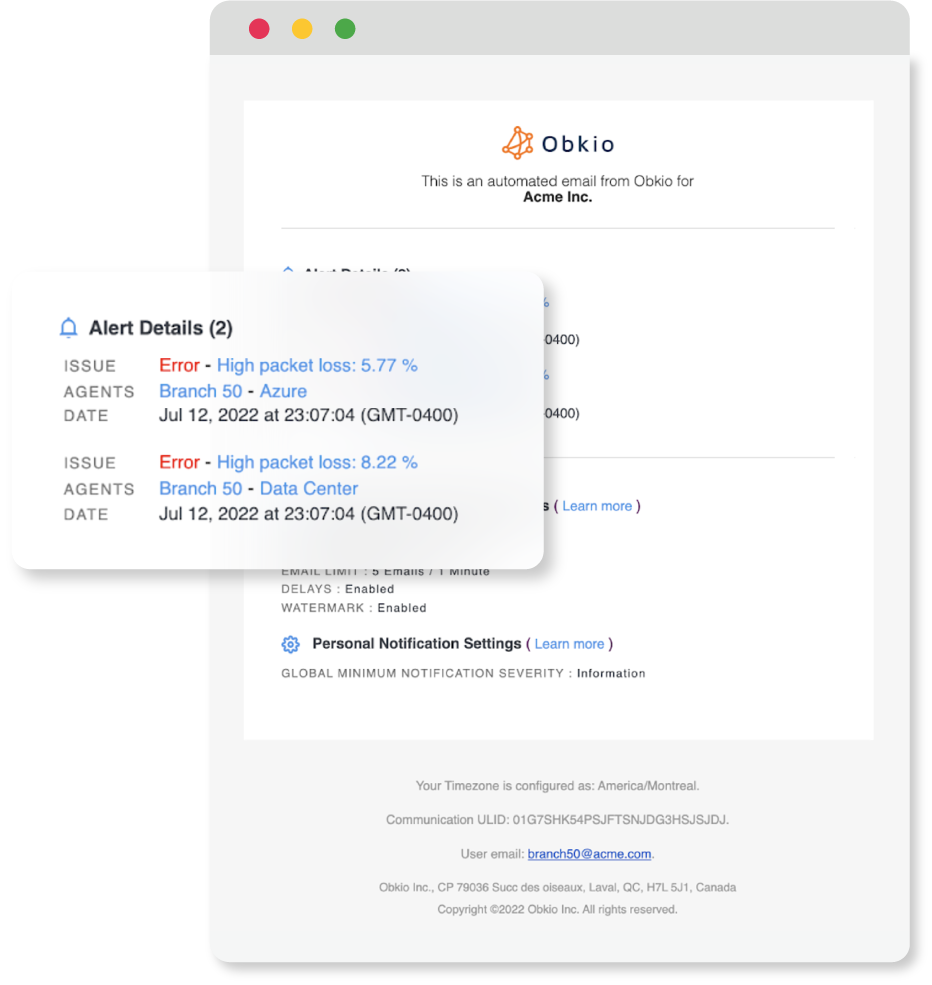
Network Monitoring Alerts act as guardians for your network, continuously examining nodes to look for performance or health anomalies that are greater than predetermined thresholds. When abnormalities are detected, these real-time alerts send out notifications via text, email, or other channels that are set up, so that the designated network admins are informed in a timely manner.
Consider this scenario: when a network admin establishes a bandwidth usage cap of 80% for a crucial interface, an alert will be triggered once the usage surpasses this predetermined threshold. Likewise, if the CPU utilization breaches the 80% limit, an alert will be generated, prompting an investigation into the device or application responsible for the increased memory usage.
Benefits of Effective Network Monitoring Alerts
It is impossible to overestimate the importance of real-time network monitoring alerts. They serve as a crucial component in preserving the optimal performance and high availability for your network, and the related services and applications.
Let's explore some of the key benefits an effective network monitoring and alerting can offer:
- Proactive Problem Identification: Establishing predefined thresholds and triggers enables you to promptly receive alerts when specific metrics veer off their usual course. This proactive strategy empowers you to tackle issues in their early stages, mitigating potential disruptions to your network and users.
- Efficient Resource Management: Utilizing thorough monitoring, alerts play a key role in streamlining resource allocation. As a network administrator, this means you're not tethered to constant application oversight. Instead, you can redirect your focus to other critical responsibilities and only re-engage with your network when a notification signals a specific need for your attention.
- Enhancing Compliance: Real-time alerts are instrumental in achieving, and frequently surpassing, the benchmarks set forth in SLAs. These alerts act as a proactive safeguard, enabling swift responses to potential issues, thereby upholding the commitments outlined in SLAs and fortifying the overall reliability of your services.
- Elevating Client Satisfaction: Alert management not only empowers you to set distinctive baselines but also ensures that you are informed about issues before they reach your customers. This proactive approach is a definite win for an MSP, as it allows for preemptive problem resolution before your clients even notice any changes.
- Know Your Network Inside-Out: You can go into a meeting with client prepared to talk about the network's performance after a month or a quarter of diligent network monitoring. Thanks to network alerts, this offers a chance to reveal information that might not match the client's perceptions. These differences give MSPs important information that helps them do their jobs more effectively and improve the effectiveness of their services.

Case study: Positive Impact of Network Monitoring and Alerting for MSPs
Amplisys functions as an MSP offering resilient VoIP and IP telephony solutions to small and medium-sized enterprises. Leveraging their proficiency in VoIP and network technologies, Amplisys recognized the critical dependence of VoIP on impeccable network performance. Motivated to enhance customer support in the face of network challenges impacting VoIP quality, they looked for effective solutions.
Prior to implementing Obkio’s Network Monitor Alert Software, the Amplisys team depended on feedback from customers to inform them about VoIP performance issues. Clients would communicate with their ISPs, who might attribute the problem to external factors, initiating a prolonged process of back-and-forth to pinpoint whether the issue stemmed from internet problems, the network, firewalls, or other potential sources.
They therefore required complete visibility and real-time monitoring alerts over their customers' networks in order to detect and resolve issues impacting their VoIP services.
By deploying Obkio Monitoring Agents for each client, Amplisys now maintains comprehensive end-to-end visibility, enabling proactive identification and troubleshooting of performance issues. This strategic implementation allows them to address concerns even before customers report them.
This underscores the importance of employing a tool that consistently observes your network's performance, alerting you to issues as they arise or when intermittent network issues resurface. A reliable and continuous network monitoring solution, such as Obkio Network Monitoring Software, is essential for this purpose.
- 14-day free trial of all premium features
- Deploy in just 10 minutes
- Monitor performance in all key network locations
- Measure real-time network metrics
- Identify and troubleshoot live network problems


Additionally, through the intuitive dashboards and automatic alerts provided by Obkio for network issues, Amplisys gains a holistic overview, pinpointing which clients are encountering performance challenges and delving into the specifics of these issues.
Obkio facilitates the streamlining of Amplisys' VoIP monitoring process, automating it continuously and eliminating the need for additional resources or on-site technician visits.
The full case study is available on our website: VoIP Service Provider and Titanium 3CX Partner, Amplisys, uses Obkio to Monitor End-User Network Performance
Common Challenges with Network Monitoring Alerts
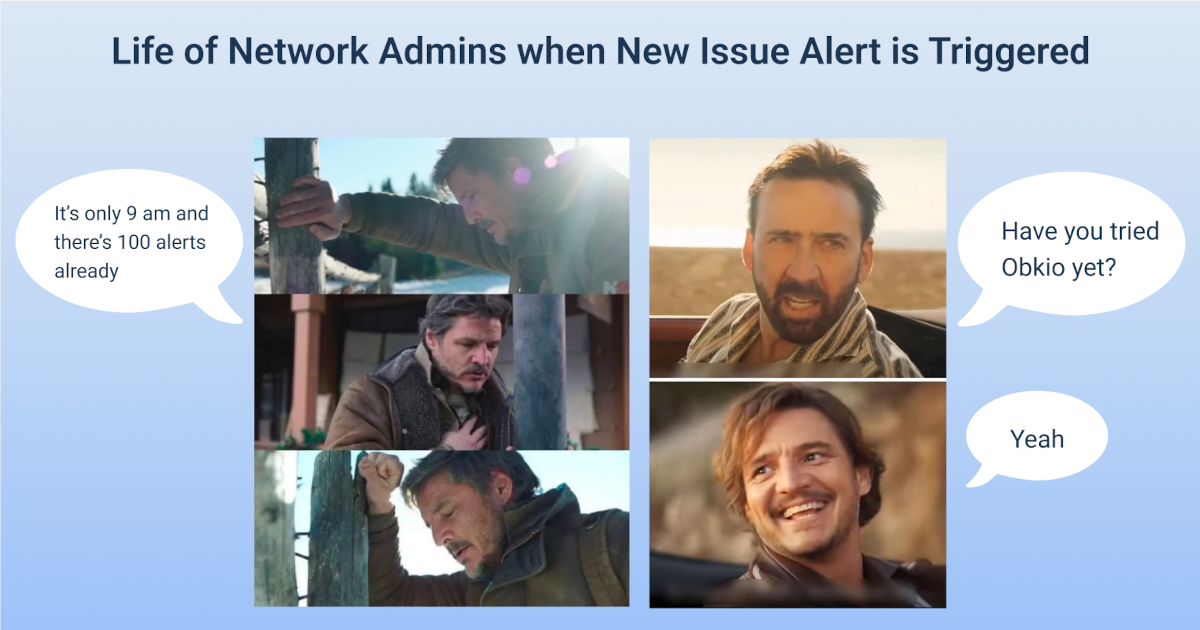
One of the primary hurdles in managing network monitoring alerts stems from the sheer volume of notifications striking network admins in modern IT environments. The diverse array of devices and systems, including firewalls, intrusion detection systems, servers, and applications, can generate up to millions of network monitor email alerts daily. However, a significant portion of these notifications proves to be redundant, irrelevant, or indicative of minor issues that don't demand immediate attention.
Network Monitor Alert Fatigue
This abundance of network monitoring alerts often leads to the phenomenon of "alert fatigue," where an admin begins to overlook or dismiss notifications due to the overwhelming volume. Unfortunately, critical alerts can get lost in this chaos, allowing major problems to slip through undetected. The consequences are severe: wasted IT resources, an increased mean-time-to-resolution for significant incidents, and heightened vulnerability to outages and breaches.
A fundamental principle guiding the effective use of network monitoring alerts is that they must be actionable. If there isn't a specific action for a network admin to take, it shouldn't trigger an alarm. It's crucial to monitor only what is relevant and important. Despite the myriad metrics a router may have, the focus should be on actionable data.
Different tools may require varying levels of tuning, but the key is to avoid drowning in unnecessary information. Failing to adhere to this principle results in alarm fatigue, with IT teams starting to disregard alerts altogether.
Wrong Network Thresholds
Another persistent challenge often occur when thresholds are improperly set, network monitoring polling periods are inadequately established, or action policies are flawed. A network monitor alert software that polls too frequently or is overly sensitive can create a flood of alerts, especially during inconvenient times like the middle of the night. It also goes the other way, if data isn't tracked frequently enough, you may miss out on identifying potential issues.
Network Monitor Alert Storms
The detrimental impact of alert storms is akin to alert fatigue, where multiple network monitor alerts are triggered for a single event. For instance, if a critical device like a gateway goes down, and numerous dependent devices subsequently send out alerts, it results in an alert storm. Event grouping is the antidote, ensuring that alerts are only issued for the central device that caused the connection disruption.
All these challenges not only overwhelm IT teams but also increase the likelihood of essential alerts being ignored. In such scenarios, network admins may fail to respond promptly when a genuine threat emerges at the network's doorstep. Addressing these challenges requires a strategic approach to network monitoring alerts and a fine-tuned understanding of your objectives and most relevant metrics.
Case Study: Impact of Wrong Thresholds on Network Monitoring Alerts for MSPs
For more than three decades, Station 22 has provided an extensive array of products to grocery stores, convenience stores, and liquor stores. Their offerings include imported wines from diverse countries, table wines, and ready-to-drink beverages. Every product they offer is accompanied by a commitment to delivering value to wine consumers worldwide.
They started receiving numerous calls from remote users reporting issues with VPN slowness and disconnections. This situation was confusing them because all of their network monitoring tools showed positive status indicators, and the firewall user interface's CPU metrics graph displayed only 40% usage.
The 40% threshold had been set by their previous monitoring system, which operated on 5-minute polling intervals. This extended interval meant there were more periods during which they weren't actively monitoring, resulting in less accurate outcomes.
Through the implementation of Obkio's Network Device Monitoring feature on the firewall, employing SNMP polling at 30-second intervals, they gained the ability to observe the Max CPU Usage of each core individually. The 30-second polling frequency delivers metrics with ten times more detail compared to the industry standard 5-minute polling interval.
The implementation of Obkio enabled Station 22 to swiftly identify a significantly underestimated issue on their firewall that, in reality, was impacting the network performance of all their remote users. If left undetected, this problem had the potential to cause enduring harm to their business.
The full case study is available on our website: Station 22 Network Performance Monitoring
Defining Your Network Monitoring Alert Objectives
Every alert carries distinct significance. For example, certain alerts may focus on monitoring critical file changes or OS logins. It's imperative to comprehend your objectives thoroughly before configuring monitoring alerts to achieve the best fit.
The initial phase in outlining your network monitoring and alerting objectives involves pinpointing your goals and priorities. Reflect on the following:
Key Business Objectives:
- How do your network monitoring and alerting initiatives align with broader business goals?
- Examples may include network uptime monitoring, elevating user experience, or optimizing resource allocation.
Critical Applications and Services:
- Which applications and services are indispensable to your organization's operations?
- This could encompass customer-facing applications, communication platforms, or mission-critical systems. Grasping their performance requirements is pivotal for setting effective network monitoring alerts.
Performance Expectations:
- What performance levels do you aspire to achieve for your network?
- This might encompass metrics such as response times, throughput, network availability, or error rates. Establishing clear performance expectations aids in defining thresholds and triggers for network alerting and monitoring purposes.
Compliance and Security Requirements:
- Are there specific compliance regulations or security standards applicable to your industry?
- Identify the necessary monitoring capabilities to meet these requirements and ensure the integrity and confidentiality of your network data. Prompt for network monitoring and alerting tools that allow you to tune your operations to required standard.

Learn how to measure network performance with key network metrics like throughput, latency, packet loss, jitter, packet reordering and more!
Learn moreHow to Set Effective Thresholds and Network Monitoring Alerts
Achieving an effective network baseline for network performance monitoring requires a meticulous approach. Follow these optimization tips to ensure a robust foundation for monitoring:
Extended Observation Period: Monitor network activity consistently for 2–4 weeks, capturing a comprehensive dataset of key performance indicators.
Thorough Traffic Analysis: Analyze traffic patterns, loads, and events during this period to identify peaks, valleys, and emerging trends.
Metric Threshold Definition: Establish clear acceptable ranges for each metric, defining upper and lower thresholds to delineate normal performance.
Granular Variance Identification: Identify baseline variances based on diverse parameters such as location, application, role, and other relevant factors.
Baseline Data Storage: Store baseline data systematically, facilitating seamless comparisons with future periods for accurate performance evaluation.
Regular Review and Update: Conduct quarterly reviews and updates of baselines to accommodate network growth and adapt to changes in the network environment.
Integration with Alerting Rules: Integrate baselines into alerting rules to enhance anomaly detection accuracy, ensuring timely identification of deviations from established norms. These tips collectively contribute to the establishment of a robust baseline, enabling effective and proactive network monitoring.
Prior to defining thresholds, gain a comprehensive understanding of your system's normal behavior. This involves meticulously collecting baseline performance data over time to establish what is considered the norm.
Metrics gathered in the process of creating a baseline could include:
- Peak and average network traffic as well as bandwidth use.
- Number of sessions and connections running concurrently.
- Critical application, bandwidth, latency, and jitter metrics.
- Key system CPU, memory, and storage utilization.
- Essential services' responsiveness and uptime.
- Types and frequency of generated alerts and events.
Defining thresholds and alerts is a key element in proactively monitoring network performance and identifying anomalies. Follow these steps:
1. Determine Threshold Values:
- Establish threshold values for critical metrics based on your performance expectations and objectives.
- Metrics like latency, packet loss, throughput, jitter, CPU usage, or other key indicators should have defined upper or lower limits beyond which an alert is triggered.
2. Configure Alerting Mechanisms:
- Select suitable alerting mechanisms for your network monitoring dashboard.
- Options may include email notifications, SMS alerts, or integration with incident management or ticketing systems.
- Ensure alerts swiftly reach the relevant stakeholders upon breaching thresholds.
3. Prioritize and Fine-Tune Alerts:
- Prioritize alerts based on severity and their impact on network performance.
- Fine-tune alert conditions and thresholds to minimize instances of false positives or false negatives.
- Regularly review and refine alerting rules to align with evolving network conditions and changing performance requirements.
Apply anomaly detection and get alerts when there are deviations from the baseline behaviour. The idea is straightforward: an alert is sent out if the current observation for a certain metric on this device, at this time, on this precise day of the week, deviates from the expected pattern.
With this dynamic approach, baseline models are automatically updated in response to changes in normal behavior and the evolving structure of your network. As a result, your threshold and alert configurations continue to be relevant over time.

Choosing the Right Network Monitoring and Alerting Tool
According to several reports from Network Computing, almost 25% of large enterprises utilize 8 or more diverse network management tools that cater to networks performance, cloud applications, servers, log data, and other components.
Even managed service providers are not immune to this issue, grappling with tool sprawl and utilizing an average of 10 different tools. Regrettably, employing multiple tools gives rise to numerous challenges, including operational silos, inadequate end-to-end visibility, extended average resolution times, and the financial burden associated with acquiring multiple licenses.
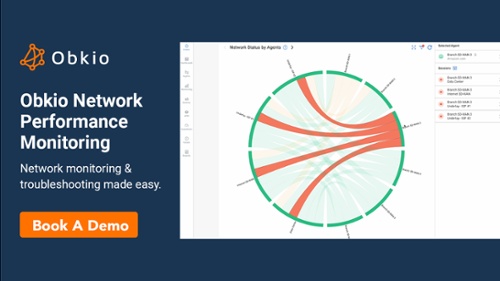
Unlike traditional tools, Obkio's Network Monitoring software employs a holistic end-to-end (from WAN to LAN) approach to network performance monitoring, solidifying its position as the top choice for effective network monitoring and alerting.
Gain a 360-degree view of network performance and application connections with Obkio’s network monitoring and alerting tools to identify issues that were previously beyond your visibility.

Obkio goes far deeper than surface-level insights, delving into the intricacies of network performance to pinpoint issues accurately. This precision ensures that the right people receive the right notifications, streamlining the alerting and troubleshooting processes.
Enjoy streamlined network admin’s work with ready-made or customizable graphs and dashboards. These tools allow you to instantly visualize the interactions among all your apps and services after receiving a network alarm. No longer confined to navigating through tables, you can now grasp the current state of affairs at a glance and troubleshoot the issues swiftly.
With Obkio you can see the complete picture of your network performance at any time, all the time, and in real time!
Organizing Network Monitoring Alerts & Thresholds Effectively
In the dynamic landscape of network monitoring and alerting, effective organization of alerts and thresholds is paramount for swift issue resolution. Obkio offers a wide range of customization options that you can easily tailor to your needs.
Network Monitoring Alerts Threshold Presets
To streamline threshold configuration, three preset threshold options are at your disposal. While these presets align with the typical use cases of the majority of our customers, custom thresholds remain an option for further customization. The available presets are:
- High Sensitivity
- Medium Sensitivity (default)
- Low Sensitivity
The sensitivity level of the thresholds correlates with their likelihood to trigger a Network Issue in the App, especially when metric measurements deviate from the established historical baseline.
Three characteristics of the connection between the agents must be taken into consideration while choosing the thresholds:
- Importance
- Medium
- Stability
A High Sensitivity preset is better suited for a reliable and significant link between two agents. Most likely, this connection is made over a particularly reliable media, like an internal network with a large capacity or fiber WAN.
On the other hand, a Low Sensitivity preset is better suited for a broadband Internet connection that is located distant from a city (like regional DSL) in order to prevent notifications from being sent whenever a little incident takes place.
Examples of Use:
- High sensitivity – Data Centers, Private Clouds, Head Offices, High-capacity Fiber Lines;
- Medium sensitivity – Private MPLS (FTTH/FTTB, High-Speed Cable/Coax) Stable Broadband Internet Connections;
- Low sensitivity – Copper/DSL, Satellite, Unstable connections.
Threshold Preset Values
Here are the thresholds corresponding to the different presets. For a detailed understanding of how these values are applied, please refer to the Custom Settings page.
High Sensitivity Thresholds
- Session Timeout: 10 seconds
- Packet Loss Warning / Error: 1 / 3%
- Latency Warning: 25% increase (minimum difference of 25 ms)
- Latency Error: 50% increase (minimum difference of 50 ms)
- Jitter Warning: 25% increase (minimum difference of 25 ms)
- Jitter Error: 50% increase (minimum difference of 50 ms)
Medium Sensitivity Thresholds
- Session Timeout: 30 seconds
- Packet Loss Warning / Error: 2 / 5%
- Latency Warning: 50% increase (minimum difference of 50 ms)
- Latency Error: 100% increase (minimum difference of 100 ms)
- Jitter Warning: 40% increase (minimum difference of 40 ms)
- Jitter Error: 80% increase (minimum difference of 80 ms)
Low Sensitivity Thresholds
- Session Timeout: 60 seconds
- Packet Loss Warning / Error: 2 / 10%
- Latency Warning: 75% increase (minimum difference of 75 ms)
- Latency Error: 150% increase (minimum difference of 150 ms)
- Jitter Warning: 60% increase (minimum difference of 60 ms)
- Jitter Error: 120% increase (minimum difference of 120 ms)
Network Monitoring Alert Delays, Limits, and Summary
With Obkio, you have the flexibility to receive notifications through various channels, including email, Slack, and Teams. Also, you can configure delays before dispatching notifications to the user.
For instance, the default setting dictates that a notification with a severity level of error will undergo a 2-minute delay before being transmitted to the user. If, within this timeframe, the issue is resolved, the notification is withheld.
Additionally, the notification limit serves to cap the number of emails received within a specified period (e.g., no more than 1 email in a 5-minute window). Upon reaching this limit, notifications are queued and dispatched as a summary after the designated window delay.
Network Monitoring Alert Severity Levels
Notification Severity Levels hold significance as they influence notification delays, allowing for the prioritization of the most critical network issues. It's essential to recognize that not all alarms require immediate attention. By customizing thresholds based on severity, you can effectively manage and prioritize delays, ensuring that the most important network issues are addressed promptly.
A severity level is assigned to each triggered event, and the notification generated is contingent on these severity levels. Here is the list of possible severity levels:
- Ok (level 0)
- Information (level 1)
- Warning (level 2)
- Error (level 3)
- Critical (level 4)
Low Severity
Alerts with low severity are generated and documented in the monitoring system to provide context for potential troubleshooting in the future. They serve the purpose of recording changes in performance, unusual events, and deviations from the baseline. However, these network monitor alerts do not actively notify you of these occurrences.
Medium Severity
Medium severity network monitoring alerts act as a preemptive warning, offering a heads-up without demanding immediate attention. They provide an opportunity to act early and mitigate potential issues before they escalate to high severity alerts. For instance, these alerts may include prolonged increases in CPU usage, disk UI, or network traffic over hours or days. They could also notify you about impending issues, such as disk space running out in several days or weeks.
High Severity
Critical alerts represent the worst-case scenario, necessitating an urgent response. These network monitor alerts signal that it's too late for preemptive measures, and immediate action is required to rectify the issue(s). Any alerts related to resources with limited capacity (e.g., low disk space, nearly full queues) fall into this category. Service-level alerts that significantly impact users also belong to the high severity level, demanding prompt attention.

Learn how to build an effective network monitoring dashboard with this comprehensive guide. From design to automation, optimize your network performance.
Learn moreConclusion: The Power of Network Monitoring Alerts
The foundation of smooth IT operations and cyber resilience lies in effective network monitoring alerting, with tools continuously overseeing network health and performance. Real-time alerts act as guardians, promptly notifying designated network administrators when anomalies surpass predefined thresholds.
While challenges such as alert fatigue, wrong network thresholds, and alert storms exist, a strategic approach, fine-tuned understanding, and the right tools, such as Obkio's Network Monitoring, can address these issues effectively.
- 14-day free trial of all premium features
- Deploy in just 10 minutes
- Monitor performance in all key network locations
- Measure real-time network metrics
- Identify and troubleshoot live network problems
Don't miss the opportunity to enhance your network management –
