Table of Contents
Table of Contents
Are you ready to embark on a journey of network discovery and device monitoring? Or are you feeling overwhelmed and lost in a sea of network cables and devices? Fear not, my fellow explorer, for we are about to embark on a quest to master the art of network device monitoring!
Whether you're a seasoned IT pro or a curious newbie, this beginner's guide will take you by the hand and lead you through the maze of network devices, protocols, and monitoring tools. So, put on your explorer hat, grab your map, and let's venture forth into the world of network device monitoring to identify and troubleshoot performance issues!
Network Device Monitoring is the practice of monitoring the resources, usage states and availability of networking devices such as firewalls, routers, switches and wifi access points. It is a crucial part of Network Monitoring and helps you understand the root cause of performance issues in your network.
Network devices and equipment are prone to problems like high CPU usage and high bandwidth usage. Network Device Monitoring helps you identify those issues so that you can understand if you need to:
- Look into what traffic is going through your network
- Increase your Internet bandwidth
- Update your network device firmware
- Or even upgrade your network infrastructure altogether
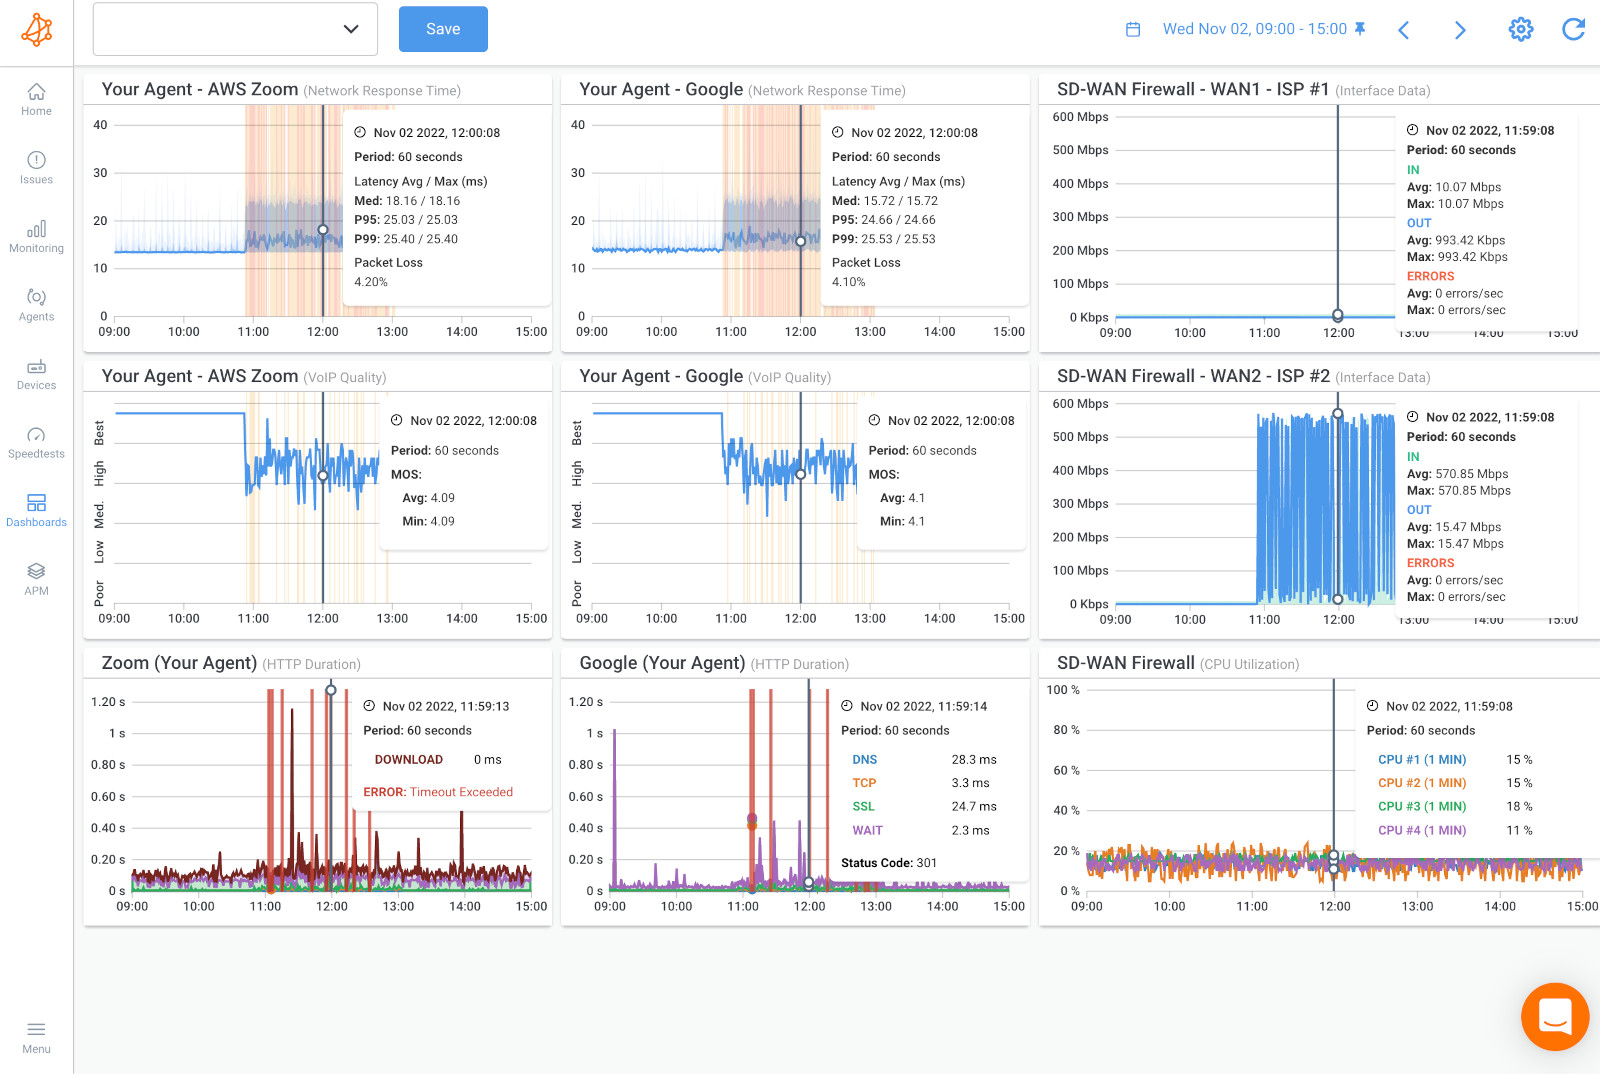

Network device monitoring is a crucial part of monitoring and optimizing your network performance. Firewalls, routers, switches and wifi access points can experience problems like congestion, high bandwidth and CPU usage that can affect your network and user experience.
- Early Detection of Issues: Network device monitoring can help you detect issues early on, before they become major problems that impact your network and user experience.
- Improved Network Performance: By monitoring your network devices, you can identify and fix issues that may be affecting your network performance, such as congestion, bandwidth and CPU usage, and other bottlenecks.
- Better Network Security: Monitoring your network devices can also help you identify potential security threats and vulnerabilities, allowing you to take action to prevent attacks and protect your network.
- Cost Savings: By monitoring your network devices, you can identify inefficiencies and areas for improvement, which can help you save money by reducing downtime, optimizing network performance, and avoiding unnecessary hardware and software upgrades.
- Enhanced User Experience: When your network devices are running smoothly, your users can enjoy a seamless and reliable experience, which can lead to increased productivity and satisfaction.
Overall, network device monitoring is an essential part of maintaining a healthy and efficient network, and can help you improve performance, security, and user experience, while also saving time and money in the long run.

The biggest problem with the traditional network device monitoring tools, which many of us have been using since forever, is their overwhelming alert systems.
In a large network, with many network devices, traditional device monitoring systems will flood you with alerts for every small event. And we all know that, too many alerts is often equivalent to no alerts.
No company has enough staff to watch hundreds of notifications come in everyday. So in this situation, everyone does the same thing. They create a folder in their emails where they automatically forward the notification emails and never look at them again.
Now, network events that are moved and forgotten in a folder are no longer an alert system - they’re a log system. The problem with such a system is that we lose real-time visibility on event management. That’s when we start relying on our users to flag issues, and only react when the problem has already affected user experience.
Here’s how to overcome that:
Imagine a world where your network devices can talk to you, telling you exactly what's going on under the hood. Well, that world exists, and it's called NPM (Network Performance Monitoring) Tools! With these tools, you can monitor your network devices like a boss, identifying issues before they become problems and keeping your network running like a well-oiled machine.
So, grab your coffee and buckle up, because we're about to show you how to use NPM tools to become the ultimate network monitoring ninja!
Instead of traditional tools, the new generation of Network Device Monitoring tools, like Obkio Network Performance Monitoring software, use Network Performance Monitoring features to alert you about problems in your network, and your network devices, as soon as your network performance starts to degrade.
That means that you only get the alerts that matter, when they matter.
The Network Device Monitoring feature inside of Obkio’s Network Monitoring Software is the a key tool for troubleshooting performance issues.
Is a fast and easy solution to get detailed information about the performance of your core network devices to quickly and proactively pinpoint and troubleshoot network device issues like congestion, high CPU and interface errors.

Many Network Device Monitoring tools, like Obkio, use SNMP within their Network Device Monitoring features.
SNMP or “Simple Network Management Protocol” is an Internet Standard protocol which is used to monitor and manage network devices connected over an IP address. It is a method of monitoring network devices that allows you to gather information about their performance, status, and other metrics.
The first SNMP standard, called RFC, was published in May 1990 and has evolved since then. There are now other telemetry protocols that exist, but SNMP remains the standard protocol supported by the majority of network equipment.
SNMP polling is a technique used in network device monitoring that involves querying network devices using the Simple Network Management Protocol (SNMP) to collect performance and status information. SNMP is a standard protocol used to manage and monitor network devices such as routers, switches, servers, and printers.
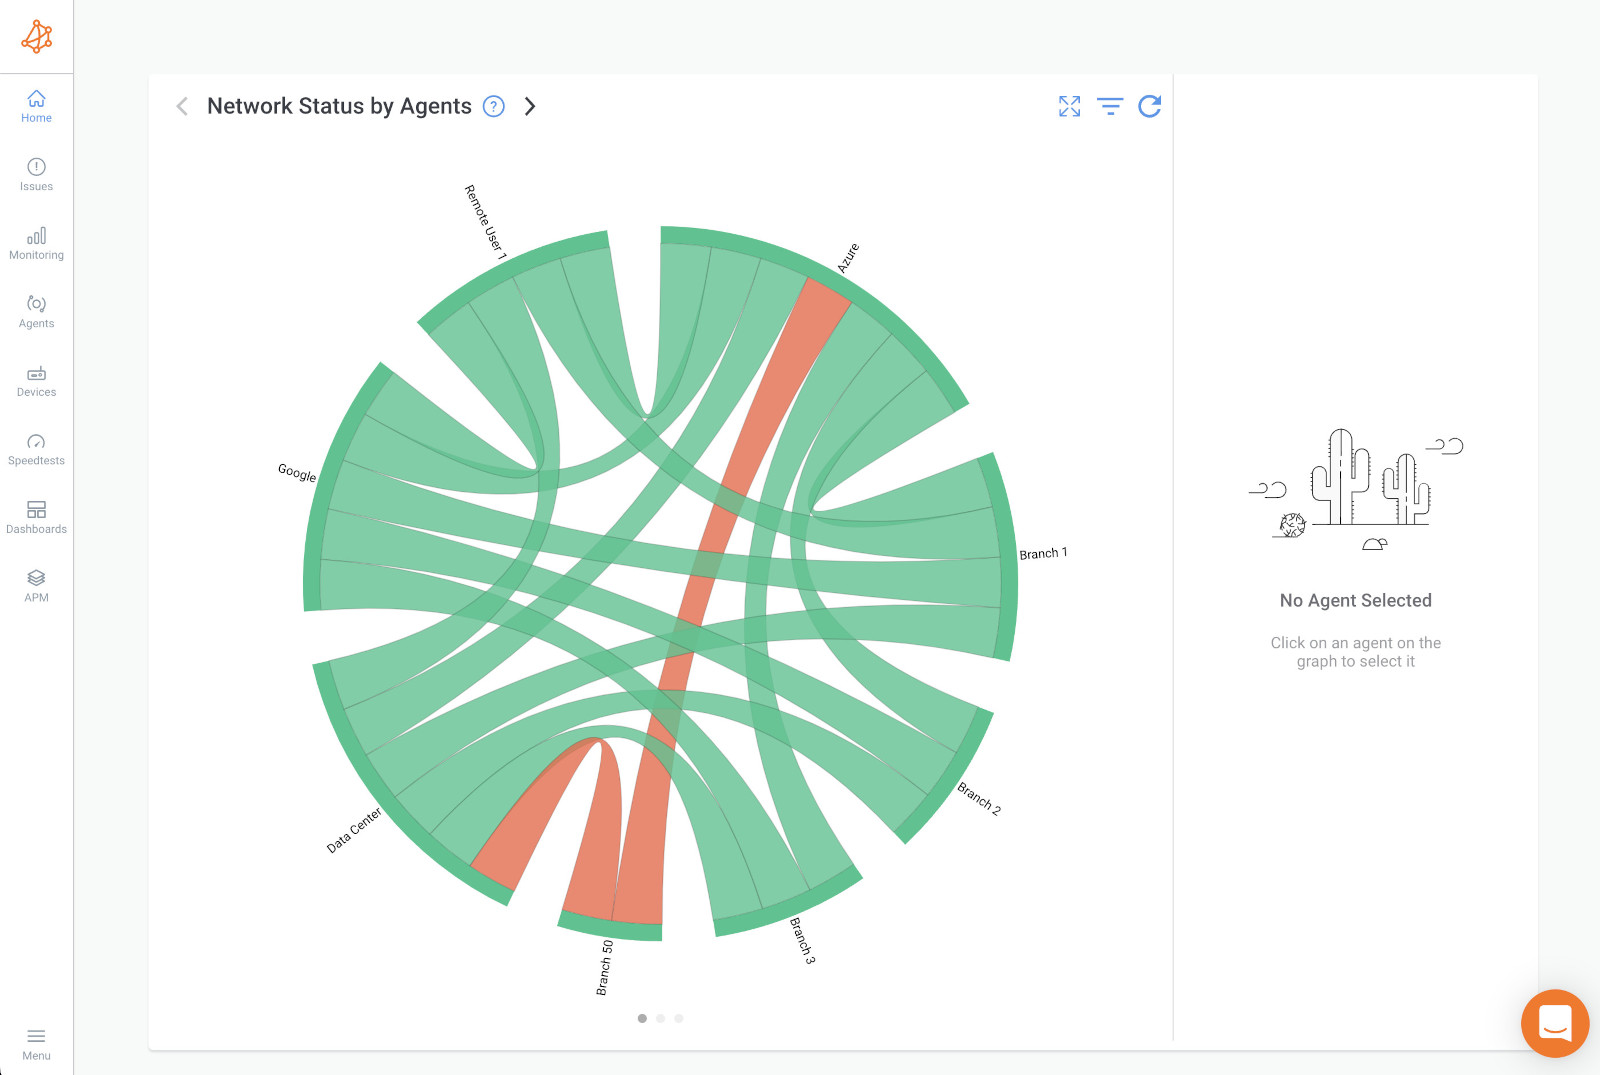
SNMP polling can provide a range of benefits for network device monitoring, including:
- Performance monitoring: SNMP polling can provide insights into network device performance and utilization, allowing administrators to identify performance bottlenecks and optimize network configurations.
- Fault detection: SNMP polling can detect faults in network devices, such as interface errors, high CPU usage, and low memory, before they lead to downtime or disruptions.
- Inventory management: SNMP polling can be used to maintain an inventory of network devices, and provide information such as device type, firmware version, and serial number.
- Capacity planning: SNMP polling can help administrators plan for future network capacity needs by identifying trends in network device usage and predicting when additional capacity may be needed.
Overall, SNMP polling is an important technique for network device monitoring, providing administrators with a powerful tool for monitoring network device performance and status. However, it should be used in conjunction with other network monitoring techniques, such as performance monitoring or packet capture, to ensure comprehensive network device monitoring.
SNMP polling involves sending SNMP requests, called SNMP "GET" requests, to network devices to collect information such as CPU usage, memory usage, network traffic, and interface status. The SNMP "GET" requests are sent to a specific OID (Object Identifier) on the network device, which contains the information being requested.
SNMP polling is typically performed by an SNMP manager, such as a network management tool or a monitoring system. The SNMP manager sends SNMP "GET" requests at regular intervals, such as every five minutes, to collect information from network devices.
Here's how it works with Obkio:
- Obkio's Network Performance Monitoring tool sends an SNMP request to a device, asking it to provide information about a specific metric, such as CPU usage, bandwidth utilization, or uptime.
- The device receives the request and responds with the requested information, which is sent back to Obkio.
- Obkio's app collects the information from the device and stores it in a database, where it can be used for analysis and reporting.
- Obkio can then use this information to identify issues, troubleshoot problems, and optimize the performance of the network and its devices.
SNMP Polling typically operates on a scheduled basis. Obkio sends requests to devices at regular intervals (e.g. every 30 seconds ), and collects the responses over time to create a historical record of performance metrics. This allows you to track changes over time and identify trends that may indicate potential issues or opportunities for optimization.
Learn about what SNMP monitoring is & how to use it to monitor performance of networking devices like firewalls, routers, switches and wifi access points.
Learn more

With Obkio, you don’t need to establish VPNs between a centralized monitoring server and the LANs where the network devices are located because all the SNMP polling is already done by Obkio’s Monitoring Agents.
Before monitoring your network devices, you need to deploy at least one Monitoring Agent.
Monitoring Agents are a unique software developed by Obkio to monitor network performance in key network locations (data centers, branch offices, clouds etc.). They continuously exchange synthetic traffic in your network to measure performance using key network metrics, and identify performance issues.
You need a Monitoring Agent deployed so that it can communicate with your network device to measure performance. We always recommend using the Agent closest to the device you want to monitor.
Once you’ve installed your monitoring agents, you can then start monitoring your network devices using SNMP by adding the devices inside the Obkio App.
The device must support SNMP. Obkio supports all versions of SNMP (v1, v2c and v3) and of course, a read-only access is needed. Learn more about the supported devices here.
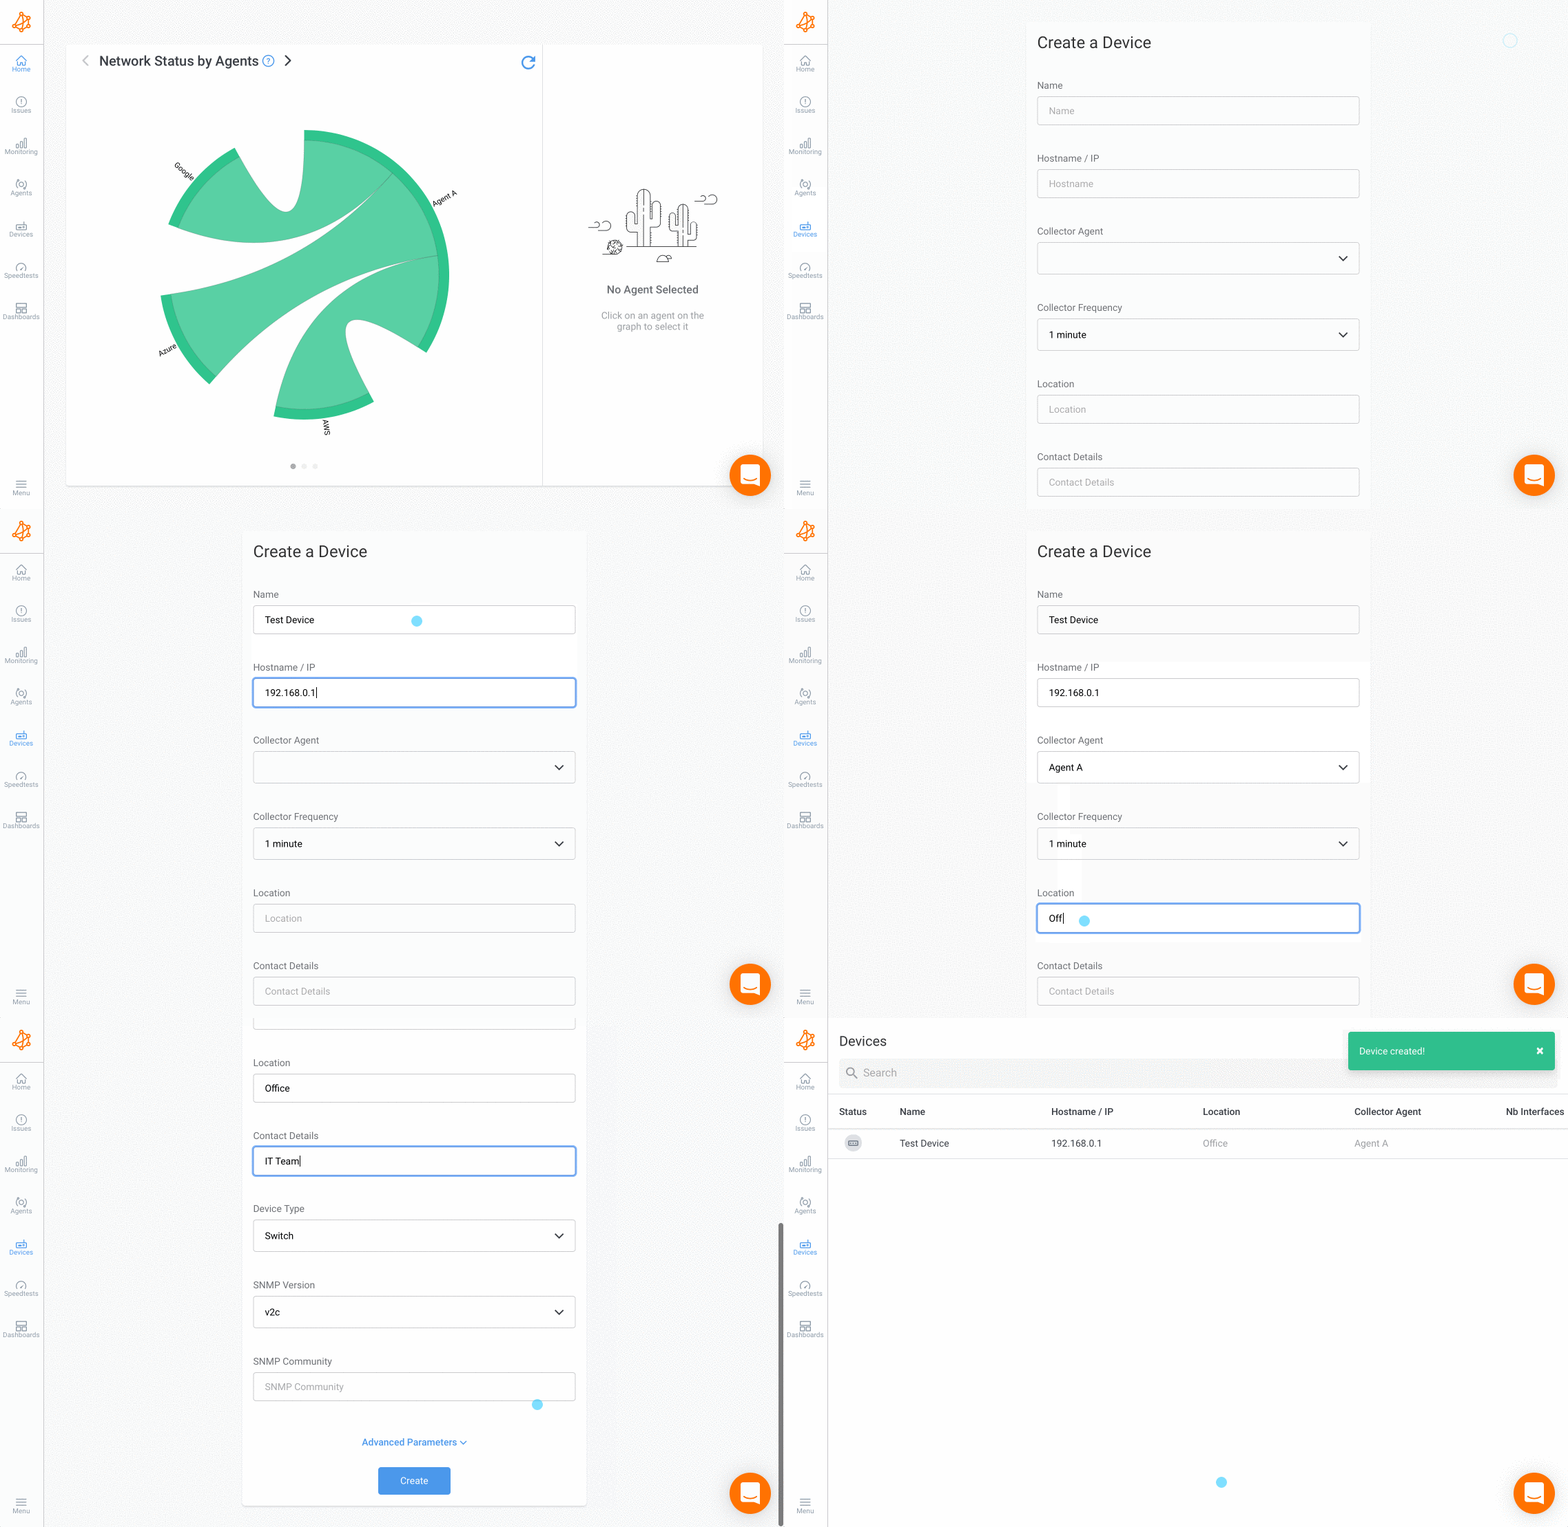
No technical expertise in SNMP and OID Detection is required. Once you add your devices, Obkio’s network device monitoring feature adapts to any time of equipment.
For example, whether you’re using a Meraki router, Cisco, Fortinet or SonicWall - Obkio will collect the appropriate information for that equipment in order to monitor the device and identify performance issues.
Basically, you should monitor all critical network devices with network device monitoring. This typically includes:
- Routers: Routers are devices that connect two or more networks together and route data packets between them. They typically operate at the network layer of the OSI model and use routing tables to determine the best path for data to travel.
- Switches: Network Switches are devices that connect multiple devices on a network and allow them to communicate with each other. They typically operate at the data link layer of the OSI model and use MAC addresses to forward data packets between devices.
- Firewalls: Firewalls are devices that protect a network from unauthorized access by filtering incoming and outgoing network traffic. They typically operate at the network layer of the OSI model and can be configured to allow or block traffic based on a variety of rules and policies.
- Load balancers: Load balancers are devices that distribute network traffic across multiple servers or devices to improve performance and ensure high availability. They typically operate at the application layer of the OSI model and use various algorithms to distribute traffic based on factors such as server load and response time.
- Wireless access points: Wireless access points are devices that provide wireless connectivity to devices on a network. They typically operate at the physical and data link layers of the OSI model and use Wi-Fi standards to transmit data over the air.
- Servers: Servers are devices that provide services or resources to other devices on a network, such as file storage, web hosting, email hosting, and database management. They can be configured to run a variety of operating systems and applications, and typically operate at multiple layers of the OSI model.
- Modems: Modems are devices that convert digital data to analog signals for transmission over a telephone or cable line, and vice versa. They are typically used to connect to the internet or other remote networks.
Once you’ve added your network devices, Obkio’s Network Device Monitoring features uses Ultra-Fast Polling (every 30 seconds) to provide results that are far more precise than the traditional software polling, which occurs every 5 minutes.
This frequency more accurately detects short bursts of traffic (packet bursts) or CPU utilization that affect network performance and identifies the root cause of the performance issue.
Traditional network monitoring software polling, which is every 5 minutes, hides the peaks that actually help in pinpointing performance issues.

Once you’ve deployed Obkio and added your network devices, Obkio will begin continuously monitoring key network device performance metrics that give you a complete overview of the health of your network deivces. Monitoring these metrics will allow you to identify any issues with your network devices.
There are many metrics that you can monitor for network device monitoring, but some of the most important ones include:
- Bandwidth Utilization: This metric measures how much of the available network bandwidth is being used at any given time. Monitoring bandwidth utilization can help you identify potential bottlenecks and plan for network capacity upgrades.
- Packet Loss: The packet loss metric measures how many data packets are lost or dropped during transmission. Monitoring packet loss can help you identify network congestion and other issues that can affect network performance.
- Latency: The latency metric measures the amount of time it takes for a data packet to travel from its source to its destination. Monitoring latency can help you identify network delays and other issues that can affect user experience.
- CPU Usage: This metric measures how much of the device's CPU capacity is being used at any given time. Monitoring CPU usage can help you identify resource-intensive processes or applications that may be impacting network performance. High CPU usage can lead to slow performance, dropped packets, and other issues that can affect the user experience.
- Bandwidth Interface Errors: This metric measures the number of errors that occur on a network interface related to bandwidth usage. It can include errors such as oversubscription, collisions, or dropped packets. Monitoring bandwidth interface errors can help you identify potential network congestion and plan for capacity upgrades or other changes.
- Interface Errors: This metric measures the number of errors that occur on a specific network interface, such as a switch port or router interface. It can include errors such as packet drops, discards, or errors related to network cables. Monitoring interface errors can help you identify potential hardware or software issues that may be impacting network performance.
- Device Availability: This metric measures the amount of time that a device is available and responsive. Monitoring device availability can help you identify potential issues with hardware or software, such as crashes or outages, and take action to prevent or resolve them.
- CRC Errors: This metric measures the number of errors that occur during the transmission of data packets. CRC errors can occur when the data packet is corrupted or modified during transmission, and can result in data loss or network congestion. Monitoring CRC errors can help you identify potential network issues related to data corruption or misconfiguration.
- Interface Duplex: This metric measures the duplex mode of a network interface, which determines how data is transmitted and received. It can be either half-duplex, where data is transmitted in both directions but not simultaneously, or full-duplex, where data can be transmitted and received simultaneously. Monitoring interface duplex can help you identify potential network issues related to misconfiguration or compatibility between devices.
- Memory Usage: This metric measures how much of the device's memory capacity is being used at any given time. Monitoring memory usage can help you identify potential memory leaks or other issues that can impact network performance.
- Uptime: This metric measures how long a device has been operational without any downtime or interruptions. Monitoring uptime can help you identify potential hardware or software issues before they cause significant problems.
- Network Traffic: This metric measures the amount of data that is transmitted and received on the network. Monitoring network traffic can help you identify trends and patterns in network usage, and plan for capacity upgrades or other changes.
These are just a few examples of the many metrics that you can monitor for network device monitoring. The specific metrics that you monitor will depend on your network infrastructure and your specific monitoring needs.
Once you’ve deployed Obkio and added your network devices, Obkio will begin continuously monitoring network device performance.
By continuously monitoring network device performance, Obkio can identify common issues related to network devices. For example, it can detect issues such as high CPU usage, excessive packet loss, interface errors, CRC errors, and other performance issues that can impact the overall health and performance of your network.
There are several common network device issues that can impact the performance and reliability of your network. Here are a few examples:
- High CPU Usage: Network devices such as routers and switches can experience high CPU usage due to resource-intensive processes or applications. This can lead to slow performance and degraded user experience.
- Interface Errors: Network interfaces such as switch ports or router interfaces can experience errors related to data transmission, such as packet drops, discards, or errors related to network cables. This can result in connectivity issues and degraded performance.
- Bandwidth Congestion: Network devices can experience network congestion or network overload due to high traffic volume, leading to slow performance and dropped packets.
- Firmware or Software Bugs: Network devices can experience bugs or issues related to their firmware or software, leading to unexpected behavior or degraded performance.
- Hardware Failure: Network devices can experience hardware failure due to age, wear and tear, or other factors, leading to network outages or degraded performance.
- Misconfigurations: Network devices can experience issues due to misconfiguration, such as incorrect routing or QoS settings, leading to connectivity issues and degraded performance.
Obkio uses this data to provide insights and alerts that can help you quickly identify and resolve network device issues. For example, it may alert you if a device is experiencing high CPU usage, which could indicate a process or application that is consuming too many resources. Or it may alert you if a device is experiencing excessive packet loss, which could indicate network congestion or other issues.
Overall, by continuously monitoring network device performance, Obkio can help you maintain the health and performance of your network, proactively identify potential issues, and take action to prevent or resolve them before they impact your users.
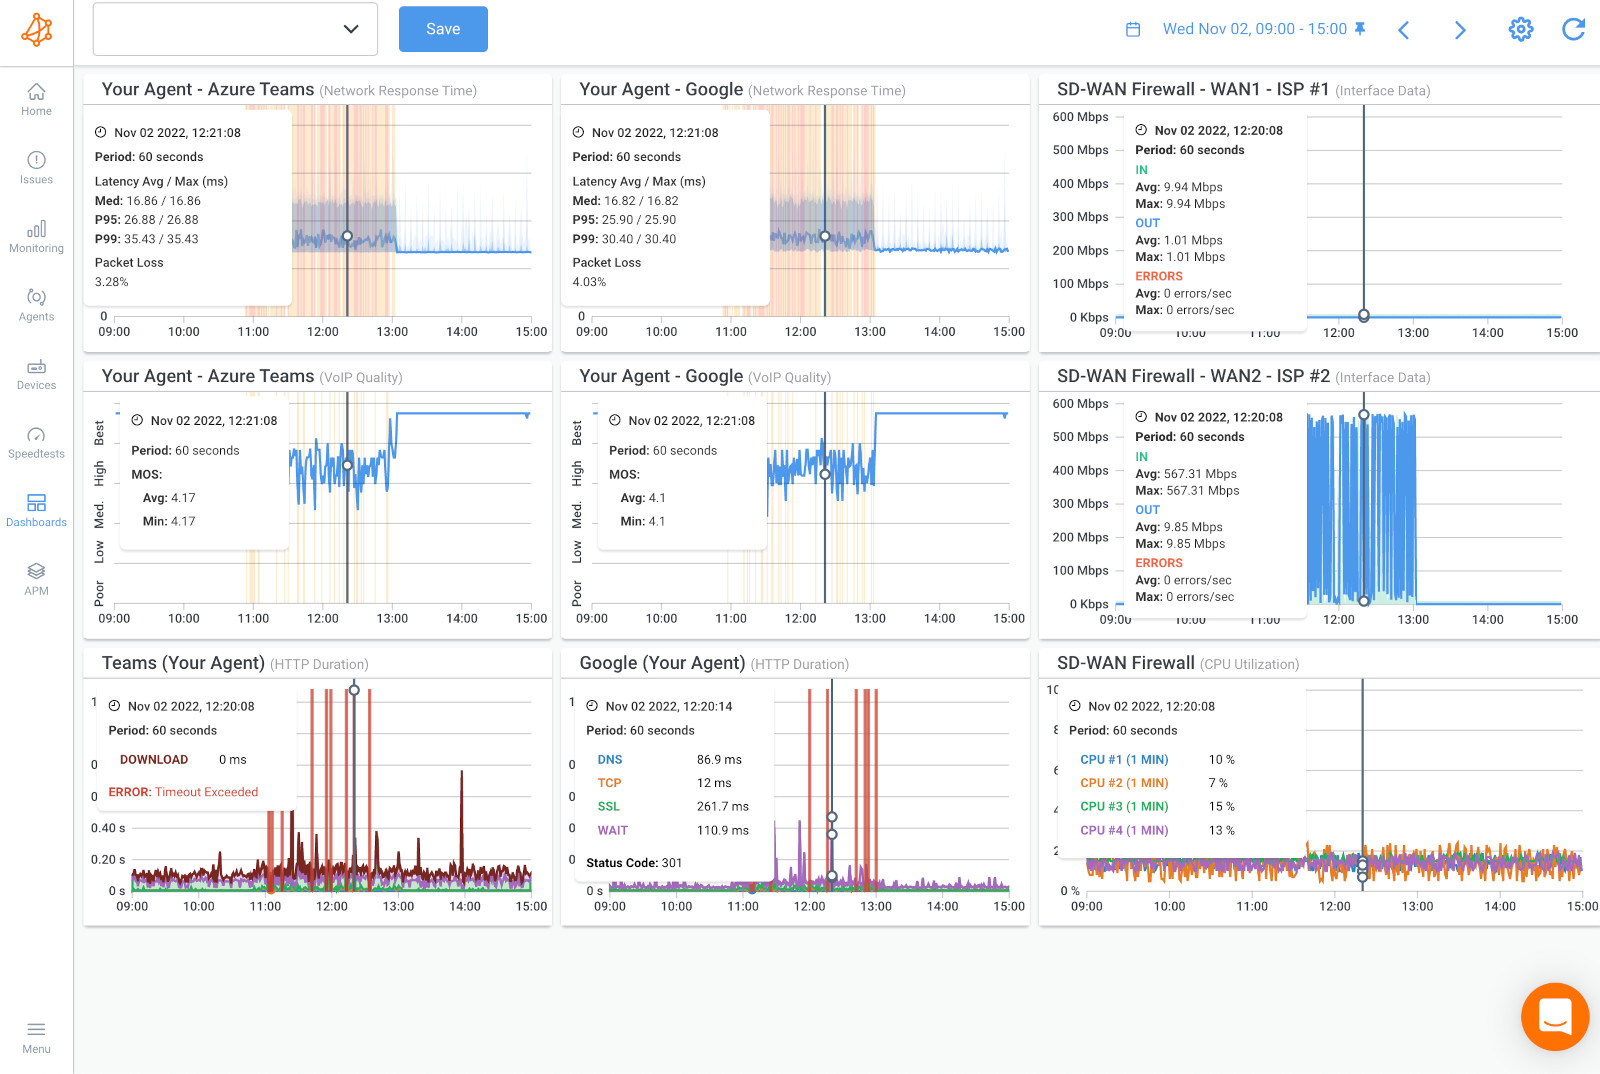

Troubleshooting network device issues can be a complex and time-consuming process - but not with Obkio! With the information you identified from Obkio's app, you now know which network devices are affected, and what issues are happening.
At this point, there are several steps you can take to identify and resolve issues. Here are some common troubleshooting steps:
- Identify the symptoms: Start by identifying the symptoms of the issue. For example, is the network slow or experiencing connectivity issues? Are there specific devices or applications that are affected? Obkio will help you gather this information and help you narrow down the root cause of the issue.
- Check the device logs: Check the logs of the affected device to see if there are any error messages or warnings that can help identify the issue. This can include log files related to device configuration, system events, or network traffic.
- Check the network topology: Review the network topology to ensure that devices are correctly configured and connected. Ensure that the network devices are properly configured with the correct IP address, subnet mask, gateway, and DNS settings.
- Check the device configurations: Check the configurations of the affected devices to ensure that they are properly configured with the correct settings, such as routing protocols, QoS settings, and access control lists (ACLs).
- Test the network: Perform network tests such as ping tests or traceroutes to identify connectivity issues or delays in the network. Obkio Vision: Visual Traceroute Tool would be your best friend for that.
If your network devices are experiencing CPU or Bandwidth issues, this likely means that the network problem is on your end and you need to troubleshoot.
Here are a few suggestions:
- Look into traffic logs: Look into the traffic going through your devices. Understand if the traffic is legitimate or not by looking at the firewall logs. Illegitimate traffic might be a security breach (data exfiltration), or mass data backup during business hours.
- Manage firewall priorities: Manage priorities in your Firewall to prioritize traffic on certain applications when passing through the network. This will reduce the impact on certain applications during periods of congestion.
- Upgrade bandwidth: Upgrade your Internet connection bandwidth with your ISP if you’re just running out of bandwidth.
- Update or Upgrade Devices: Look into your device to understand why it’s missing resources and causing high CPU usage. There may be a software problem, your device may need a firmware update, the last update may be bugged, or the device may just not have enough resources available and needs to be upgraded to a bigger device.
So we just went over how to perform Network Device Monitoring with one of the simplest tools on the market! With a tool like Obkio, you can monitor both network and device performace for a compplete end-to-end performance overview.
There are several other common techniques for network device monitoring that can help you keep your network devices and applications running smoothly. Here are a few examples:
SNMP (Simple Network Management Protocol) is a widely-used network monitoring protocol for monitoring and managing network devices, such as routers, network switches, servers, and printers. SNMP allows network administrators to remotely monitor the performance and health of network devices in real-time. Some NPM tools, like Obkio, offer SNMP Monitoring as a feature in their solution.
SNMP monitoring involves the use of SNMP agents, which are software components that run on network devices and collect information about their status, performance, and configuration. SNMP agents expose this information through a standardized set of variables, known as Management Information Bases (MIBs), which can be accessed by SNMP managers.
SNMP managers are applications that receive SNMP data from agents and analyze it to generate network monitoring alerts, reports, and network visualizations that help network administrators to identify and diagnose issues with network devices. SNMP managers can be standalone software packages or integrated into larger network management platforms.
SNMP monitoring can provide a wealth of information about network devices, including:
- Device availability and uptime: SNMP agents can report on the availability and uptime of network devices, allowing administrators to quickly identify when a device is offline or experiencing connectivity issues.
- Network traffic and bandwidth usage: SNMP can report on the amount of traffic flowing through network devices and the bandwidth utilization of network interfaces, allowing administrators to identify potential bottlenecks and optimize network performance.
- Device performance and resource utilization: SNMP can report on CPU, memory, and disk usage on network devices, allowing administrators to identify resource-intensive applications or services and optimize their configuration.
- Configuration changes and security events: SNMP can report on changes to device configuration and security events, such as failed login attempts or unauthorized access attempts, allowing administrators to quickly respond to security threats.
Overall, SNMP monitoring is an essential technique for network device monitoring, allowing administrators to proactively monitor and manage their network infrastructure to ensure high performance, reliability, and security.
NetFlow monitoring is a technique for network device monitoring that allows network administrators to collect, analyze, and visualize data about network traffic flows. NetFlow monitoring is based on the NetFlow protocol, which is a traffic monitoring protocol developed by Cisco.
NetFlow monitoring involves the use of NetFlow collectors, which are software or hardware components that receive and store NetFlow data. NetFlow data is collected from network devices, such as routers and switches, which export NetFlow data packets containing information about the traffic flowing through them.
NetFlow data includes information such as the source and destination IP addresses of the traffic (IP monitoring), the protocols used, the number of packets and bytes transferred, and the duration of each flow. NetFlow collectors can aggregate and analyze this data to provide insights into network traffic patterns, identify bandwidth hogs, and detect security threats.
NetFlow monitoring can provide a range of benefits for network device monitoring, including:
- Network traffic analysis: NetFlow data can provide detailed insights into network traffic patterns, allowing administrators to identify areas of congestion (WAN or LAN congestion), network bottlenecks, and traffic hotspots.
- Bandwidth utilization monitoring: NetFlow monitoring can provide detailed information about bandwidth utilization on network devices, allowing administrators to optimize their network capacity and prevent performance issues.
- Security threat detection: NetFlow monitoring can detect suspicious network traffic patterns that may indicate a security breach or a network attack.
- Application performance monitoring: NetFlow monitoring can help administrators identify performance issues related to specific applications and optimize their configurations.
Overall, NetFlow monitoring is an essential technique for network device monitoring, providing administrators with detailed insights into network traffic flows and allowing them to optimize their network performance, security, and reliability.

Packet capture is a technique for network device monitoring that involves capturing and analyzing network traffic packets in real-time. Packet capture is typically used for troubleshooting network issues, analyzing network performance, and identifying security threats.
Packet capture involves the use of packet capture tools, such as Wireshark, tcpdump, and Microsoft Network Monitor, which capture and store network traffic packets in a file format that can be analyzed later. Packet capture tools can be installed on network devices or run on a dedicated computer that is connected to the network via a network tap or a network switch configured for port mirroring.
Packet capture can provide a range of benefits for network device monitoring, including:
- Network troubleshooting: Packet capture can help administrators troubleshoot network issues, such as connectivity problems, network congestion, and network errors.
- Performance analysis: Packet capture can provide detailed insights into network performance, allowing administrators to identify performance bottlenecks, optimize network configurations, and ensure that network devices are operating at peak efficiency.
- Security threat detection: Packet capture can be used to detect security threats, such as network attacks, malware infections, and unauthorized access attempts. By analyzing network traffic packets, administrators can identify suspicious activity and take appropriate measures to mitigate the threat.
- Application troubleshooting: Packet capture can help administrators troubleshoot application-related issues, such as application crashes, slow application performance, and application errors.
Overall, packet capture is an essential technique for network device monitoring, providing administrators with a powerful tool for troubleshooting network issues, analyzing network performance, and detecting security threats. However, packet capture requires specialized skills and expertise to use effectively, and should be used in conjunction with other network monitoring techniques to ensure comprehensive network device monitoring.
Synthetic monitoring is a technique for network device monitoring that involves simulating user interactions with network devices to monitor their performance and availability. Synthetic monitoring is typically used to ensure that network devices are meeting service level agreements (SLAs), and to proactively identify and address potential issues before they affect users.
Synthetic monitoring involves the use of synthetic monitoring tools, like Obkio's Network Performance Monitoring tool, which simulate user interactions with network devices, such as accessing web applications, downloading files, or sending emails. These tools can be configured to run at regular intervals, such as every five minutes, and to monitor multiple locations and devices simultaneously.
Synthetic monitoring can provide a range of benefits for network device monitoring, including:
- Proactive issue identification: Synthetic monitoring can proactively identify potential issues before they impact users, allowing administrators to take preemptive action to address the issue.
- SLA compliance monitoring: Synthetic monitoring can help with SLA monitoring to ensure that network devices are meeting SLAs, and provide detailed metrics and reports that can be used to demonstrate compliance to stakeholders.
- Performance optimization: Synthetic monitoring can identify areas where network devices are underperforming and provide insights into how performance can be optimized, such as optimizing network configurations, upgrading hardware, or improving application code.
- User experience monitoring: Synthetic monitoring can provide insights into user experience, allowing administrators to identify areas where users may be experiencing slow response times, errors, or other issues.
Overall, synthetic monitoring is an essential technique for network device monitoring, providing administrators with a powerful tool for proactively monitoring network performance and availability, ensuring SLA compliance, and optimizing network device performance. However, synthetic monitoring should be used in conjunction with other network monitoring techniques, such as packet capture and NetFlow monitoring, to ensure comprehensive network device monitoring.

Active testing is a technique for network device monitoring that involves sending test traffic or signals to network devices to monitor their performance and availability. Active testing is typically used to verify that network devices are functioning correctly, to detect network issues, and to troubleshoot network problems.
Active testing involves the use of active testing tools, which send test traffic or signals to network devices, such as pings, traceroutes, and SNMP requests. These tools can be configured to run at regular intervals, such as every minute, and to monitor multiple locations and devices simultaneously.
Active testing can provide a range of benefits for network device monitoring, including:
- Fault detection: Active testing can detect network issues such as connectivity problems, packet loss, and latency issues before they affect users, allowing administrators to take proactive measures to prevent downtime and disruptions.
- Performance monitoring: Active testing can provide insights into network device performance and availability, allowing administrators to identify performance bottlenecks and optimize network configurations.
- SLA compliance monitoring: Active testing can ensure that network devices are meeting SLAs, and provide detailed metrics and reports that can be used to demonstrate compliance to stakeholders.
- Troubleshooting: Active testing can be used to troubleshoot network problems by pinpointing the source of an issue and providing diagnostic information to help resolve the problem.
Overall, active testing is an important technique for network device monitoring, providing administrators with a powerful tool for detecting network issues, monitoring performance and network availability, and ensuring SLA compliance. However, active testing should be used in conjunction with other network monitoring techniques, such as packet capture and NetFlow monitoring, to ensure comprehensive network device monitoring.
Unveil the top 22 network device monitoring tools and take control of your network infrastructure.
Learn more

You have now mastered the art of network device monitoring like a boss! Network Device Monitoring sounds complicated, but it doesn’t have to be. Armed with this beginner's guide and some top-notch monitoring tools like Obkio, you can now monitor your network devices with ease and keep them performing at their best.
Monitoring network devices is crucial to understand your network performance and where network problems are coming from. It is the missing piece of the puzzle when troubleshooting problems, and can make a huge difference on your overall user experience.
That’s why Obkio decided to make Network Device Monitoring as easy as possible.

So go forth, my network warriors, and monitor those devices like a pro! And always remember, when in doubt, keep calm and monitor on!
To access Obkio’s Network Device Monitoring:


 Obkio Blog


