


Table of Contents
Table of Contents
If you've ever wondered why your network occasionally plays hard to get or experienced those head-scratching moments when everything seems fine, yet something's not quite right – you're in the right place. As the digital landscape evolves, understanding and effectively managing Network Error Rate has become a pivotal aspect of maintaining a robust and efficient network infrastructure.
In this blog post, we embark on a journey into the intricate world of Network Error Rate, unravelling its complexities and shedding light on why it holds such significance for network administrators. Beyond unravelling the mystery, we will delve into the practical aspects of measuring Network Error Rate, equipping administrators with the tools and insights needed to diagnose, troubleshoot, and optimize network performance.
Whether you're a seasoned network guru looking to fine-tune your skills or a novice administrator aiming to grasp the fundamentals, let's get cozy with the ins and outs of Network Error Rate. It's time to make our networks the smooth operators we know they can be!
What is Network Error Rate: Understanding the Fundamentals 
First, let’s break down the basics!
Network Error Rate refers to the frequency or ratio of errors that occur within a computer network during data transmission. In simpler terms, it quantifies how often data encounters issues or disruptions as it travels across the network. These errors can manifest in various forms, such as packet loss, latency, jitter, or other anomalies that affect the integrity and reliability of data communication.
Here are some key things to understand about Network Error Rate:
- Packet Loss: This occurs when data packets travelling through the network fail to reach their destination. Packet loss can be caused by network congestion, hardware failures, or other issues.
- Latency: Latency is the delay between sending and receiving data. High latency can lead to slow response times and negatively impact the user experience, especially in real-time applications like video conferencing or online gaming.
- Jitter: Jitter refers to the variation in latency, causing irregularities in the timing of data packets. Consistent and low jitter is crucial for applications that require a steady flow of data.
- Error Correction: Networks often implement error correction mechanisms to identify and correct errors in transmitted data. However, excessive errors or a lack of error correction can impact the overall network performance.
- Causes of Errors: Network errors can stem from various sources, including hardware malfunctions, software bugs, network congestion, electromagnetic interference, or external factors like weather conditions.
The Network Error Rate is like potholes or roadblocks on this highway. Just like smooth roads ensure a quick and reliable journey for drivers, a low Network Error Rate ensures that data can travel seamlessly through the network without encountering disruptions. Admins are like the road maintenance crew, constantly repairing and optimizing the highway to keep the data traffic flowing smoothly, ensuring a glitch-free digital journey for users.
How is Network Error Rate Calculated?
Network Error Rate is typically calculated by comparing the number of erroneous or lost data packets to the total number of transmitted packets over a specific period. The formula for calculating Network Error Rate is expressed as a percentage. Here's the basic formula:


Let's break it down:
- Number of Erroneous Packets: This represents the count of packets that encountered errors during transmission. These errors can include packet loss, corruption, or any other issues that compromise the integrity of the data.
- Total Number of Packets: This is the sum of all packets transmitted over the network during the specified time frame. It includes both successfully delivered packets and those that may have encountered errors.
The result is expressed as a percentage, indicating the proportion of packets that experienced errors relative to the total transmitted. A lower percentage indicates a healthier network with fewer errors.
The Importance of Network Error Rate
The heartbeat of a well-functioning network is its error rate. Picture it as the pulse of your organization's operations, influencing everything from user experience to business continuity. In this section, let’s look at the critical importance of Network Error Rate, exploring how it plays a pivotal role in ensuring smooth operations, maintaining trust, and fostering cost-efficient business practices.
1. User Experience:
A low Network Error Rate translates to a smoother user experience. Users expect applications, websites, and services to work seamlessly without disruptions. High error rates can result in delays, glitches, and frustration.
2. Business Continuity:
In a business environment, network reliability is critical for daily operations. Any downtime or degradation in performance due to high error rates can impact productivity, communication, and overall business continuity.
3. Reputation and Customer Satisfaction:
A network with a low error rate is seen as reliable and trustworthy. Consistently providing a dependable service enhances an organization's reputation and fosters positive relationships with clients and customers.
4. Reduced Troubleshooting Costs
Constantly addressing network issues can incur significant costs in terms of time, resources, and potential system outages. Monitoring and maintaining a low Network Error Rate can save administrators from dealing with the aftermath of major disruptions.

Why Network Admins Need to Pay Attention to Network Error Rate
Alright, let's talk about why network admins need to be on their A-game when it comes to Network Error Rate. Well, when things go south and network errors start creeping in, admins are the first to hear about user complaints and they become the go-to troubleshooters. They're the ones users turn to when the network starts acting up.
In this section, we're going to dig into the reasons why it's so crucial for admins to keep tabs on Network Error Rate:
Proactive Issue Resolution: Monitoring Network Error Rate allows administrators to identify potential issues before they escalate. Proactively addressing problems can prevent network outages, minimize downtime, and save resources in the long run.
Performance Optimization: Understanding the error landscape helps administrators fine-tune the network for optimal performance. It enables them to identify bottlenecks, optimize configurations, and implement improvements to enhance overall efficiency.
Effective Resource Management: By knowing the Network Error Rate, admins can allocate resources strategically. This includes upgrading hardware, optimizing network traffic, and implementing measures to handle increased data loads.
Rapid Issue Resolution: Administrators armed with insights into Network Error Rate can respond swiftly to user-reported issues. This ensures a more efficient support system and helps maintain high levels of user satisfaction.
Detecting Anomalies: Unusual patterns in Network Error Rate can sometimes indicate security threats such as network attacks or intrusions. Admins paying attention to these metrics can act promptly to mitigate potential security risks.
In essence, Network Error Rate is a vital metric that directly impacts the user experience, business operations, and overall efficiency of an organization's network. Admins who pay close attention to these metrics can maintain a reliable network and contribute significantly to the success and stability of the entire IT infrastructure.
The Ultimate Ally to Demystifying Network Error Rate
Maintaining a glitch-free network is no easy feat, but fear not! With the right tools, you can transform those error headaches into smooth-sailing connectivity. Introducing Obkio's Network Performance Monitoring tool – your ultimate sidekick in the quest for a pristine network.

Why Choose Obkio?
Obkio's Network Performance Monitoring tool stands out as the ultimate ally in conquering network challenges. With its real-time insights, you can instantly grasp the pulse of your network and stay ahead of potential issues before they disrupt your users. The user-friendly interface ensures that even those without a tech background can navigate through network metrics effortlessly.
Obkio empowers you to measure Network Error Rate accurately, diagnose issues promptly, and optimize overall performance, transforming your network into a seamlessly efficient digital highway.
How Obkio Works Wonders:
- Measure Network Error Rate: Pinpoint error hotspots and get a crystal-clear view of your Network Error Rate.
- Diagnose Network Issues: Swiftly identify and troubleshoot issues, minimizing downtime and maximizing efficiency.
- Optimize Performance: Fine-tune your network for optimal performance, ensuring a seamless user experience.
Ready to Take the Leap?
Don't let network errors dictate your network's destiny! Embrace the power of Obkio and transform your network into a well-oiled machine. Visit Obkio to kickstart your journey to error-free networking today! Your users will thank you, and so will your sanity.


Understanding Types of Network Errors You May Encounter
So, when we're measuring Network Error Rate, it's not about getting all serious with the numbers. It's more like getting to know the quirks and twirls of these errors that can mess with our digital vibe.
Network errors can manifest in various forms, impacting the transmission of data across a network. From the subtle hiccups like packet loss to the more pronounced issues of latency and jitter, network administrators must be vigilant. Here are some common types of network errors:

- Packet Loss: Packet loss occurs when data packets travelling through the network fail to reach their destination. Packet loss can be caused by network congestion, hardware failures, or environmental factors like electromagnetic interference.
- Latency: Latency refers to the delay between sending and receiving data. Latency can be caused by network congestion, long distances, and routing inefficiencies can contribute to increased latency.
- Jitter: Jitter refers to the variation in the timing of data packet arrival, leading to irregularities in the data stream. Jitter can be caused by network congestion, inconsistent routing, or fluctuations in data transfer rates.
- CRC Errors (Cyclic Redundancy Check): CRC Errors occur when data corruption is detected during the transmission process. They can be caused by electrical interference, signal attenuation, or issues with network hardware.
- Collisions: This happens when two or more devices attempt to transmit data simultaneously on a shared network segment. Collisions are common in Ethernet networks, collisions decrease network efficiency.
- Duplex Mismatch: Arises when connected devices operate at different duplex modes (half-duplex or full-duplex), causing communication issues. They can be caused by configuration mismatches between devices on the same network segment.
- Out-of-Order Packets: Also called, Packet Reordering, happens when data packets arrive at the destination in a different order than they were sent. Can be caused by network congestion, routing issues, or delays in packet processing.
- Fragmentation: Large data packets are broken into smaller fragments for transmission, and issues arise if these fragments do not reach the destination in the correct order. It can happen when using network devices with different Maximum Transmission Unit (MTU) settings.
- DNS Resolution Issues: DNS issues cause problems in translating domain names to IP addresses, impacting the ability to access websites. Can be caused by DNS server failures, misconfigurations, or network connectivity issues.
- Broadcast Storms: Excessive broadcast traffic in a network, leading to network congestion and performance degradation. Malfunctioning devices or software generating a high volume of broadcast traffic can lead to broadcast storms.
Identifying and addressing these types of network errors is crucial for maintaining a reliable and efficient network. Network administrators use various monitoring tools and diagnostic techniques to pinpoint the root causes of errors and implement corrective measures. So let’s get into that next!
How to Measure Network Error Rate: Step-by-Step
Measuring Network Error Rate is the art of decoding the messages hidden in the data flow, a journey that involves the right tools, keen analysis, and a touch of detective work. In this section, we'll unravel the process behind measuring Network Error Rate, exploring the steps, techniques, and considerations that network administrators employ to ensure their digital highways stay clear of disruptions.
Step 1. Select the Right Network Error Rate Monitoring Tool
Measuring Network Error Rate involves a combination of techniques and tools to gain a comprehensive understanding of the network's health. The type of tool will also depend on your business needs and requirements. Are you looking for a tool that simply identifies network errors, or are you looking for an end-to-end monitoring solution that helps you proactively identify and troubleshoot network errors before they affect end-users?
When you’re managing an enterprise network, we always recommend the latter. It’s important to have complete visibility over your network so you can truly understand where network errors are coming from, what they affect, why they happen, and how to stop them from coming back.
That’s why, we’re going to first and foremost recommend:
1. Network Performance Monitoring Tools
Network Performance Monitoring (NPM) tools stand out as a top-tier choice when it comes to measuring Network Error Rate and identifying network errors. These tools offer real-time visibility into the inner workings of a network, allowing administrators to capture and analyze data packets as they traverse the digital landscape. This real-time perspective is crucial for promptly detecting errors as they occur, ensuring a proactive approach to network management.
Introducing Obkio: The Easiest Network Performance Monitoring Tool
Obkio’s Network Performance Monitoring tool monitors end-to-end network performance, from LAN to WAN, using synthetic traffic to quickly identify and troubleshoot network errors affecting your applications, services, and user experience.

Obkio is a simple, robust and scalable solution for network administrators. Whether managing a small business network or a large enterprise infrastructure, Obkio adapts to the scale and requirements of the network, making it an indispensable asset for maintaining a resilient, efficient, and error-free network.
2. Packet Sniffing Tools
Packet sniffers, also called Passive Monitoring tools, capture and analyze data packets traversing the network, providing a detailed look at the content and structure of each packet. By inspecting packet headers and payloads, administrators can identify errors, such as packet loss or corruption, and gain insights into the overall quality of data transmission.
3. SNMP (Simple Network Management Protocol)
SNMP Monitoring facilitates the exchange of management information between network devices. It allows administrators to monitor and collect performance data from routers, switches, and other network components. SNMP provides a holistic view of network health, enabling administrators to track error rates, bandwidth usage, and other critical parameters across the entire network infrastructure.
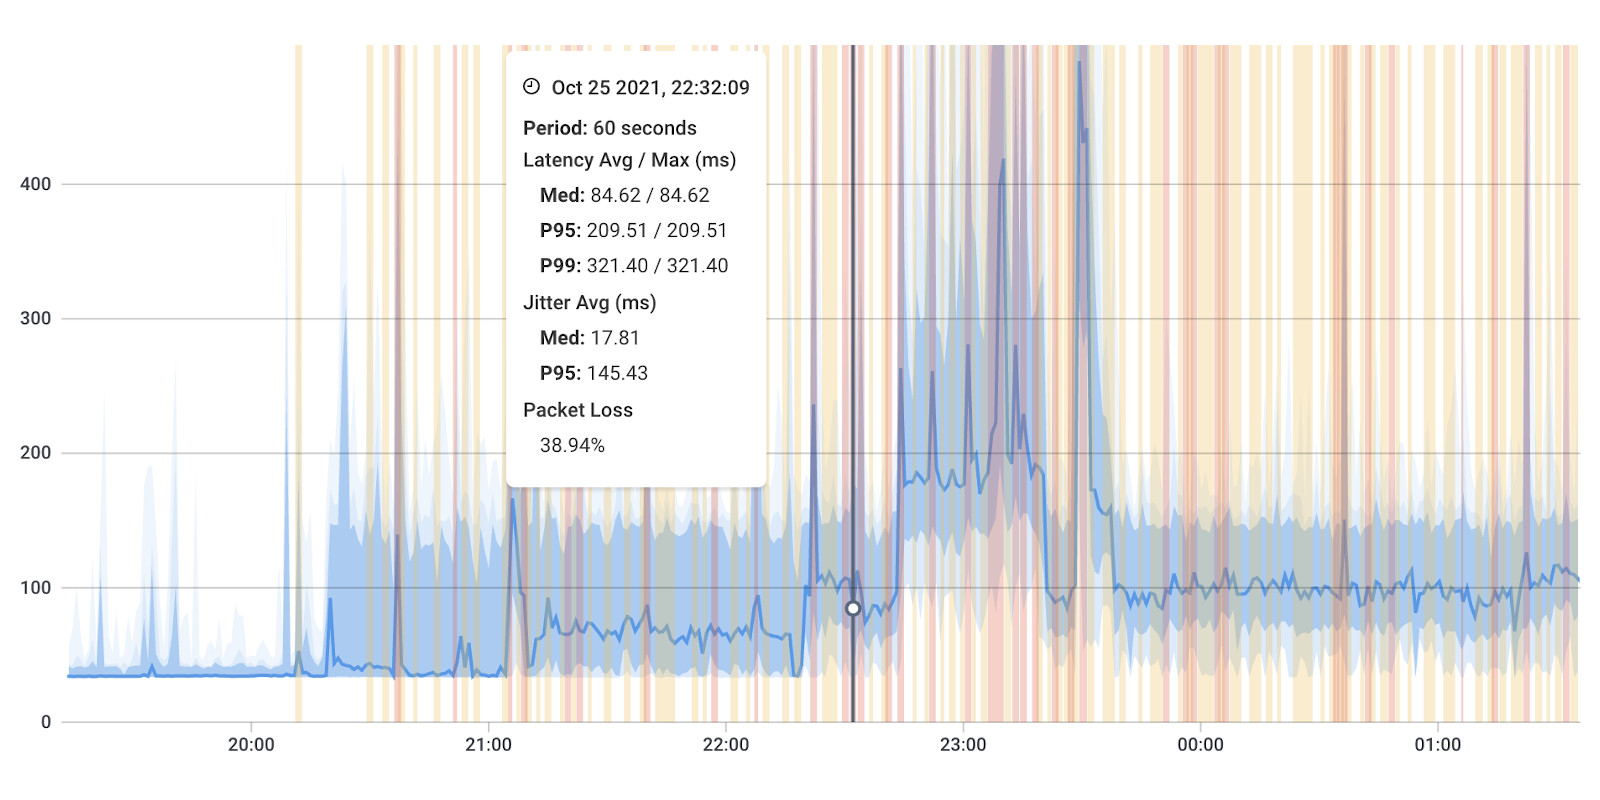
4. Ping and Traceroute
Ping measures the round-trip time for data packets to travel from the source to a destination, while Traceroute traces the route taken by packets to reach their destination. Elevated round-trip times (latency) and irregular routing paths detected by Traceroute can indicate network issues, assisting administrators in pinpointing potential error sources.
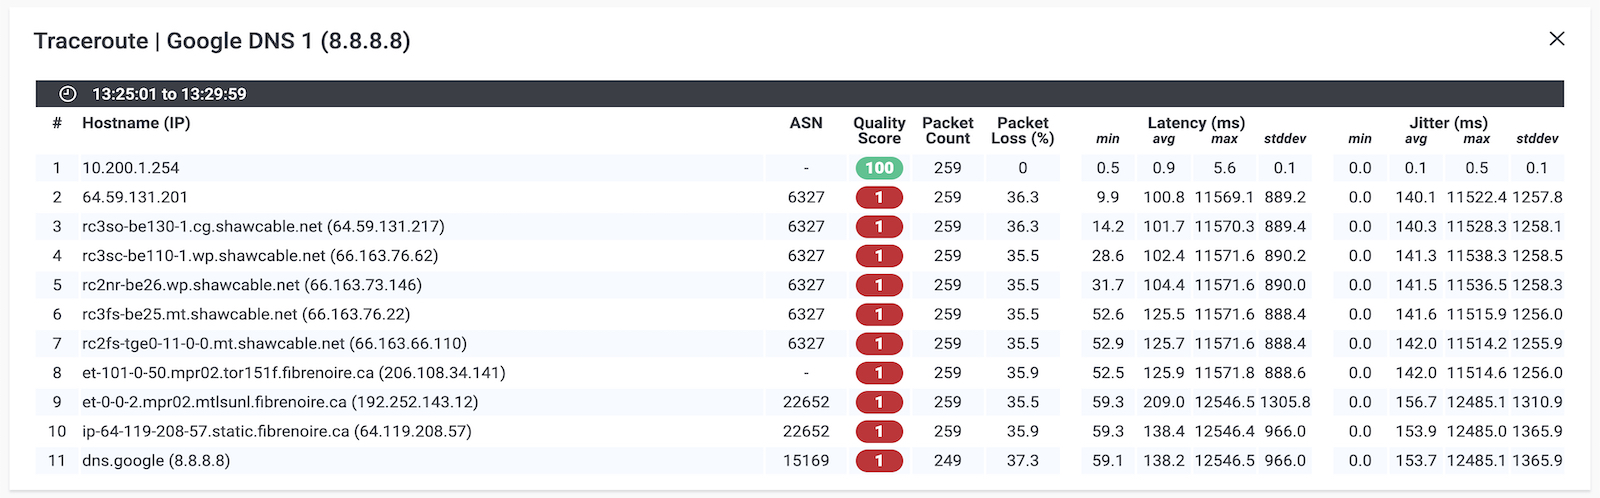 *Screenshot from Obkio Vision, Obkio's free Visual Traceroute Tool.
5. Flow Analysis
Flow analysis tools examine the patterns of communication between devices in the network, tracking the flow of data. Identifying irregularities in data flow can reveal potential error sources, such as bottlenecks or congestion points, assisting administrators in optimizing network performance.
6. Error-Correction Protocols:
Some networks employ error-correction protocols, such as Automatic Repeat reQuest (ARQ), to detect and correct errors in transmitted data. These protocols enhance data reliability by automatically retransmitting corrupted or lost packets, minimizing the impact of errors on the overall network performance.

Discover the superheroes of network monitoring tools in our comprehensive guide. Unveil the perfect type of network monitoring tool for your business.
Learn moreStep 2. Deploy Monitoring Agents to Measure Network Error Rate Globally
Installing monitoring agents strategically within the network infrastructure is a fundamental step in the process of measuring Network Error Rate and identifying network errors. These monitoring agents play a pivotal role in capturing and analyzing data packets, acting as the eyes and ears of the entire monitoring system.
To measure network error rate using Obkio’s NPM tool, you need to deploy Network Monitoring Agents which continuously measure network performance in key network locations like offices, data centers and clouds. The Agents exchange synthetic traffic to measure network metrics between each other and identify the earliest signs of performance issues.
This will help you find the root cause of network errors and identify any network segments where network error rate is especially high. Essentially, to collect the data you need to troubleshoot, you’ll need:
- Local Agents: Installed in the targeted office location experiencing network errors. There are several Agent types available (all with the same features), and they can be installed on MacOS, Windows, Linux and more.
- Public Monitoring Agent: These are deployed over the Internet and managed by Obkio. They compare performance up to the Internet and quickly identify if the network error is global or specific to the destination.

Strategic placement of monitoring agents involves selecting key points within the network where data flow is critical or where potential issues are likely to occur. This could include placing agents at network entry and exit points, at critical junctions, or within specific segments that are prone to congestion. By doing so, administrators can ensure comprehensive coverage and a more accurate representation of the overall network performance.
Once installed, these agents continuously monitor the flow of data packets, intercepting and logging them for analysis. They meticulously examine the characteristics of each packet, including details such as packet size, transmission time, and destination. This granular level of observation allows for the detection of anomalies, errors, or irregularities in the network's data transmission.
Step 3. Measure Network Error Rate Metrics
Defining the metrics and parameters to be monitored is a critical step in the process of measuring Network Error Rate and ensuring effective network performance management.
Luckily, one of the key strengths of NPM tools, like Obkio, lies in their ability to provide a comprehensive set of network metrics like network error rate, and beyond! Beyond the basic packet loss, these tools cover a spectrum of metrics including latency, jitter, and more. This holistic approach enables administrators to gain a nuanced understanding of the network's health, allowing them to pinpoint specific issues affecting performance
Let’s look at some key network metrics related to network error rate:
- Packet Loss:
Packet Loss refers to the percentage of data packets that fail to reach their destination. It indicates the reliability of data transmission. High packet loss can degrade network performance and impact user experience. Packet loss thresholds help identify when the network is experiencing abnormal behaviour, prompting swift investigation and intervention.
- Latency:
Latency, the time it takes for data to travel from the source to the destination, is a crucial metric. It affects the responsiveness of applications. High latency can lead to delays in data transmission, particularly critical for real-time applications.
Administrators define latency targets based on the specific requirements of the network and its applications. This ensures that data transmission occurs within acceptable timeframes, preventing delays that can affect real-time applications and user experience.
- Jitter:
Jitter refers to variations in the arrival times of data packets. Unpredictable jitter can result in uneven data flow, affecting the quality of voice and video communication. Consistent jitter is crucial for smooth data transmission.
Administrators establish tolerances for jitter to maintain a consistent flow of data. Jitter tolerances are crucial, especially for applications sensitive to timing, such as voice and video communication.
- Throughput:
Throughput represents the amount of data transmitted over the network within a given time. And indicates the network's capacity. Monitoring throughput helps identify potential bottlenecks and ensures the network can handle the expected data volume.
Administrators define throughput requirements based on the network's capacity and the demands of its users. By monitoring throughput, administrators can identify potential bottlenecks and ensure that the network can handle the expected volume of data without degrading performance.
- Error-Correction Metrics:
Parameters related to error-correction mechanisms, such as Automatic Repeat reQuest (ARQ). It ensures the reliability of data transmission. Effective error correction minimizes the impact of errors on network performance.
Depending on the network infrastructure, administrators may implement error-correction mechanisms. This includes defining parameters for protocols like Automatic Repeat reQuest (ARQ) that automatically detect and rectify errors during data transmission.
- DNS Resolution Time:
DNS Resolution Time refers to the time taken to resolve domain names to IP addresses. Slow DNS resolution can impact the time it takes to access websites and services, affecting user experience.
- Network Congestion:
Network Congestion metrics measure the level of traffic on the network. High congestion can lead to packet loss, increased latency, and degraded network performance. Monitoring congestion helps in optimizing network resources.
- Router and Switch Performance:
Metrics related to the performance of routers and switches, including CPU usage and traffic levels. Identifies potential issues with network devices that can impact overall network performance.
- TCP Retransmission Rate:
The rate at which TCP packets are retransmitted. It indicates potential issues with data transmission reliability. High retransmission rates may point to network congestion or errors.
- Security Metrics:
Metrics related to network security, including intrusion attempts, firewall logs, and unusual traffic patterns. This involves monitoring metrics such as intrusion attempts, unusual traffic patterns, or potential security breaches. Security metrics contribute to maintaining the integrity of the network and safeguarding against unauthorized access. These metrics are critical for identifying and mitigating security threats that can compromise network integrity.
- Wireless Signal Strength:
The strength of the wireless signal in a wireless network. Poor signal strength can lead to packet loss and increased latency in wireless networks. Monitoring signal strength helps optimize wireless connectivity.
By establishing clear metrics and parameters, administrators create a network baseline for normal network behaviour. Deviations from these established criteria serve as indicators of potential issues or impending network errors. This proactive approach empowers administrators to detect, diagnose, and resolve problems swiftly, minimizing downtime and ensuring a reliable and resilient network infrastructure.
Step 4. Real-Time Network Error Rate Measurements: Good vs. Bad
Continuously collecting real-time data on network performance is a vital aspect of monitoring network error rate and optimizing network performance. This process involves actively monitoring the flow of data packets, scrutinizing their characteristics, and swiftly identifying instances of various errors, including packet loss, latency, jitter, and others.
The heart of this continuous data collection lies in the ongoing network monitoring of data packets as they traverse the network. Monitoring tools, like Obkio, strategically placed within the network infrastructure, act as vigilant sentinels, intercepting and inspecting each packet that journeys through the digital pathways. By closely examining the characteristics of these packets, administrators can gain valuable insights into their network error rate, what it is, and what it should be at.
The definition of what constitutes a "good" or "bad" network error rate can vary based on the specific requirements of the network and the applications it supports. Different industries, applications, and user expectations may have varying tolerances for errors. However, here are some general guidelines:
Packet Loss:
- Good: Packet loss rates below 1% are typically considered acceptable for most networks. In some cases, even lower rates are desirable, especially for applications that require high reliability, such as VoIP or video conferencing.
- Bad: Packet loss exceeding 1% can lead to noticeable degradation in audio or video quality for real-time applications. Loss rates above 5% are generally considered problematic and can severely impact performance.
Latency:
- Good: Low-latency networks are desirable, especially for real-time applications. Latency below 50 milliseconds is often considered good for applications like voice communication or online gaming.
- Bad: Latency exceeding 100 milliseconds can lead to perceptible delays in applications, affecting user experience. Latency above 200 milliseconds may be unacceptable for certain applications, such as video conferencing.
Jitter:
- Good: Jitter values below 30 milliseconds are generally considered good, as they contribute to a smooth and consistent data stream.
- Bad: Jitter exceeding 50 milliseconds can result in irregularities in data packet arrival times, affecting the quality of real-time applications.
It's important to note that these are general guidelines, and the acceptable error rates can vary based on the specific requirements of the network and the applications it supports. For example, a network supporting critical financial transactions may have a lower tolerance for errors compared to a home network used for non-sensitive internet browsing.
Additionally, the type of traffic and the nature of the applications running on the network influence what is considered acceptable. For mission-critical applications, even low error rates might be problematic, whereas, for non-critical traffic, slightly higher error rates may be tolerable.
Step 5. Identify Network Errors
Network Error Rate offers a quantifiable representation of the prevalence of errors within the network. This metric becomes a key indicator of the overall health and reliability of data transmission.
Beyond mere numerical values, the analysis extends to identifying patterns and trends within the data. By analyzing the historical and real-time network data, network admins can discern recurring sequences of events or error occurrences. Recognizing patterns is instrumental in understanding the nature of network errors and can aid in predicting potential issues before they escalate.
Anomalies or irregularities in network behaviour act as red flags during the analysis. Monitoring tools are designed to detect deviations from established baselines or predefined thresholds. These irregularities may manifest as sudden spikes in packet loss, unusual latency variations, or unexpected patterns in the flow of data packets. Pinpointing these anomalies is crucial for isolating potential network errors and addressing them promptly.
The overall goal of this analysis is to uncover the story within the data—discerning not only the "what" of network errors but also the "why" and "how." By understanding the context surrounding error occurrences, administrators can delve deeper into the root causes, whether they stem from network congestion, hardware failures, or other contributing factors.
Step 6. Generate Network Error Rate Reports and Alerts
Generating detailed reports and setting up alerts is extremely effective when monitoring Network Error Rate. This process involves creating comprehensive reports that summarize key metrics related to error rates and establishing automated alerts to notify administrators in real-time when predefined thresholds are exceeded.
Reports:
Administrators use reporting tools, like Network Performance Reports, to compile and analyze data collected over time. These reports provide a snapshot of the network's health, including trends in error rates, patterns of incidents, and the overall performance of key metrics such as packet loss, latency, and jitter. Detailed reports offer a historical perspective, allowing administrators to identify recurring issues, track the effectiveness of implemented solutions, and demonstrate the network's performance to stakeholders.
Alerts:
Setting up alerts is a proactive measure to address emerging issues promptly. Administrators define specific thresholds for key error metrics. When the actual values surpass these thresholds, automated alerts are triggered, notifying administrators in real-time. Network Monitoring Alerts can be sent through various channels, such as email, text messages, or dedicated monitoring platforms. This immediate notification enables administrators to swiftly investigate and respond to potential network errors before they escalate.

The combination of reports and alerts creates a dynamic and responsive network management system. Reports provide a detailed overview for periodic analysis, while alerts ensure that administrators are instantly informed about critical deviations from expected performance. This proactive approach is essential for maintaining network reliability, minimizing network downtime, and optimizing performance in the face of evolving network conditions.
Measuring Network Error Rate is not a one-time task but an ongoing process that requires vigilance and adaptability. By employing a combination of monitoring tools, analytical techniques, and proactive measures, network administrators can ensure the reliability and efficiency of their network infrastructure.
Understanding Network Error Rate Measurements
I. Interpreting Metrics: What the Numbers Really Mean
Numbers tell a story, and in the realm of network metrics, understanding that narrative is key. Here, we'll decipher the significance of crucial metrics like packet loss, latency, and jitter. Armed with this knowledge, administrators can unravel the mysteries hidden within the data, paving the way for effective troubleshooting and optimization.
Packet Loss: Packet loss indicates the percentage of data packets that fail to reach their destination. Occasional packet loss is normal, but consistent or high rates may suggest network congestion, hardware issues, or unreliable connections.
- What to Look For: Below 1% is generally acceptable packet loss. Beyond 5% may lead to noticeable performance degradation.
Latency: Latency measures the time it takes for data to travel from the source to the destination. Higher latency can result in delays, affecting real-time applications.
- What to Look For: Below 50 ms is good. Latency exceeding 100 ms may impact user experience, particularly in real-time applications.
Jitter: Jitter reflects variations in packet arrival times. Consistent jitter is preferable for a smooth data stream.
- What to Look For: Below 30 ms is generally good. Jitter exceeding 50 ms can lead to uneven data flow.
CRC Errors: Cyclic Redundancy Check (CRC) errors indicate potential data corruption during transmission.
- What to Look For: Occasional errors may be normal. A sudden increase suggests issues in the network segment or hardware.
Throughput: Throughput measures the amount of data transmitted over the network in a given time.
- What to Look For: Should meet the demands of applications. Consistent decreases may indicate congestion or other issues.
II. What is An Ideal Network Error Rate?
Determining what constitutes a good or bad network error rate depends on several factors, including the type of network, applications running on it, and user expectations. However, here are some general guidelines:

Packet Loss:
- Good: Generally below 1%. Minimal impact on user experience.
- Bad: Exceeding 5% is considered high and can result in noticeable performance degradation.
Latency:
- Good: Below 50 milliseconds for most applications.
- Bad: Latency exceeding 100 milliseconds may lead to perceptible delays, particularly in real-time applications.
Jitter:
- Good: Below 30 milliseconds for a smooth data stream.
- Bad: Exceeding 50 milliseconds may result in uneven data flow, affecting real-time applications.
CRC Errors:
- Good: Minimal or occasional errors.
- Bad: Sudden increases or consistently high levels may indicate issues in the network segment or hardware.
Throughput:
- Good: Meets the demands of applications without significant delays.
- Bad: Consistent decreases in throughput may indicate congestion or other issues.
It's essential to regularly monitor, analyze, and adjust network parameters based on the evolving needs of users and applications. Additionally, industry standards and specific service level agreements (SLAs) may influence what is deemed acceptable for a particular network. The goal is to strike a balance between achieving optimal performance and addressing any challenges that may arise in the network's operational context.
III. What Network Error Rates Should Be At: Examples
With metrics in hand, the natural question arises: what constitutes acceptable error rates? In this section, we'll set benchmarks, providing examples for various types of networks, from enterprise setups to specialized applications like VoIP and video conferencing. Understanding these benchmarks is fundamental to gauging the health of your network.
Network Error Rate for Enterprise Networks:
Expect low error rates to ensure the smooth operation of business applications.
- Packet Loss: Below 1%
- Latency: Below 50 ms
- Jitter: Below 30 ms
- CRC Errors: Minimal
- Throughput: Supports business applications without significant delays.
Network Error Rate for Voice Over IP (VoIP) Networks:
Require low latency/good latency and minimal jitter to support real-time voice communication without disruptions.
- Packet Loss: Below 1%
- Latency: Below 30 ms
- Jitter: Below 20 ms
- CRC Errors: Minimal
- Throughput: Supports real-time voice communication without disruptions.
Network Error Rate for Video Conferencing Networks:
Demand low latency, minimal jitter, and high throughput to ensure high-quality video streaming without interruptions.
- Packet Loss: Below 0.5%
- Latency: Below 50 ms
- Jitter: Below 20 ms
- CRC Errors: Minimal
- Throughput: Supports high-quality video streaming without interruptions.
These are general guidelines, and ideal error rates can vary based on the specific requirements of the network and its applications. Regular monitoring and adjustment are crucial to ensure the network aligns with the expectations of users and applications. It's essential to strike a balance between achieving optimal performance and addressing any challenges that may arise in the dynamic landscape of network operations.
Common Causes of Network Errors and High Network Error Rate
Network errors can be elusive adversaries, impacting performance and frustrating users. Unravelling their mysteries involves identifying the culprits and weathering external factors. Let's explore two key dimensions of this challenge:
I. Identifying Network Error Culprits: Hardware vs. Software Issues
When it comes to identifying network errors, distinguishing between hardware and software issues is paramount. Hardware malfunctions, such as faulty routers or cables, can introduce errors in the transmission process. On the other hand, software glitches may stem from misconfigurations, outdated firmware, or incompatible protocols. Navigating this duality requires a diagnostic approach, where administrators meticulously examine both hardware components and software configurations to pinpoint and address the root causes.
II. External Factors Causing Network Errors: Weathering the Storm of External Interference
Beyond the confines of hardware and software lies a realm of external factors that can disrupt network harmony. Environmental conditions, electromagnetic interference, and even malicious attacks can introduce errors. Weathering this storm involves implementing robust security measures, shielding hardware from interference, and establishing contingency plans for unforeseen events. By understanding and mitigating external factors, network administrators fortify their networks against the unpredictable elements that could compromise performance and reliability.
III. Causes of High Network Error Rate
A high number of Network Errors leads to a high Network Error Rate, which drastically impacts network performance and user experience. Elevated network error rates can stem from various factors, and identifying the specific causes is crucial for effective troubleshooting and resolution. Here are some common causes of elevated network error rates:
- Network Congestion: High levels of traffic can lead to congestion, resulting in packet loss and increased latency. This can lead to degraded performance, increased error rates, and potential disruptions in data transmission.
- Faulty Hardware: Malfunctioning routers, switches, network cables, or other hardware components. This introduces errors in the data transmission process, leading to elevated error rates.
- Software Issues: Misconfigurations, outdated firmware, incompatible protocols, or software bugs. Software-related issues can contribute to packet loss, latency, and other error metrics.
- Wireless Interference: Interference from other wireless devices or networks operating on the same frequency. This can result in packet loss, increased latency, and reduced overall network performance in wireless environments.
- Environmental Factors: Physical factors such as temperature, humidity, and electromagnetic interference. Adverse environmental conditions can disrupt signal transmission and contribute to elevated error rates.
- Security Threats: Malicious activities such as denial-of-service (DoS) attacks or network intrusions. Security threats can lead to increased error rates, service disruptions, and compromise the integrity of the network.
- Outdated Equipment: Use of outdated or unsupported networking equipment. Aging hardware may struggle to handle modern network demands, leading to increased errors.
- Physical Layer Issues: Damaged cables, connectors, or other physical layer issues. Introduces signal degradation and errors into the network.
- Network Configuration Changes: Recent changes to network configurations without proper testing. Misconfigurations can lead to increased error rates and unexpected behaviour.
- Intermittent Connectivity: Unstable or unreliable network connections. Intermittent connectivity issues can result in transient increases in error rates.

Learn about some of the most common network problems that businesses face every day, like high CPU, bandwidth, equipment issues, Internet failures, and more.
Learn moreThe Impact of High vs. Low Network Error Rate on Network Performance
Especially in enterprise networks, network errors are a critical factor shaping the user experience and overall performance. In this section, we unravel the consequences of both high and low network error rates. From the frustrating disruptions of elevated error rates to the seamless efficiency of minimal errors, join us as we explore how these rates wield their influence on the performance and reliability of your network.
The Impact of High Network Error Rate
Degraded Performance: High error rates often result in degraded network performance. Increased packet loss, latency, and jitter can lead to sluggish data transmission and negatively impact the responsiveness of applications.
Reduced Throughput: Elevated error rates can reduce the overall throughput of the network. This means that the amount of data transmitted over the network within a given time may be significantly lower, affecting the efficiency of data transfer.
Increased Retransmissions: High error rates may trigger an increase in the number of retransmitted packets. This not only contributes to network congestion but also adds latency as packets need to be resent.
Application Disruptions: Real-time applications such as VoIP, video conferencing, and online gaming can experience disruptions and degradation in quality due to high error rates. Users may notice dropped calls, frozen video frames, or lag in online interactions.
User Frustration: Elevated error rates result in a suboptimal user experience. Slow loading times, buffering in streaming services, and interrupted connectivity can frustrate users and negatively impact productivity.
The Impact of Low Network Error Rate:
Optimal Performance: A low error rate contributes to optimal network performance. Data transmission is efficient, and applications operate smoothly, providing a seamless experience for users.
High Throughput: Low error rates support high throughput, allowing the network to handle a substantial volume of data without significant degradation in performance. This is crucial for networks with high data transfer demands.
Reliable Real-Time Applications: Real-time applications, such as voice and video communication, function reliably with minimal disruptions. Low error rates ensure a smooth and uninterrupted experience for users engaging in these applications.
Efficient Data Transmission: Data is transmitted efficiently without the need for frequent retransmissions. This results in lower latency and a more responsive network.
Enhanced User Satisfaction: Users experience a network that meets their expectations, leading to higher satisfaction. Reliable connectivity and fast data transmission contribute to a positive user experience.
In summary, high network error rates can have a detrimental impact on network performance, causing disruptions, delays, and frustrated users. On the other hand, low error rates contribute to optimal performance, efficient data transmission, and enhanced user satisfaction.
Best Practices for Lowering Network Error Rate
As we approach the conclusion of our exploration of network error rate, we want to ensure you depart armed with practical insights and actionable tips. So, let’s go over some final tips that serve as beacons in navigating the dynamic landscape of network management. Whether you're fine-tuning configurations, enhancing security measures, or optimizing performance, these tips encapsulate key considerations to fortify your network against potential challenges.
- Regular Network Monitoring: Implement continuous network monitoring to promptly detect and address issues. Regular monitoring allows administrators to identify abnormal patterns, potential bottlenecks, and emerging errors, enabling proactive intervention.
- Invest in Quality Hardware: Choose reliable and high-quality networking equipment. Faulty hardware is a common source of errors. Investing in robust routers, switches, cables, and other components reduces the risk of hardware-related issues.
- Keep Software Up-to-Date: Ensure that firmware, drivers, and networking software are regularly updated. Outdated software can introduce vulnerabilities and compatibility issues, leading to errors. Updates often include bug fixes and improvements.
- Network Optimization: Optimize network configurations and settings for efficiency. Well-optimized networks can handle data traffic more effectively, reducing the likelihood of congestion and errors.
- Implement Quality of Service (QoS): Prioritize critical applications through Quality of Service settings. QoS ensures that essential applications receive the necessary bandwidth, reducing the risk of errors in real-time and mission-critical services.
- Error Correction Mechanisms: Implement error correction mechanisms, such as Automatic Repeat reQuest (ARQ). These mechanisms enhance the reliability of data transmission by automatically retransmitting packets that experience errors.
- Regular Network Audits: Conduct regular network audits to assess configurations, security, and performance. Audits help identify and rectify misconfigurations, security vulnerabilities, and potential sources of errors.
- Regular Training for Network Administrators: Ensure that network administrators are well-trained and up-to-date on best practices. Competent administrators can proactively manage and troubleshoot network issues, minimizing the occurrence of errors.
- Backup and Redundancy: Implement backup solutions and build redundancy into critical network components. Redundancy ensures continuity in case of hardware failures, reducing the impact of errors on network performance.
By incorporating these best practices into network management strategies, organizations can create a robust and reliable network infrastructure with lower error rates, ensuring optimal performance and a positive user experience.
Taking the Reigns of Your Network Error Rate: Your Network, Your Rules
And there you have it, our expedition through the twists and turns of network error rates. We've unravelled the mysteries, explored the highs and lows, and dived deep into the nuances that make your digital pathways tick.
Measuring network error rate isn't just a tech checklist item; it's your radar for potential disruptions, the compass guiding you through optimal performance. Understanding the impact of high and low error rates on user experience, application reliability, and overall network efficiency empowers administrators to proactively address challenges. It's the key to preempting disruptions, optimizing configurations, and ensuring a seamless digital experience for users.
As you gear up to tackle the challenges of network management, keep in mind the practical tips we've uncovered. From regular monitoring to choosing top-notch hardware and staying on top of software updates, these are the building blocks of a resilient network. Remember that measuring network error rates isn't just a task—it's your compass, your proactive shield against the unpredictable.

To take your network management to the next level, it’s time to leverage cutting-edge tools that provide real-time insights and actionable data. Obkio's Network Performance Monitoring tool is your ultimate ally to measure, analyze, and optimize network error rates seamlessly.
Ready to elevate your network performance?
- 14-day free trial of all premium features
- Deploy in just 10 minutes
- Monitor performance in all key network locations
- Measure real-time network metrics
- Identify and troubleshoot live network problems

