






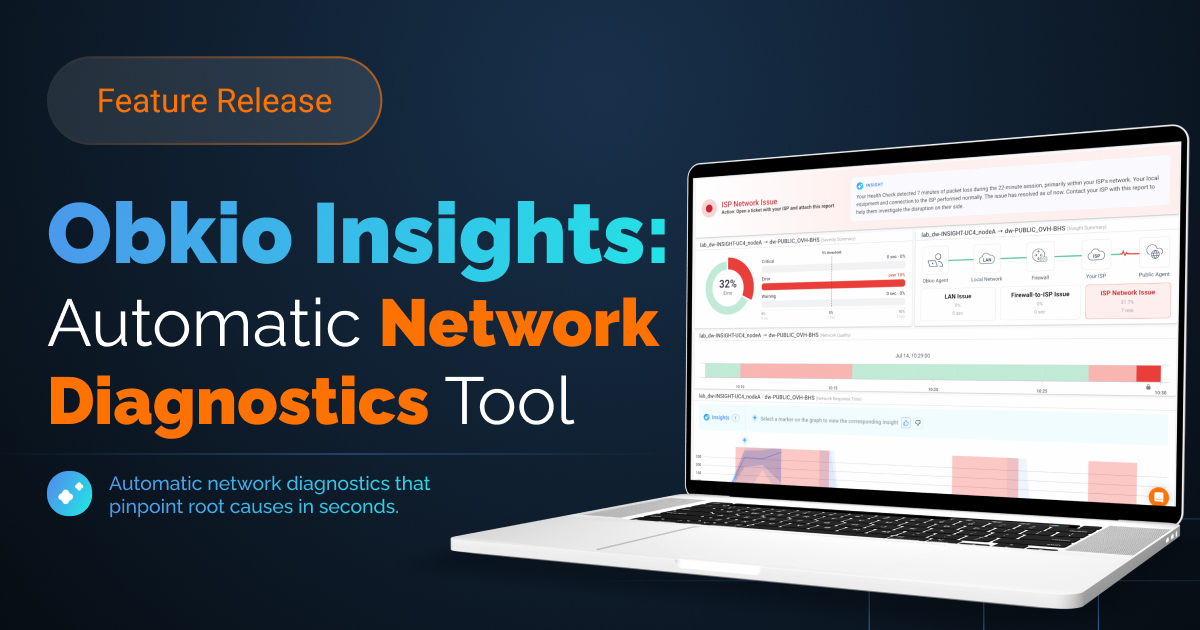


 Obkio Blog


 Subscribe
Table of Contents
Table of Contents
Network diagnostics is the process of finding out why a network performance issue is happening: what's causing it, where and when it occurred, and who needs to fix it. It's the step between an alert telling you something is wrong and a fix being applied. For most IT teams, it's also the slowest part of resolving a network issue.
In this guide, we cover what network diagnostics involves, the data a diagnosis relies on, the most common root causes it uncovers, and how automatic network diagnostics is changing the process.
What is Network Diagnostics? 
Network diagnostics, also called network diagnosis, is the process of identifying the root cause of a network issue by analyzing performance, device, and path data from the time the issue occurred. Network monitoring detects that performance has degraded; network diagnostics explains why.
A complete network diagnosis answers four questions:
- What's wrong? The symptom and its cause. Packet loss is a symptom; a firewall running out of CPU is a cause.
- Where is it? The part of the network responsible: your LAN, your firewall, your ISP's local loop, or deeper in your ISP's network.
- When did it happen? The exact time window of the issue, which determines what data is relevant. This matters most for intermittent issues, which may be gone by the time anyone investigates.
- Who needs to fix it? Whether the issue belongs to your internal team, the owner of a specific device, or your ISP. This is what turns a diagnosis into action.
Network diagnostics covers both outages and performance degradation. An outage is a link or device going down. Performance degradation is latency, jitter, or packet loss that slows applications and disrupts calls without a full outage. Performance issues are usually harder to diagnose, because the network is still technically up and the cause can be anywhere on the path between users and the applications they rely on.
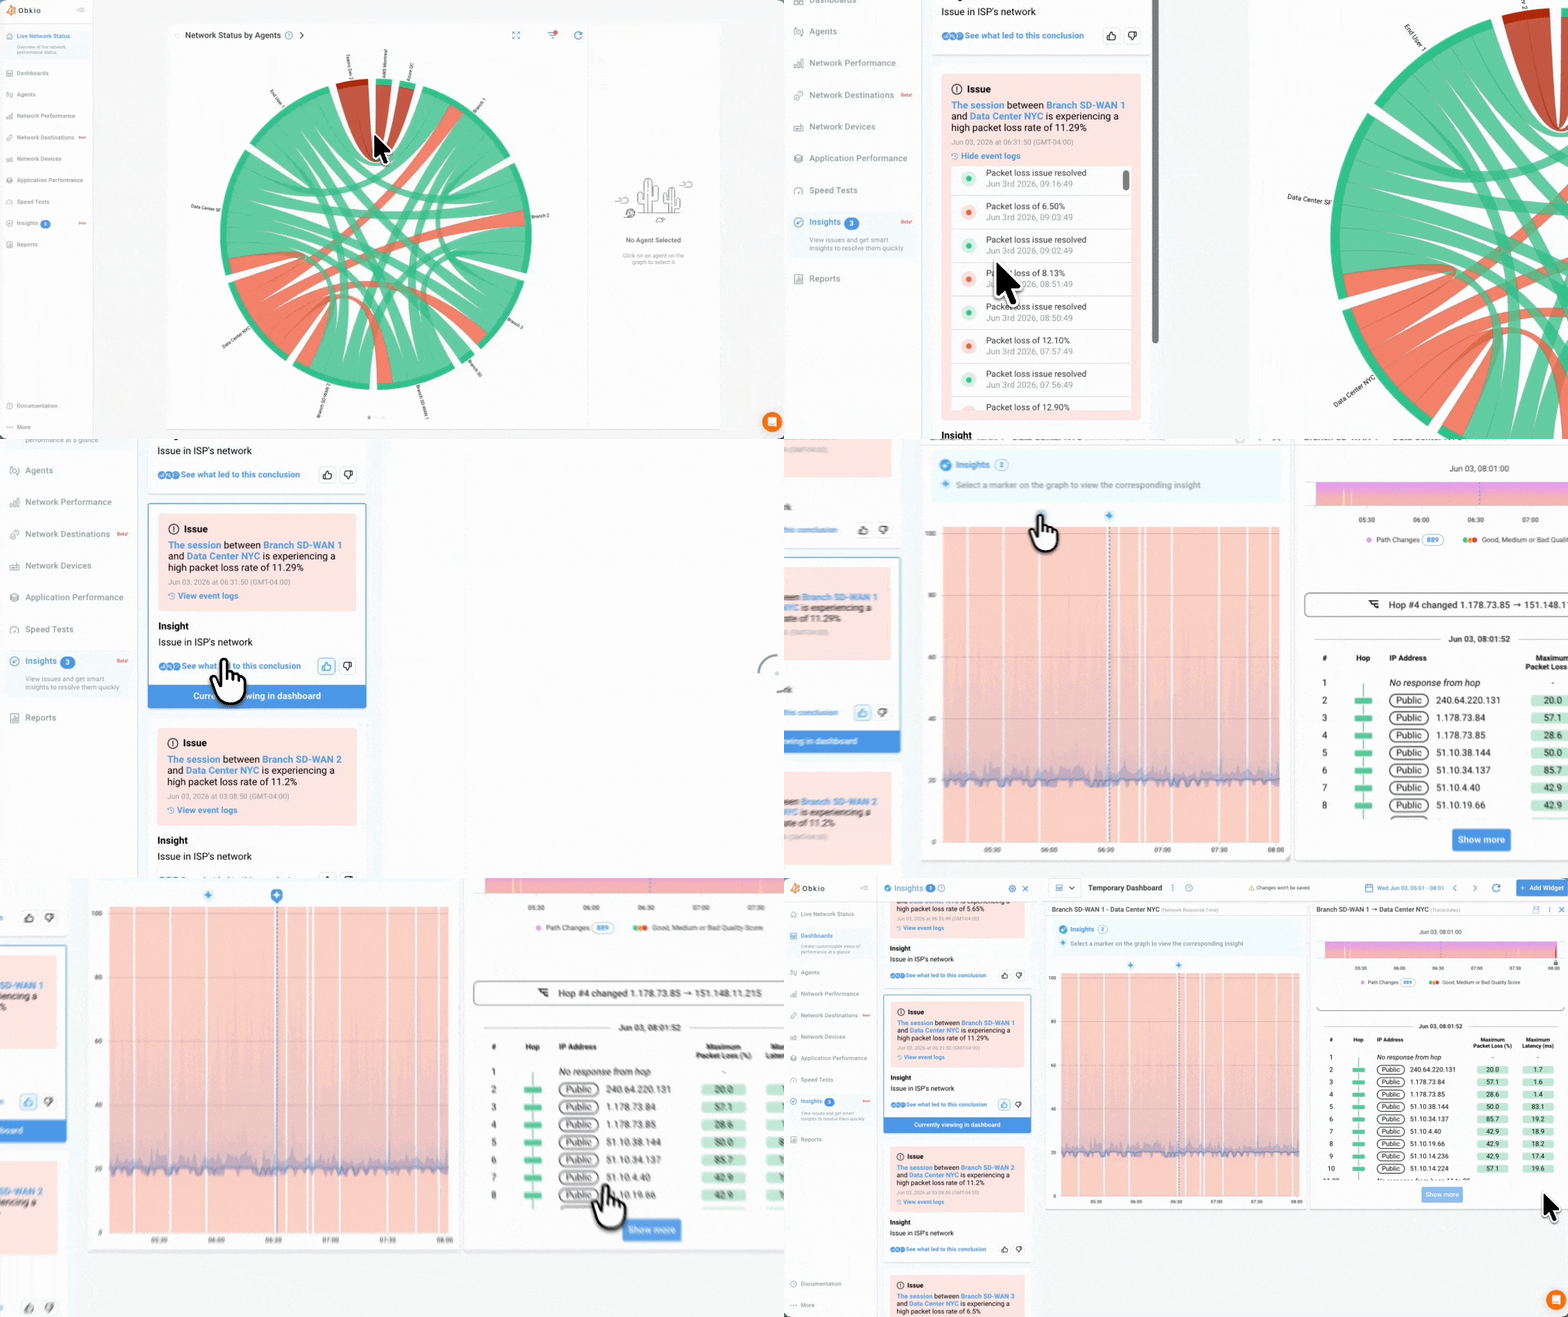 GIF from Obkio Insights: Automatic Network Diagnostics Tool
Network Monitoring vs. Network Diagnostics vs. Network Troubleshooting
These three terms are often used interchangeably, but they describe different stages of resolving a network issue:
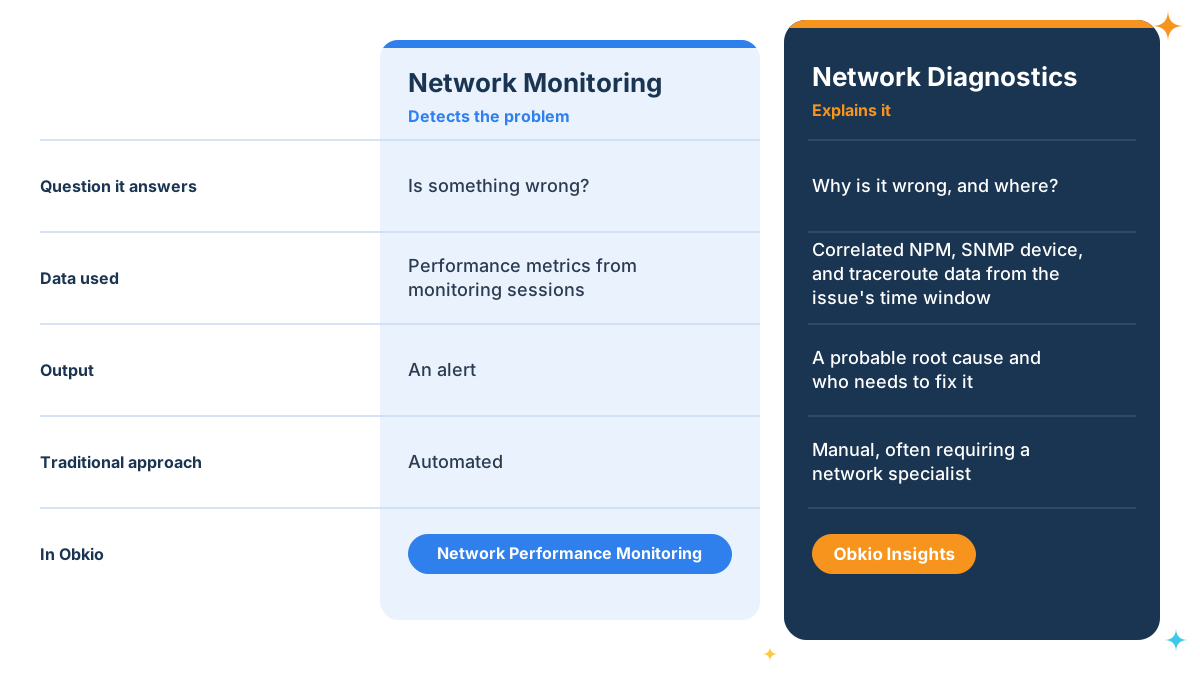
- Network monitoring detects the issue: It continuously measures network metrics like latency, jitter, and packet loss across your network, and alerts you when performance degrades.
- Network diagnostics explains the issue: It identifies the cause, where it is, and who's responsible for fixing it.
- Network troubleshooting resolves the issue: It covers the full process from investigation to fix, whether that means reconfiguring a device, upgrading a circuit, or escalating to your ISP.
In practice, the three overlap. Troubleshooting includes diagnosis, and diagnosis depends on monitoring data. The useful distinction is where the time goes. Monitoring is usually automated, and once the cause is known, the fix is often straightforward. Diagnosis is the step most teams still do by hand, which is why it usually takes the longest.
How the Network Diagnostic Process Works
When a network issue hits, the first thing you see is a symptom: a Teams call that drops, an application that slows down, a user who says "the Internet is slow." Symptoms tell you something is wrong, but not why. The same packet loss could come from a congested switch, an overloaded firewall, or a routing problem three hops into your ISP's network.

That's why network diagnostics follows a structured process rather than jumping straight to likely suspects. Checking the firewall first because it caused the last outage can work. But when it doesn't, you've lost time, and the evidence you needed may be gone if the issue was intermittent.
Whether it's done manually or automatically, a network diagnosis follows the same basic sequence. Each step narrows the problem down, from a symptom to a location to a single probable cause.
How the Network Diagnostic Process Works
Whether it's done manually or automatically, a network diagnosis follows the same basic sequence. Each step narrows the problem down until a single probable cause remains.
Detect the issue. A network monitoring tool flags a performance problem, like a spike in packet loss or latency on a specific network path. This is the starting point. Without it, diagnosis only begins once users start complaining.
Establish when it happened. Pin down the exact time window of the issue. Every piece of data used in the rest of the diagnosis has to come from that same window, or you risk chasing a cause that wasn't there at the time.
Locate where it is on the network path. Use path data, typically traceroutes, to see where performance degrades between source and destination. This tells you whether the problem is on your LAN, at the network edge, or somewhere in your ISP's network.
Identify the cause. Correlate performance data with device metrics from the same time window. For example, if latency spikes at the same moment your firewall's CPU hits 100%, the firewall is the likely cause. If your devices look healthy and the degradation starts beyond your network edge, the cause is likely with your ISP.
Determine who needs to fix it. Match the cause to its owner: your internal team, the person responsible for a specific device, or your ISP. When the issue is external, the data gathered in the earlier steps becomes the evidence you need to escalate.
The hard part is steps 2 to 4. Each one requires pulling data from a different source, lining it up against the same time window, and interpreting it correctly. For a hands-on walkthrough of each step, see our guide on how to diagnose network problems.

Learn how to diagnose network problems & optimize performance. Discover the ultimate handbook for businesses & explore the power of Obkio. Get started now!
Learn more

What Are the Metrics Behind Network Diagnostics?
A network diagnosis is only as good as the metrics behind it. Most diagnoses draw on three types of metrics, each answering a different part of the question. On its own, each gives you a partial picture. Together, they let you trace a symptom back to its cause.
1. Network Performance Metrics: Is Something Wrong?
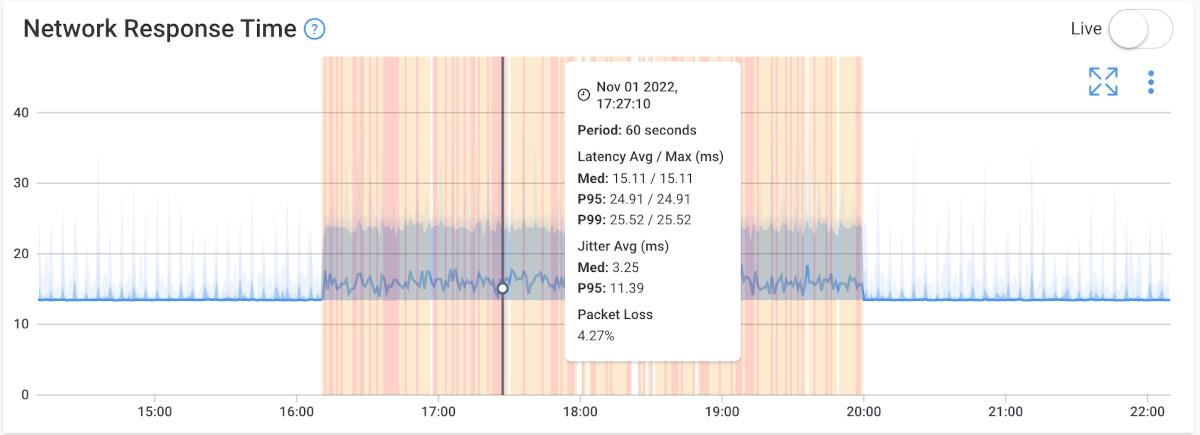
Network Performance metrics measure the quality of traffic flowing between two points in your network, like a branch office and a data center, or a remote user and a cloud application. They're usually collected by network performance monitoring, which runs continuous synthetic tests between locations. The key metrics for diagnostics are:
- Latency: the time it takes for data to travel from source to destination. Spikes slow down applications and degrade real-time traffic like VoIP and video calls.
- Packet loss: the percentage of packets that never reach their destination. Even small amounts cause choppy calls and retransmissions.
- Jitter: the variation in latency between packets. High jitter disrupts real-time applications even when average latency looks normal.
Performance metrics tell you that an issue exists and which network path it's affecting. They don't tell you what's causing it.
 Screenshot from Obkio
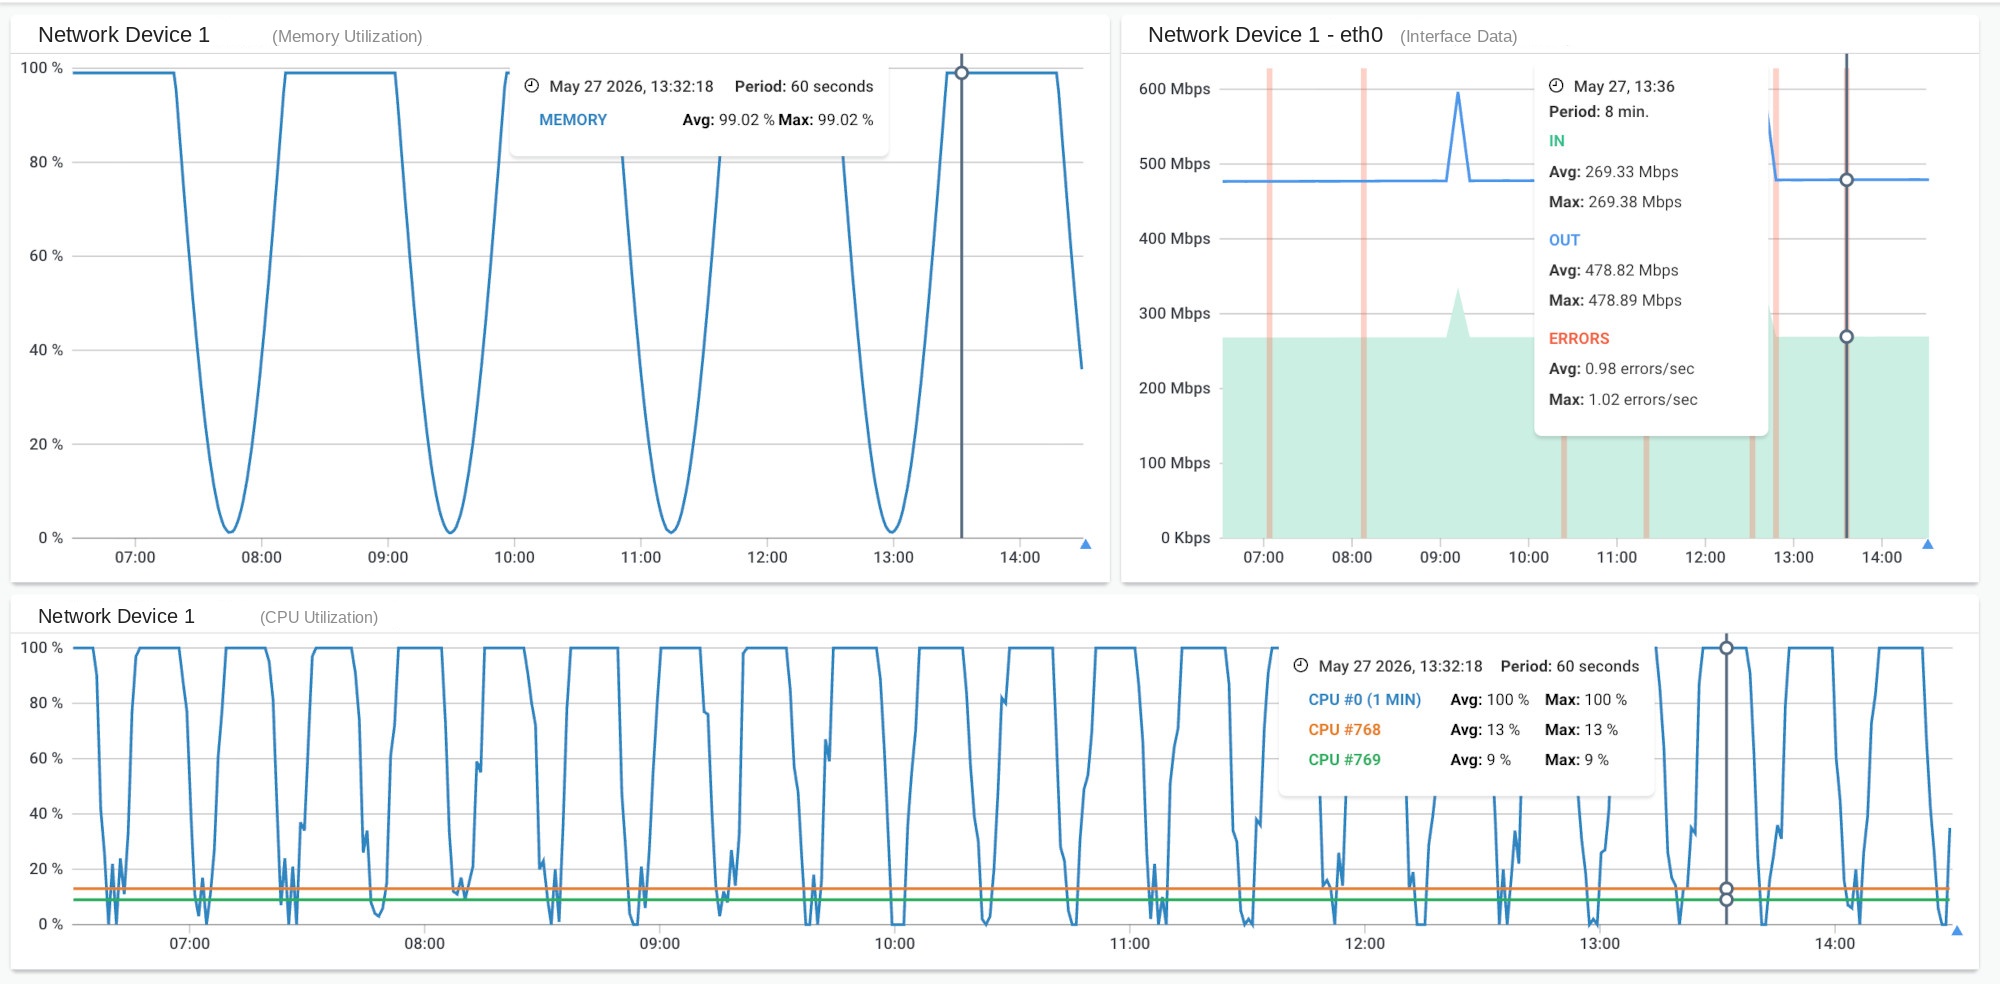
2. Network Device Metrics: Is a Device Struggling?
Device metrics come from the network equipment itself, like firewalls, routers, and switches, usually collected through SNMP monitoring. The most useful metrics for diagnostics are:
- CPU usage: a device running at or near full CPU can't process traffic in real time, which causes latency and packet loss for everything passing through it.
- Memory usage: high memory usage can slow a device down or make it unstable.
- Bandwidth usage: when an interface reaches its maximum capacity, traffic queues up or gets dropped.
- Interface errors: errors on a network interface often point to physical issues like faulty cables or duplex mismatches.
Device metrics tell you whether a specific piece of equipment is under strain. On their own, they don't tell you whether that strain is affecting users.
 Screenshot from Obkio
3. Network Path Metrics: Where Is the Problem?
Path metrics show the route traffic takes between source and destination, hop by hop, and how performance changes along the way. They're collected with traceroutes, which measure latency and packet loss at each hop.
Path metrics are what let you locate an issue: inside your LAN, at your network edge, or within your ISP's network. One thing to keep in mind is that traffic doesn't always take the same route in both directions. A traceroute from one end only shows half the picture, so running it from both ends of a path gives a more accurate diagnosis.
 Screenshot from Obkio's Visual Traceroute
Why Correlation Is What Makes a Diagnosis
Each type of metric answers one question:
- Performance metrics show that something is wrong.
- Device metrics show which equipment is struggling.
- Path metrics show where along the route the problem is.
A diagnosis comes from lining all three up against the same time window. If latency on a session spikes at the same moment path metrics show degradation at your firewall, and the firewall's CPU is maxed out, you have a probable root cause.


What Are Common Root Causes Network Diagnostics Uncovers?
Network issues can come from almost anywhere, but most performance problems trace back to a handful of locations along the network path. Knowing these common root causes, and what each one looks like in the metrics, makes it much faster to narrow down a diagnosis.
1. LAN Issues
The problem is inside your local network, before traffic ever reaches your firewall or ISP. Common causes include a congested switch, an overloaded access point, faulty cabling, or a misconfigured VLAN.
- What it looks like: path metrics show degradation between the user's device and your network edge, while performance beyond the edge looks normal.
- Who fixes it: your internal IT team.

Learn how to identify LAN issues step-by-step. Understand the signs, causes, and diagnostic tools to troubleshoot local area network problems.
Learn more
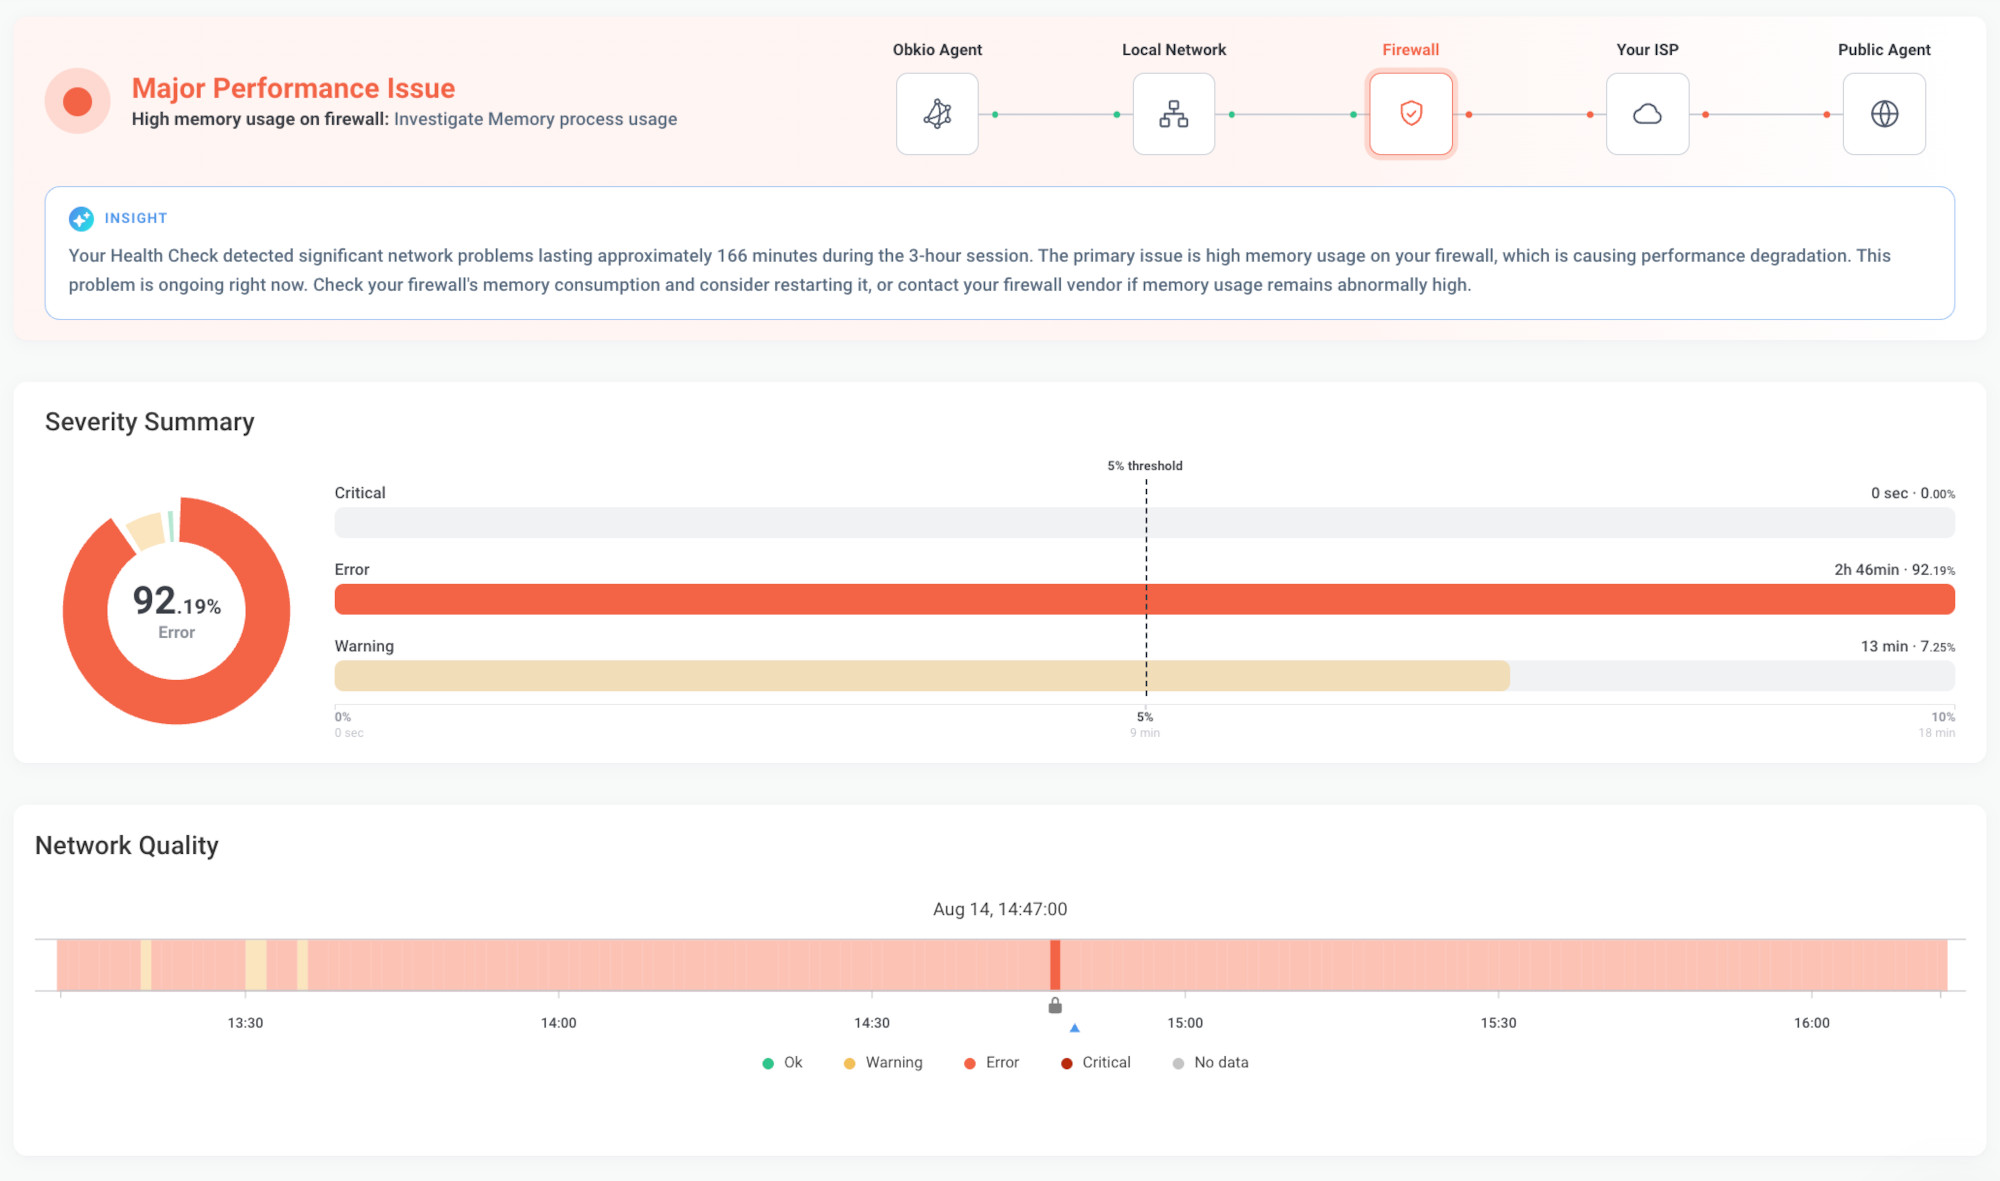
2. Firewall Performance Issues
Your firewall sits between your LAN and the Internet, so every packet leaving your network passes through it. When it runs short on resources, it can't process traffic fast enough, and every application crossing it suffers.
- What it looks like: latency and packet loss appear at the network edge, and device metrics from the same time window show the firewall under strain from high CPU, high memory, or bandwidth usage at its interface's maximum capacity.
- Who fixes it: whoever manages the firewall, whether that's your internal team or your MSP. The fix might mean adjusting configuration, reducing load, or upgrading the device.
 Screenshot from Obkio Insights
3. ISP Local Loop Issues
The local loop is the connection between your site and your ISP's network, often called the "last mile." Problems here include a degraded circuit, faulty equipment at either end of the connection, or an oversubscribed access link.
- What it looks like: path metrics show degradation starting right after traffic leaves your firewall, on the first hops into your ISP's network. Your firewall's device metrics look healthy.
- Who fixes it: your ISP.

Learn how to fix ISP local loop issues (last mile issues). Discover the most common root causes, and how to diagnose a local loop issue using Obkio Insights.
Learn more
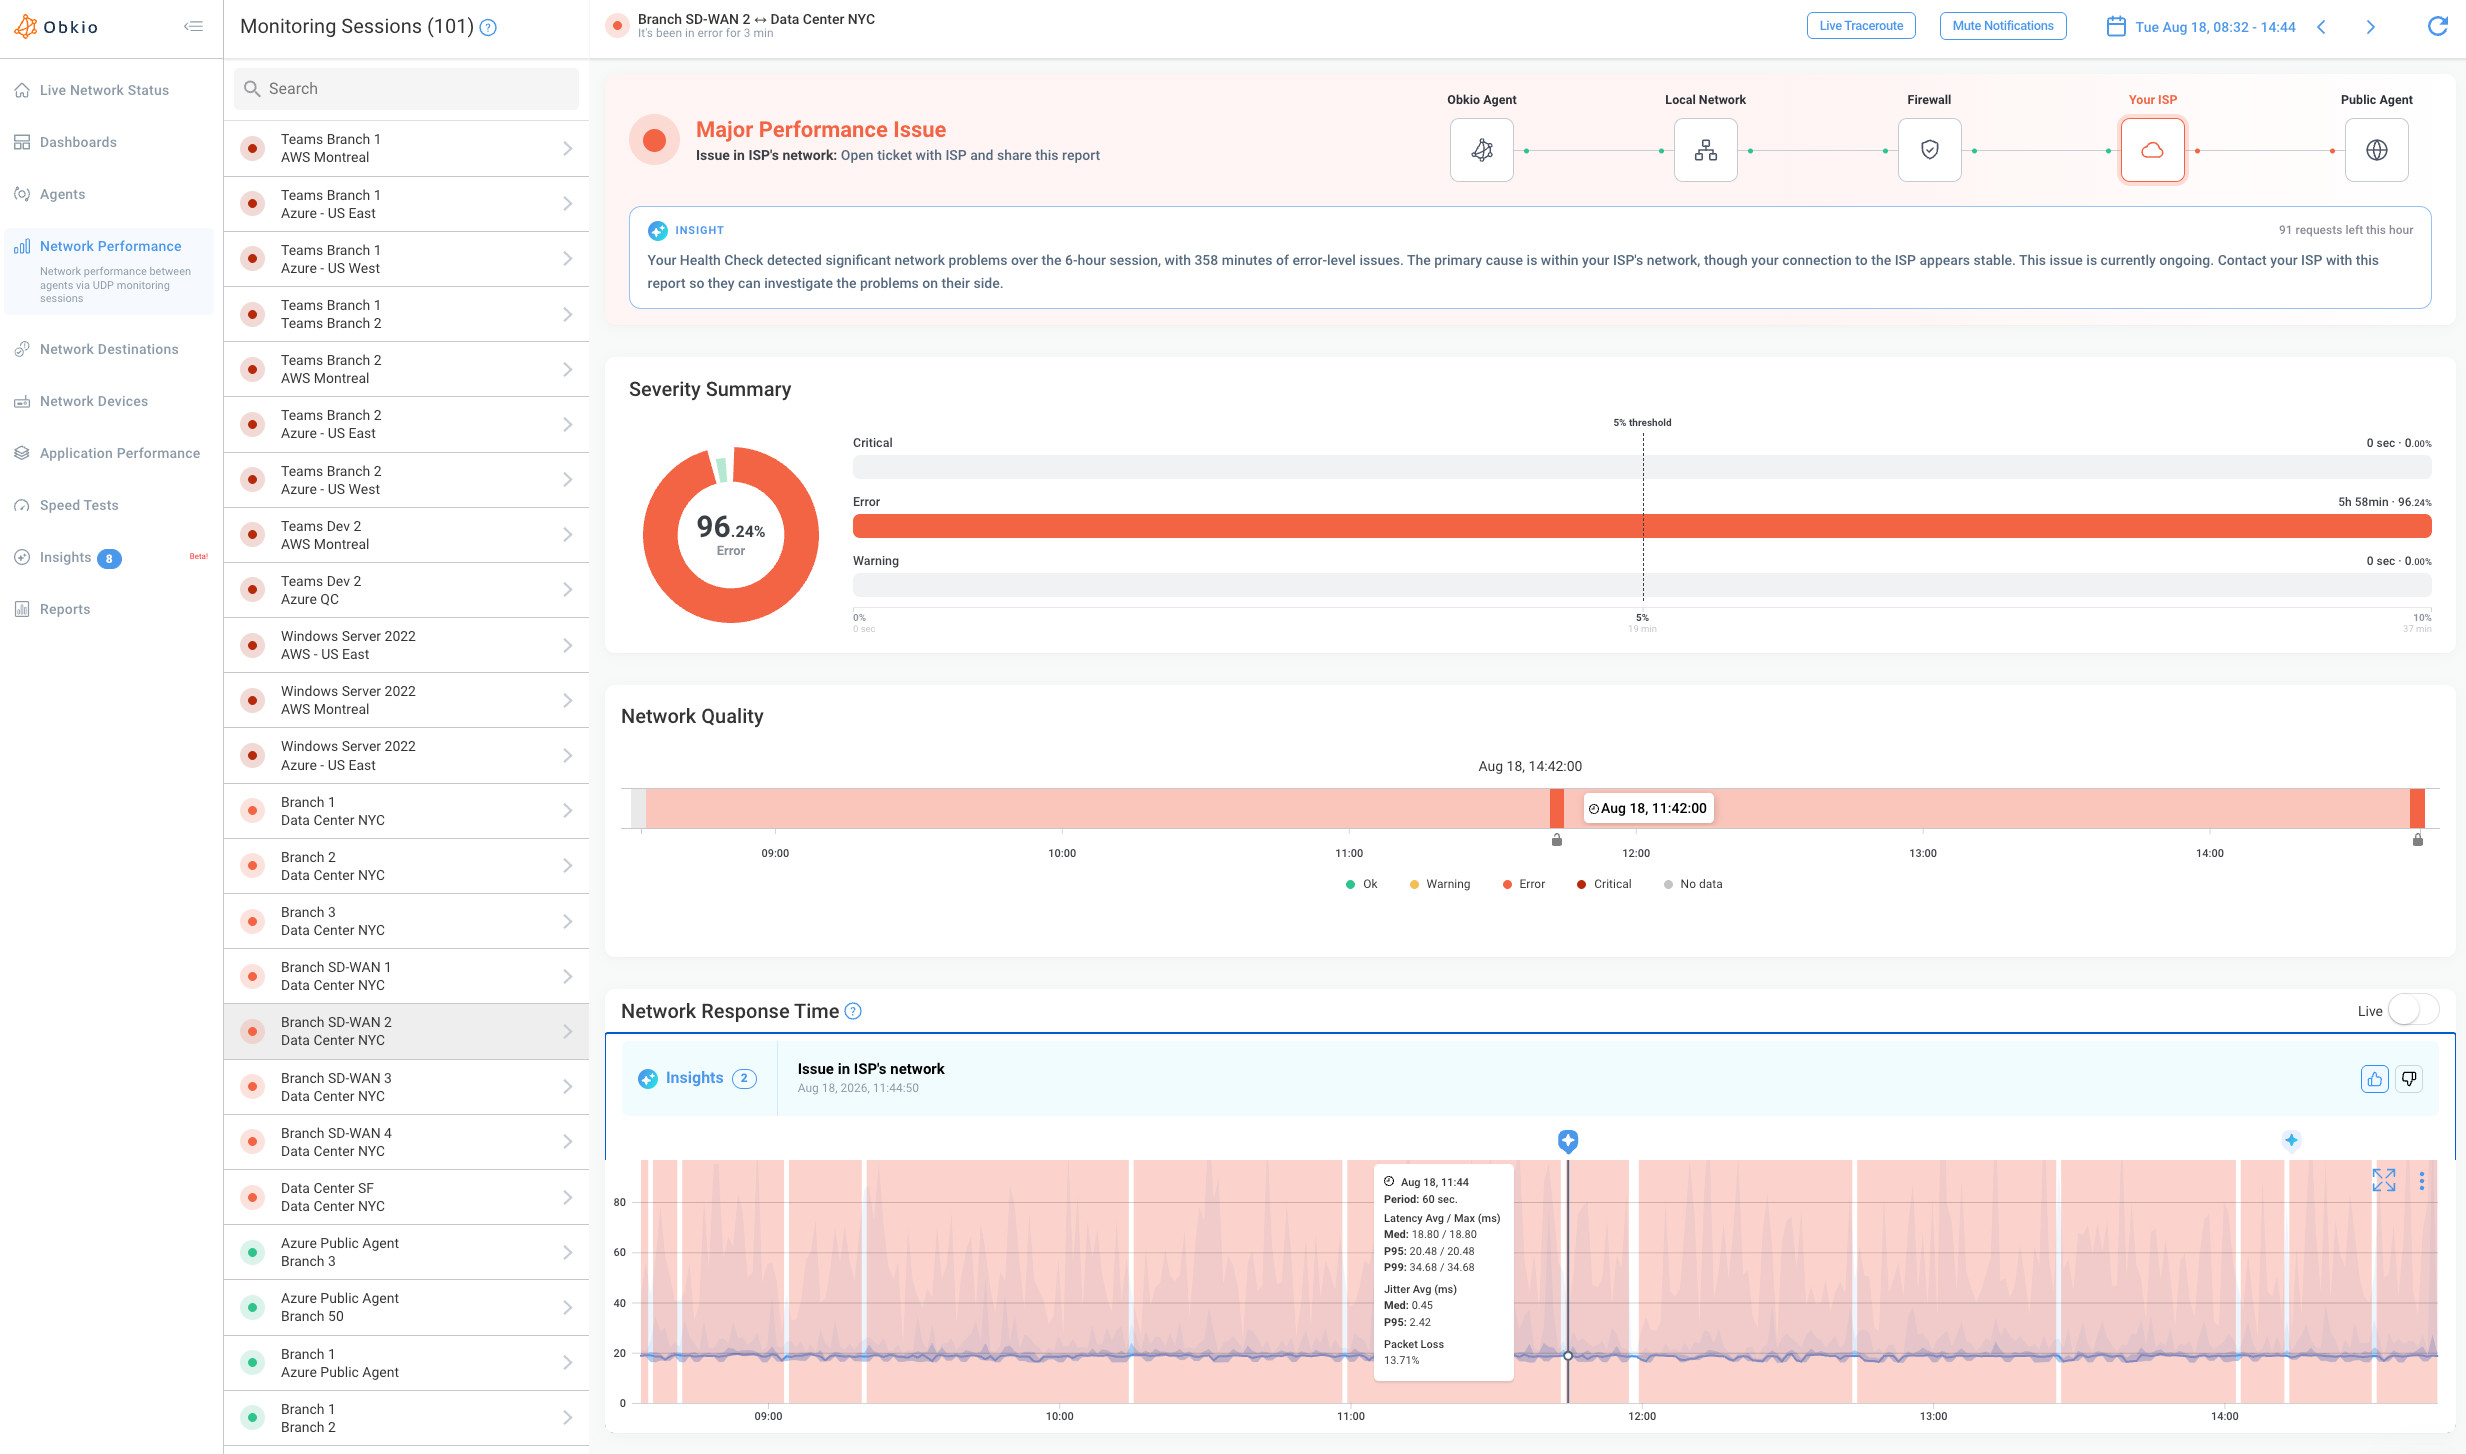
4. ISP Network Issues
The problem is deeper inside your ISP's infrastructure, beyond the local loop. Common causes of ISP Network Issues include congestion on the ISP's backbone, a routing issue, or a problem at a peering point between providers.
- What it looks like: performance is normal through your LAN, firewall, and local loop, then degrades several hops into the ISP's network.
- Who fixes it: your ISP. The path data from the time of the issue is your evidence when you open a support ticket. You can share traceroute results directly with your ISP so their engineers see the same thing you do.
 Screenshot from Obkio Insights
5. Endpoint Issues
Sometimes the network isn't the problem at all. A user's computer running at full CPU or memory can make applications feel slow and calls sound choppy, even when the network is performing well.
- What it looks like: the device itself is short on resources at the time of the issue, while path metrics show no degradation along the network.
- Who fixes it: the user, or your desktop support team.
Ruling this out early saves you from chasing a network problem that isn't there.
These five aren't the only causes of network issues. DNS problems, misconfigurations, and wireless interference also come up regularly. But together they cover most of the performance issues IT teams deal with day to day, and they're the ones where correlating metrics makes the biggest difference.
Why Manual Network Diagnostics Is Slow
Most IT teams have the tools to collect performance, device, and path metrics. The bottleneck is what happens after an issue is detected. Someone still has to gather those metrics, line them up, and interpret them. Done by hand, each step of the diagnostic process adds time, and the delays compound.
The Metrics Live in Different Places
Performance metrics come from a monitoring tool, device metrics from an SNMP poller or the device's own interface, and path metrics from traceroutes run separately. Diagnosing an issue means pulling each one up, finding the same time window in each, and comparing them side by side. Even for an experienced engineer, that's often an hour or more of work for a single issue.
Intermittent Issues Don't Wait for You
Many network issues last minutes, not hours. By the time someone starts investigating, the latency spike is over, the firewall's CPU is back to normal, and a traceroute run now shows a healthy path. Without metrics captured at the moment the issue happened, there's nothing left to diagnose until it happens again. That's why intermittent network problems are some of the hardest to resolve.
It Takes Specialist Knowledge
Reading a traceroute, interpreting device metrics, and knowing which combination points to which cause is network engineering expertise. Many IT teams don't have a dedicated network engineer, and those that do often find their specialists are strong on LAN but less familiar with WAN and ISP networks. Issues end up waiting for the one person who can diagnose them, or get escalated without a clear diagnosis.
Proving It's the ISP Is a Project of Its Own
When the cause is outside your network, a diagnosis isn't enough. You also need evidence your ISP will accept. Opening a ticket with a few pings and a traceroute often starts a back-and-forth where the ISP asks for more data, runs its own tests, and finds nothing, especially if the issue was intermittent.
Obkio's founders saw this firsthand while working with telcos: clients, telcos, and service providers pointing fingers at each other, with no one able to show where the problem actually was or who was responsible for fixing it. The tools they were using simply weren't built to answer those questions for modern networks.
The Result: Diagnosis Becomes the Longest Step
Detection is automated, and once the cause is known, the fix is often quick. Everything in between depends on someone having the time, the access, and the expertise to put the pieces together. That's the gap automatic network diagnostics was built to close.
Automatic Network Diagnostics with Obkio Insights
Automatic network diagnostics runs the same diagnostic process described above, but without waiting for someone to do it by hand. The moment an issue is detected, the metrics are gathered, lined up against the same time window, and interpreted automatically. The result is a probable root cause, ready when you open the issue.
Obkio Insights is Obkio's automatic network diagnostics engine, built directly into Obkio's network monitoring platform.
How Obkio Insights Works
A network issue is detected: Obkio's Network Performance Monitoring continuously tests performance between Monitoring Agents in every direction, and flags issues like packet loss or latency spikes as they happen.
Insights correlates the metrics: Insights pulls performance metrics, SNMP Device Monitoring metrics, and Visual Traceroutes from the exact time window of the issue, and analyzes them together.
The Insight is displayed on the issue: A probable root cause appears directly on the issue in the app, along with where the problem is and who needs to fix it.
The evidence is one click away: Each Insight links to an automatically generated diagnostic dashboard with all the correlated metrics from the time of the issue. You can verify the diagnosis yourself, or share it with your ISP.


What Obkio Insights Diagnoses
Insights identifies the root causes covered earlier in this article:
- LAN issues: degradation inside your local network.
- ISP local loop issues: degradation on the connection between your site and your ISP.
- ISP network issues: degradation deeper inside your ISP's infrastructure.
- Firewall performance issues: with SNMP Device Monitoring configured on your firewall, Insights identifies whether the cause is high bandwidth, CPU, or memory usage.
Before declaring a network issue, Insights also checks whether the Monitoring Agent itself had the resources it needed. That way, a resource-starved host isn't mistaken for a network problem.
What Changes with Automatic Network Diagnostics
Each reason manual diagnosis is slow has a direct answer:
- Metrics in different places: Insights correlates performance, device, and path metrics automatically, so there's nothing to pull together by hand.
- Intermittent issues: the diagnosis is based on metrics from the time of the issue, so it's still available after the issue is gone.
- Specialist knowledge: the Insight states the cause, location, and owner in plain terms. Any IT team member can act on it without being a network engineer.
- Proving it's the ISP: the diagnostic dashboard gives you correlated, timestamped evidence to attach to a support ticket, instead of a few pings and a traceroute.
Getting Started with Obkio Insights
If you're already monitoring with Obkio, Insights is included. Diagnostics based on Visual Traceroutes, including LAN, ISP local loop, and ISP network issues, work out of the box. To diagnose firewall issues, add SNMP Device Monitoring on your firewall and link it to your Monitoring Agent.
Learn more about Obkio's automatic network diagnostics tool.
What Are the Best Practices for Network Diagnostics?
Whether you diagnose issues manually or automatically, a few practices make every diagnosis faster and more accurate. Most of them come down to having the right metrics, from the right places, at the right time.
1. Establish a Performance Baseline
You can't spot abnormal performance without knowing what normal looks like. A network baseline records typical latency, jitter, packet loss, and device usage for each part of your network, so deviations stand out immediately. Baselines also help you separate real issues from expected patterns, like a nightly backup that always pushes bandwidth usage up.
2. Monitor from Every Key Location
An issue you don't monitor is an issue you can't diagnose. Monitor performance at every location that matters: head offices, branches, data centers, and cloud environments. End-to-end network monitoring lets you compare performance across locations, which quickly shows whether an issue is isolated to one site or affects your whole network. Adding monitoring points on the public Internet, like Obkio's Public Monitoring Agents, also tells you whether a problem is inside your network or beyond it.
3. Monitor in Both Directions
Traffic doesn't always take the same route in both directions, and an issue can affect one direction only. Monitoring each path from both ends shows you exactly which direction is degraded. It also gives your ISP a complete picture when you escalate.
4. Collect Metrics Continuously
Running tests only after a user complains means you'll miss intermittent issues entirely. Continuous monitoring captures performance, device, and path metrics as issues happen, and historical data lets you go back and diagnose issues after they've passed.
5. Monitor Your Network Edge Devices
Your firewall and core routers sit on the path of nearly all your traffic, which makes them common root causes. Monitoring their CPU, memory, and bandwidth usage with SNMP gives you the device metrics needed to confirm or rule them out. Without those metrics, a firewall issue and an ISP local loop issue can look identical.
6. Correlate Metrics Instead of Checking Them One by One
Looking at performance, device, and path metrics separately makes it easy to miss the connection between them. Line them up against the same time window, or use a tool that correlates them automatically, so the relationship between a symptom and its cause is visible at once.
7. Keep Evidence Ready for Escalation
When the cause is with your ISP, the quality of your evidence decides how fast it gets fixed. Save the metrics and path data from the time of each issue, and share them in a form your ISP can verify. A timestamped diagnosis showing exactly where performance degraded is much harder to dismiss than a description of the symptoms.
For more on building a reliable monitoring setup, see our network monitoring best practices.

FAQs About Network Diagnostics
1. What is a network diagnostic?
A network diagnostic is an investigation into a specific network issue to find its root cause. It analyzes performance metrics, device metrics, and network path data from the time of the issue to determine what's wrong, where it is, when it happened, and who needs to fix it. The term is also used more broadly to describe the process of network diagnostics as a whole.
2. Can network diagnostics be automated?
Yes. Automatic network diagnostics tools correlate performance, device, and path metrics as soon as an issue is detected, and identify a probable root cause without waiting for someone to investigate by hand. Obkio Insights, for example, analyzes NPM, SNMP Device Monitoring, and Visual Traceroutes data from the time of the issue and displays the probable root cause directly on the issue.
3. What tools are used for network diagnostics?
Common network diagnostic tools include ping for testing reachability and latency, traceroute for analyzing the network path hop by hop, SNMP monitoring for device metrics like CPU, memory, and bandwidth usage, network performance monitoring for continuous metrics like latency, jitter, and packet loss, and packet capture tools for analyzing traffic at the protocol level. Automatic network diagnostics tools combine several of these sources and correlate them for you.
4. How long does network diagnostics take?
It depends on the issue and the approach. Done manually, a diagnosis can take anywhere from minutes to days, since it requires gathering metrics from several sources and interpreting them together. Intermittent issues often take longest, because the evidence may be gone by the time anyone investigates. With automatic network diagnostics, a probable root cause is identified in seconds after the issue is detected.
5. What are the most common causes of network performance issues?
Most network performance issues trace back to a few locations along the network path: the LAN, the firewall, the ISP local loop, or the ISP's wider network. Issues on the user's own device, like a computer running out of CPU or memory, can also look like network problems. Identifying which one is responsible is the core goal of network diagnostics.
Start Diagnosing Network Issues with Obkio
Network diagnostics is the step that turns an alert into a fix, and for most IT teams, it's still done by hand. Obkio combines continuous network monitoring with automatic network diagnostics, so the root cause of an issue is identified as soon as it's detected: what's wrong, where it is, and who needs to fix it.

- Deploy Monitoring Agents in minutes, on-premises or in the cloud
- Monitor latency, jitter, and packet loss continuously across your network
- Get automatic network diagnostics with Obkio Insights
- Share diagnostic evidence with your ISP in one click
Want Us to Show You?
Book a demo and we'll walk you through how Obkio diagnoses network issues in your environment.