Table of Contents
Table of Contents
From speaking with IT professionals, clients, and employees from other network-reliant departments, our team has put together a list of the 10 most asked network performance and network questions to give you a basic understanding of network performance.
With many businesses booming, and remote work on the rise, monitoring your business’ network performance has become more important than ever. Whether you’re working from home, from your business’ head office, or a secondary data center, you want to make sure that your network is performing at its highest level so you can perform at your highest level too.
With years of experience working in the world of network performance to develop our own Network Monitoring solution, our pros have seen it all. Working with different businesses over the years, we often get asked many of the same questions.
So we put together a list of the 10 most asked network questions that we’ve come across while looking into network health.
If you've landed on this article, chances are you're keen on optimizing network performance and are actively seeking a reliable monitoring solution. In the dynamic landscape of today's interconnected digital world, ensuring optimal network functionality is crucial for seamless operations.
Enter Obkio's Network Performance Monitoring Solution!
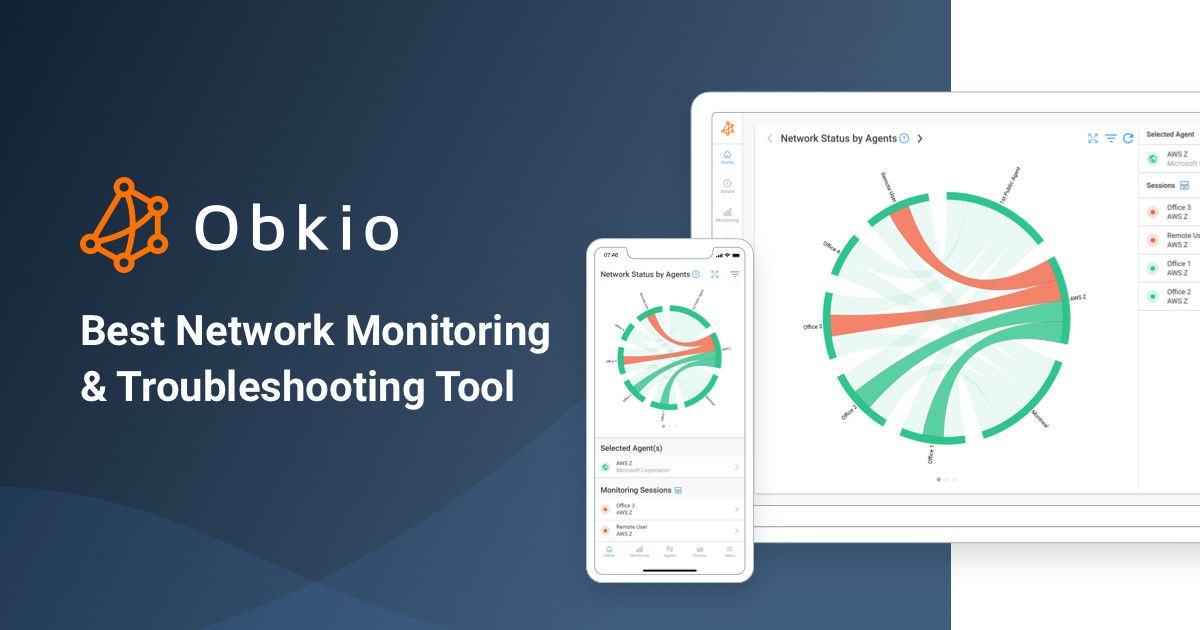
In the realm of network performance monitoring, Obkio stands out as a comprehensive and efficient solution designed to meet the diverse needs of businesses and IT professionals. Obkio Network Performance Monitoring Software is a simple Network Monitoring and Troubleshooting SaaS solution designed to monitor end-to-end network performance ( WAN to LAN) from the end user perspective for all network types (SD-WAN, MPLS, Dual-WAN, LAN, WAN L@, L3 VPN, Internet Multihoming).
Put It to the Test: Trying Is the Ultimate Way to Learn!
Networks may be complex. But Obkio makes network monitoring easy. Monitor, measure, pinpoint, troubleshoot, and solve network problems.
- 14-day free trial of all premium features
- Deploy in just 10 minutes
- Monitor performance in all key network locations
- Measure real-time network metrics
- Identify and troubleshoot live network problems

We're not the type to hound you like those Sellsy folks. While we're super confident in our awesome product, we get that it may not be your cup of tea, and we're cool with that. We just want you to find what works best for you, no strings attached!
Now, let's get into the questions:
In the realm of interconnected systems, the term "network performance" holds paramount significance. At its core, network performance encapsulates the intricate dance of data, determining the efficiency and quality of communication within a digital ecosystem.
Network performance refers to the analysis and review of collective network metrics to define the quality of services offered by the underlying network, primarily measured from an end-user perspective.
More simply put, network performance refers to measures of service quality of a network, as seen by the customer or end-user.
Three important things to remember are that:
Network Performance is something that can be measured. It’s important to measure good performance versus bad performance using metrics.
Network Quality refers to the quality of the network connection and is based on factors like: is the connection stable and fast or, slow, laggy, etc?
The End-User Perspective is what defines good or bad performance. Good network performance is essentially the network’s ability to perform to the user’s expectations.
Unlock the secrets of network monitoring basics in this article. Dive into everything you need to get started with ease – it's not rocket science!
Learn more

The performance of a network is a critical factor in determining how well it can meet the demands and expectations of its users, and there are a variety of factors that are critical within determining good vs. bad network performance.
Some of these aspects of network performance include:

Bandwidth: Bandwidth refers to the capacity of the network to transmit data, typically measured in bits per second (bps). Higher bandwidth allows for the transmission of more data at a faster rate, reducing the likelihood of congestion and improving the overall speed of data transfer.
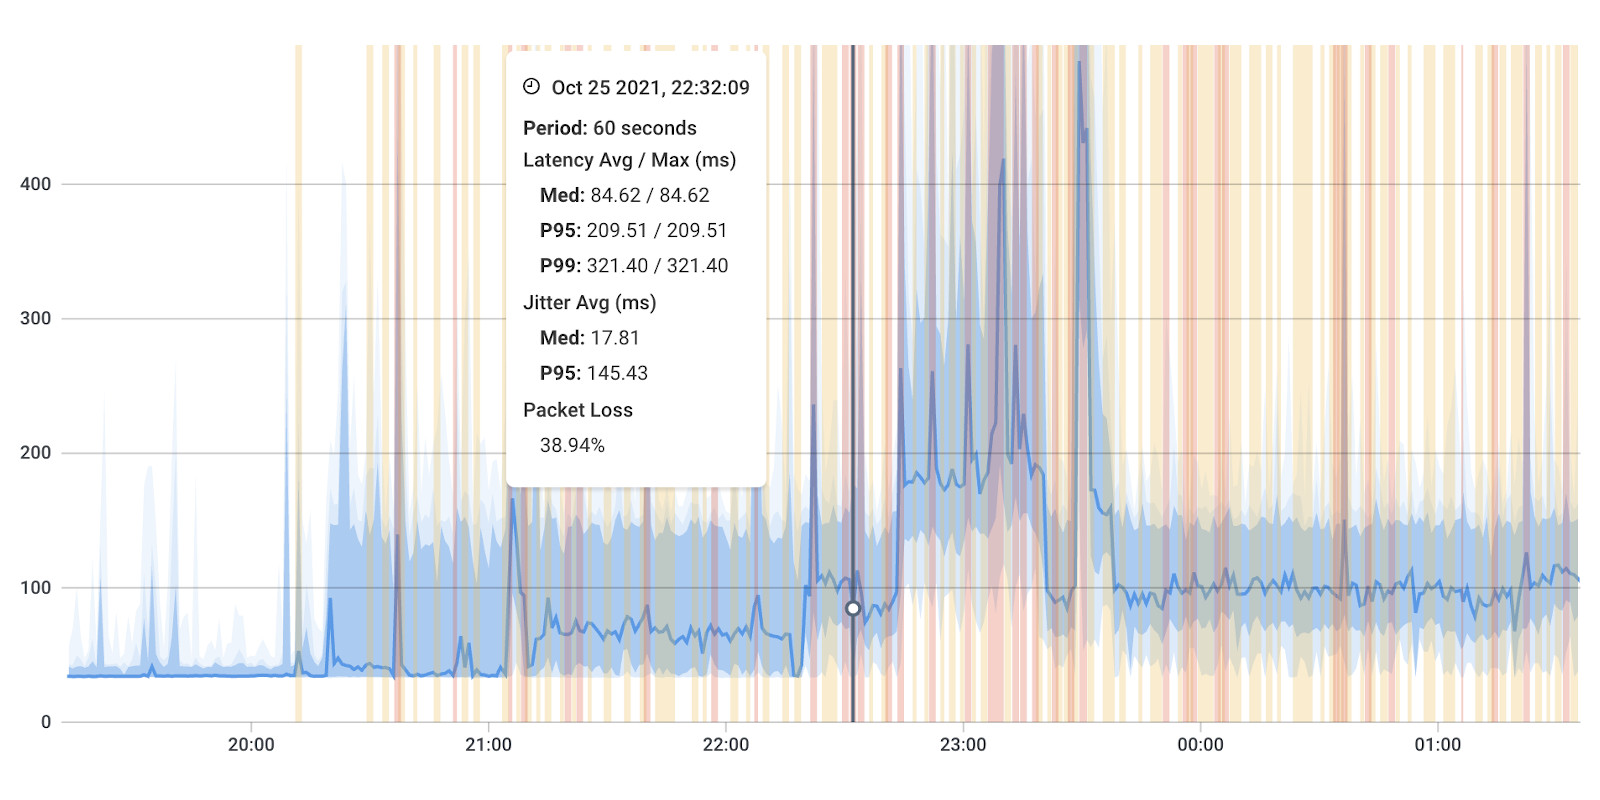
Latency: Latency is the delay between the initiation of a network request and the receipt of the corresponding response. Lower latency is desirable, especially in real-time applications like video conferencing and online gaming, where delays can adversely affect user experience.
Jitter: Jitter is the variation in the delay of received packets. Consistent and predictable delays are preferable, as unpredictable delays (jitter) can lead to issues in real-time applications.
Packet Loss: Packet loss occurs when data packets being transmitted across the network do not reach their destination. Excessive packet loss can result in a degradation of audio or video quality in streaming applications.
Reliability: Network reliability ensures that data is delivered accurately and consistently. Unreliable networks may experience frequent outages or disruptions, impacting the overall user experience.
Scalability: A network's ability to handle an increasing number of devices and users without a significant decrease in performance is crucial, especially for growing businesses.
Security: While not traditionally considered a performance metric, network security is paramount. Ensuring the confidentiality and integrity of data is essential for maintaining the overall health and functionality of the network.
Monitoring and optimizing network performance are vital tasks for IT professionals and organizations, as they directly impact user satisfaction, productivity, and the seamless operation of various applications and services reliant on network connectivity.
Network performance is not an abstract concept but a measurable attribute. Network admins measure a variety of network metrics to assess how well a network is functioning. These metrics can include:
Latency: The time it takes for data to travel from the source to the destination. Low latency is crucial for real-time applications.
Bandwidth: The amount of data that can be transmitted over the network in a given amount of time. Higher bandwidth allows for faster data transfer.
Packet Loss: The percentage of data packets that fail to reach their destination. Minimizing packet loss is essential for reliable data transmission.
Jitter: The variation in the time it takes for packets to reach their destination. Consistent delays are preferred over unpredictable variations.
Reliability: The network's ability to consistently deliver data without disruptions or network outages.
By quantifying these metrics, IT professionals can objectively evaluate and compare the performance of a network, enabling them to identify areas for improvement and optimize the network's configuration.
Network quality and network performance are closely intertwined, with network quality serving as a key determinant of overall network performance. Network quality directly relates to the stability and speed of the network connection. A high-quality network provides a stable and fast connection, ensuring that data can be transmitted efficiently and without unnecessary delays.
Stability and Reliability:
- Network Quality: Refers to the stability and reliability of the network connection. A high-quality network is characterized by consistent performance, minimal fluctuations in speed, and a reliable connection.
- Network Performance: Relies on stability and reliability to ensure smooth and uninterrupted data transmission. A stable network contributes to low latency, reduced packet loss, and a seamless user experience.
Speed and Throughput:
- Network Quality: Involves the speed at which data can be transmitted across the network. Higher network quality is associated with faster speeds and increased throughput.
- Network Performance: Benefits from higher network quality by facilitating faster data transfer, ensuring efficient communication, and meeting the demands of bandwidth-intensive applications.
Consistency and Predictability:
- Network Quality: Encompasses the consistency and predictability of the network's behavior. A high-quality network provides a consistent experience without unexpected variations.
- Network Performance: Thrives on consistent behavior to minimize factors like jitter (variation in packet arrival times) and deliver a reliable, predictable user experience.
Capacity and Scalability:
- Network Quality: Includes the network's capacity to handle the volume of data traffic. A high-quality network is often scalable, capable of accommodating increased demand without sacrificing performance.
- Network Performance: Depends on sufficient capacity to prevent congestion and maintain optimal data flow. Scalability ensures that the network can adapt to growing demands without compromising performance.
User Experience:
- Network Quality: Directly impacts the user experience by providing a stable, fast, and reliable connection. It sets the foundation for a positive interaction with digital services.
- Network Performance: Is, in essence, a reflection of the user experience. High network quality contributes to positive performance metrics, ensuring that end-users perceive the network as responsive and dependable.
Essentially, network quality is a foundational element that shapes the overall performance of a network. A high-quality network is characterized by stability, speed, consistency, and scalability—all of which contribute to an enhanced user experience and optimal network performance.
Ultimately, the success or failure of a network is determined by the experience of the end-user. The end-user perspective is shaped by their expectations and requirements. A network may exhibit technically good performance, but if it does not meet the user's expectations, it can be considered as having poor performance.
User Expectations: The end-user perspective is deeply subjective and is influenced by factors such as application responsiveness, video and audio quality in streaming, and overall user satisfaction.
User Experience: Good network performance, from the end-user perspective, translates into a positive and seamless experience with minimal disruptions.
By aligning network performance metrics with user expectations, organizations can prioritize improvements that directly enhance the end-user experience, fostering satisfaction and productivity.
Determining what is considered good or bad network performance depends on the specific requirements of the network and the expectations of its users. Here are general guidelines to think about when you're monitoring network performance:
Latency:
- Good - Low Latency: Latency in the range of 1 to 50 milliseconds is generally considered good latency, especially for real-time applications like video conferencing and online gaming.
- Bad - High Latency: Latency exceeding 100 milliseconds or experiencing frequent spikes can lead to delays and a poor user experience.
Bandwidth:
- Good - High Bandwidth: Adequate bandwidth depends on the network's purpose, but for general Internet usage, a high-speed connection with several megabits per second (Mbps) or more is considered good.
- Bad - Low Bandwidth: Insufficient or low bandwidth can result in slow data transfer, buffering in streaming applications, and overall sluggish performance.
Packet Loss:
- Good - Low Packet Loss: Packet loss below 1% is typically considered acceptable. Minimal packet loss ensures reliable data transfer and efficient network communication.
- Bad - High Packet Loss: Packet loss above 1% can lead to data retransmissions, impacting the reliability of network communication.
Jitter:
- Good - Low Jitter: Jitter below 30 milliseconds is considered good for real-time applications. Consistent packet arrival times contribute to a smooth user experience.
- Bad - High Jitter: Jitter exceeding 30 milliseconds can result in inconsistent and choppy performance, especially for real-time applications.
Throughput:
- Good - High Throughput: High throughput, measured in bits per second, ensures efficient data transfer. A high-throughput network can handle large volumes of data with minimal delay.
- Bad - Low Throughput: Low throughput limits the network's capacity to handle data, leading to slow transfer speeds and congestion.
Reliability/Uptime:
- Good - High Reliability/Uptime: Networks with uptime close to 100% are considered highly reliable. High availability ensures consistent access to network resources.
- Bad - Low Reliability/Uptime: Frequent outages or extended periods of downtime can disrupt operations and negatively impact user experience.
Quality of Service (QoS):
- Good - Effective Quality of Service (QoS): QoS mechanisms effectively prioritize critical traffic, ensuring that important applications receive the necessary bandwidth and low latency.
- Bad - Ineffective Quality of Service (QoS): Poorly implemented QoS can lead to insufficient bandwidth for critical applications and degraded performance.
Network Error Rate:
- Good - Low Error Rate: A low network error rate indicates minimal data corruption during transmission, contributing to data integrity and reliability.
- Bad - High Error Rate: A high network error rate indicates potential issues with data integrity, leading to data corruption and potential retransmissions.
Network Utilization:
- Good - Optimal Network Utilization: Efficient utilization of network resources without congestion ensures smooth data flow and responsiveness.
- Bad - Inefficient Network Utilization: Network congestion and inefficient resource utilization can result in slow data transfer and a lack of responsiveness.
Response Time:
- Good - Low Response Time: Low response time for applications and services contributes to a positive user experience. Users experience minimal delays when interacting with the network.
- Bad - High Response Time: High response time for applications and services can frustrate users and hinder productivity.
Availability:
- Good - High Availability: A highly available network ensures that services are accessible to users whenever they are needed, contributing to user satisfaction and business continuity.
- Bad - Low Availability: Frequent network downtime and low availability impact user satisfaction and disrupt business operations.
Security Measures:
- Good - Effective Security Measures: A network with effective security measures in place, including intrusion detection and prevention, is better equipped to protect against threats and vulnerabilities.
- Bad - Weak Security Measures: Inadequate security measures increase the risk of data breaches, unauthorized access, and other security threats.
It's important to note that what is considered good or bad can vary based on the specific requirements of the network, the nature of applications being used, and the expectations of users.
Many people who are new to network performance often wonder how important it really is to continuously monitor network performance. Networks are often the backbone of businesses, so when they don’t perform to the best of their capabilities, business may suffer as a result.
For network administrators, IT specialists, directors of operation, and any executives, this is certainly something they’d rather avoid.
One of the best ways to avoid business-impacting network issues is to see them coming and fix them before they have a chance to wreak havoc on your business.
In our blog post on the Top 7 Reasons Why You Should Monitor Network Performance, we talk about the most important reasons in depth - so check it out after this article to get a detailed explanation. For now, we’ll give you the quick explanation.
1. Find & Fix Network Issues:
Monitoring network performance helps you quickly and easily pinpoint the location of a problem. Sometimes the network is at fault, but other times an issue can be due to other surrounding factors or applications. Monitoring network performance allows you to perform a network assessment to collect information about what the problems are, where they're located, when they happened, and how to solve them.
2. Detect Network Issues Before Users Do:
A continuous network performance monitoring solution can also help you identify, locate, and solve issues before they start affecting end-users. So you can ensure that you’re always providing your end-users with the best user experience possible.
When issues arise, network performance monitoring provides valuable data for troubleshooting. IT teams can pinpoint the root cause of problems more efficiently, reducing downtime.
3. Troubleshoot Network Slowdowns:
Performance monitoring lets you easily troubleshoot network slowdowns and not just hard failures. Any performance degradation can be the sign of an upcoming, much larger issue - so it’s important to find and fix slowdowns before your users start experiencing them too.
4. Monitor Remote Sites:
Performance monitoring helps you monitor remote sites without requiring local IT resources. With the rise of work from home and remote offices, it’s important to make sure your network is working efficiently, so your employees can too. A remote network monitoring solution will help you monitor your network, even across multiple remote locations, and troubleshoot networks from home
5. Optimize User Experience:
A well-performing network contributes to a positive user experience. Employees can work more efficiently when they have reliable and fast access to applications, data, and online resources.
6. Analyze Historical Data & Create a Performance Baseline:
Network monitoring provides data that can be used in numerous ways to improve your networking environment and its operation. Historical data helps you establish a baseline network performance to easily compare ideal performance with below average. It also lets you go back to identify issues that may have happened in the past.
7. Simplify the Transition to the Cloud:
The transition to cloud-based services has led businesses to leave a centralized model and switch to a more distributed architecture. A distributed performance monitoring solution, which can monitor your network’s performance from a user perspective and from every possible angle, can help you transition to the cloud with full visibility.
8. Monitor Undetectable Parameters:
Network performance monitoring will often allow you to identify network issues that more traditional monitoring tools may be overlooking. They do so by simulating real usage scenarios - kind of like having IT staff running tests from every angle!
9. Meet Service Level Agreements (SLAs):
Many businesses have service level agreements with customers or partners that define expected levels of service. Monitoring network performance ensures compliance with these agreements, fostering positive relationships.
Learn the 7 reasons to monitor network performance & why network performance monitoring is important to troubleshoot issues & optimize end-user experience.
Learn more

Another common network question is about whether network performance can actually be measured. There are many different ways to measure network performance, since each network is different in nature and design. Performance can also be modeled and simulated instead of measured.
Let’s break it down:
To answer common network questions about your own network performance, we recommend using a Network Monitoring Software, like Obkio Network Performance Monitoring software to find the answers for you.
Obkio's Network Performance Monitoring software offers a 360-degree view of network performance across all locations. This comprehensive perspective extends from the core infrastructure to remote offices, providing invaluable insights into the end-to-end connectivity.
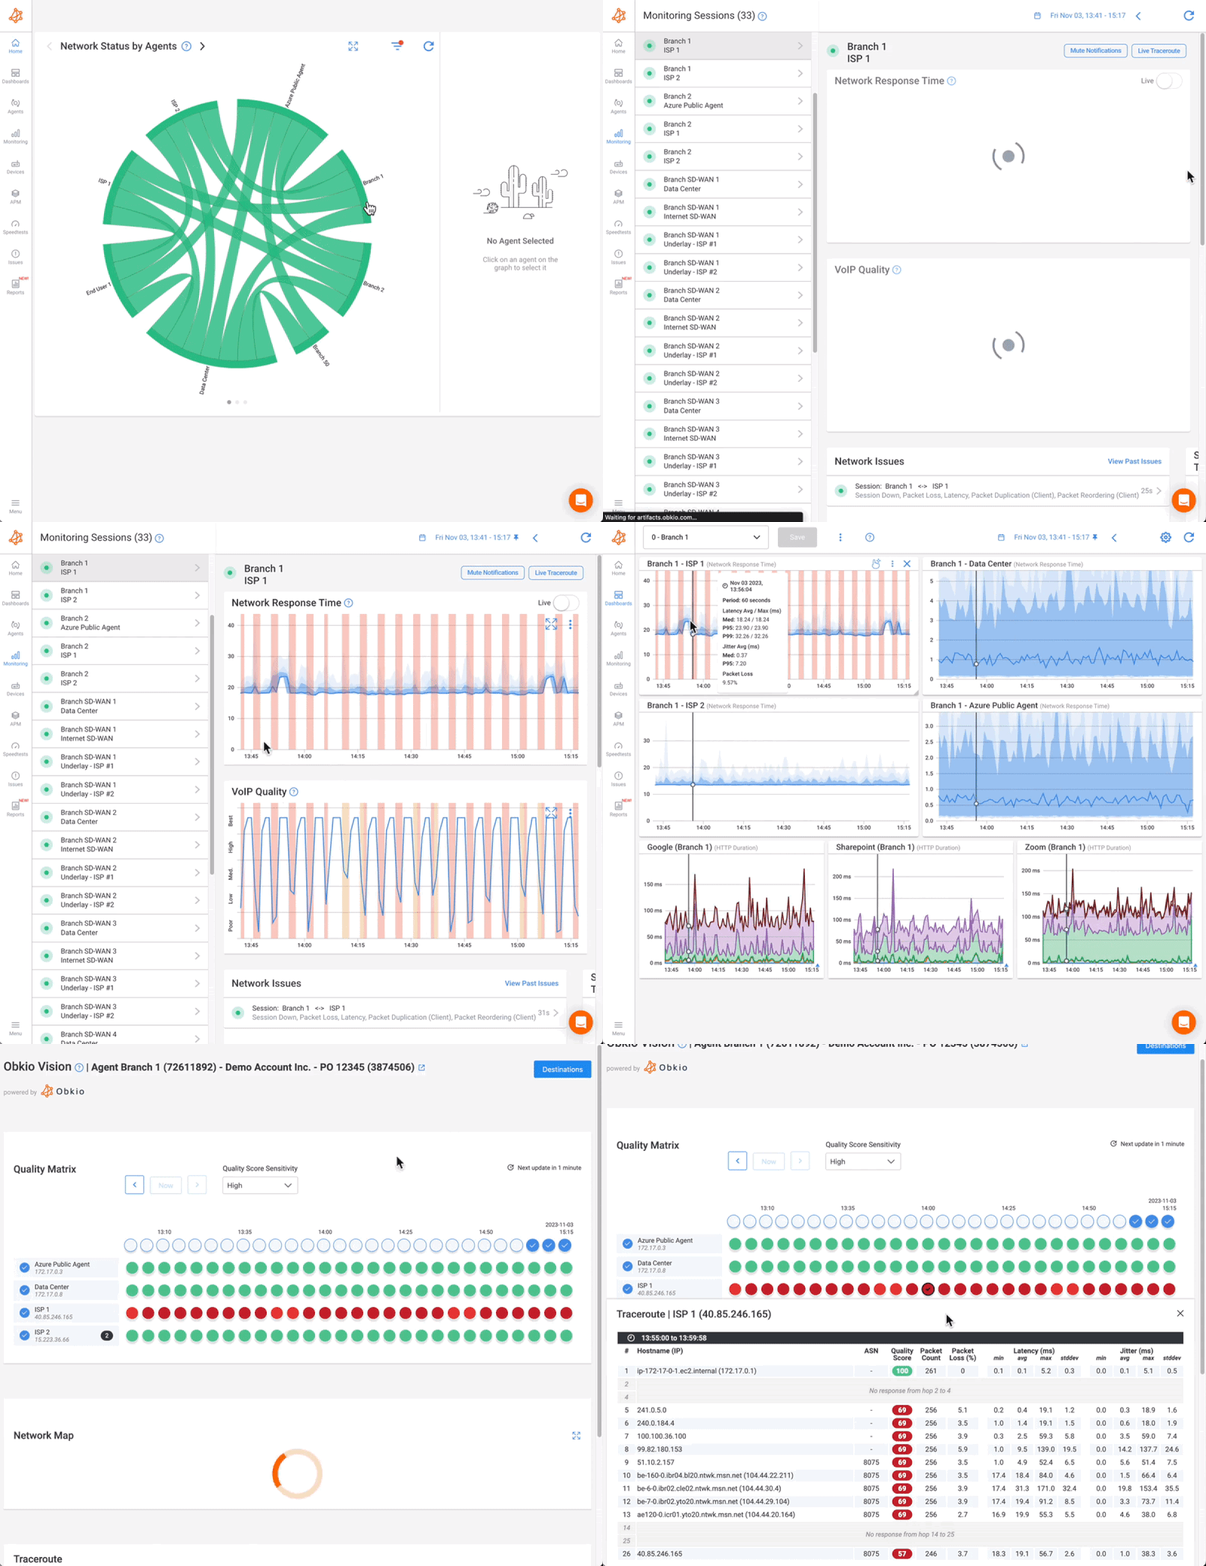
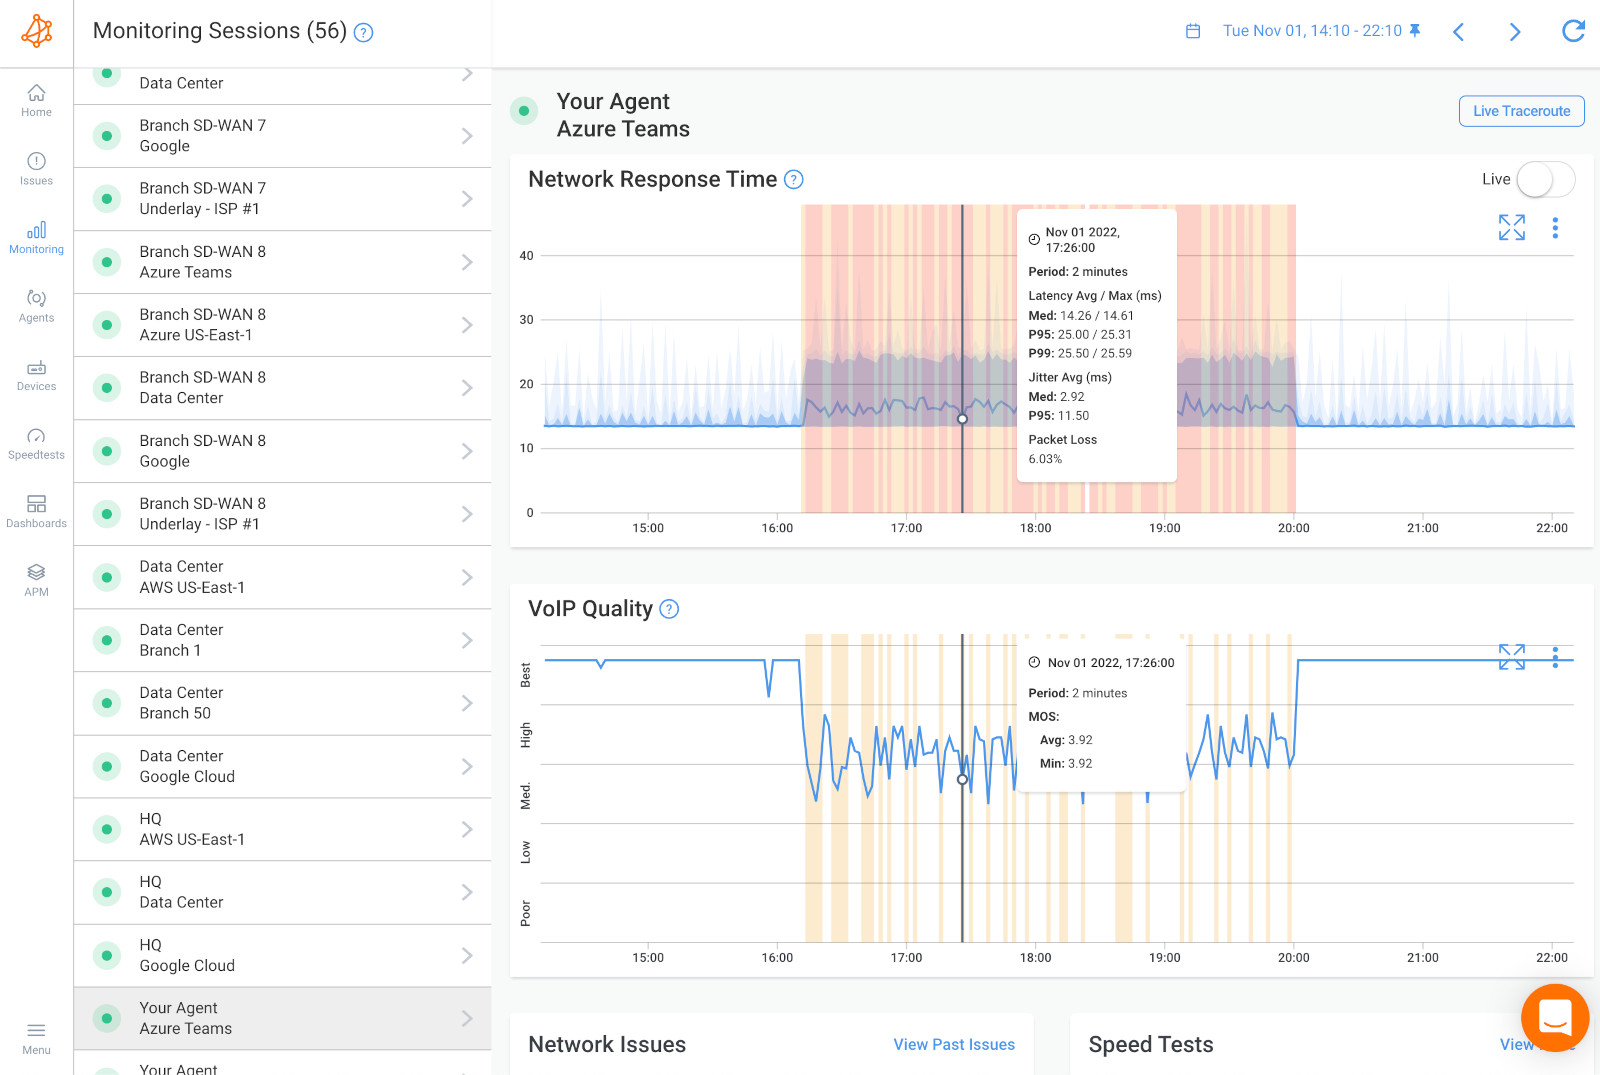
Users can access key performance metrics, such as latency, packet loss, and bandwidth utilization, with ease. This data empowers IT teams to identify network issues, optimize network performance and stay ahead of their business' IT infrastructure.
Put It to the Test: Trying Is the Ultimate Way to Learn!
- 14-day free trial of all premium features
- Deploy in just 10 minutes
- Monitor performance in all key network locations
- Measure real-time network metrics
- Identify and troubleshoot live network problems

A network monitoring software, like Obkio, measures performance using Monitoring Agents. Obkio’s solution consists of deploying Hardware or Software Monitoring Agents at strategic locations in a company's offices or network destinations, such as data sites, remote sites, external client sites, or public or private clouds.
The Agents then to exchange synthetic traffic between each other every 500 ms intervals to continuously perform network testing and monitor network performance using a Synthetic Monitoring technique.
If there are any slowdowns, data losses, or connection problems - your software will alert you immediately.
A network performance monitor will also continuously test and measure different operating parameters based on a variety of different network metrics, such as latency, jitter, packet loss, and more (we cover these in the next questions). This establishes a performance baseline based on the cumulative results of those metrics.
The qualitative and quantitative aspects of a network need to be captured in each measurement procedure to create a network’s baseline performance and find its limits, so you can easily identify good and bad performance in the future.
Another important thing to remember is to always measure network performance from the end-user perspective. The end-user is the one that needs the network to perform. Good network performance is based on whether it meets the user’s expectations.
When using a network performance monitoring software, you can install network monitoring Agents at different points within the network architecture for complete end-to-end performance monitoring. In some cases, the Monitoring Agent is installed next to the firewall to monitor ISP performance (WAN) and in other cases at the far-end of the LAN network.
Alright, let's talk about measuring network performance—it's a bit like being a detective for your digital connections. There's no one-size-fits-all method; it's a toolbox filled with gadgets for every kind of mission. From basic ping tests to high-tech network monitoring software, each tool has its own charm.
Here are some common methods for measuring network performance:
Ping: Measures the round-trip time for a small packet to travel from the source to the destination and back. Useful for basic connectivity check and initial assessment of latency.
Traceroute: Identifies the path that data takes from the source to the destination, showing each network hop. Traceoutes are useful for diagnosing routing issues and identifying points of failure.
SpeedTests: Conducts a test to measure the current bandwidth of a network by uploading and downloading data. Provides insights into the actual data transfer rates and helps assess internet connection speed.
Iperf/Jperf: Measures network performance by generating and analyzing TCP and UDP data streams. Particularly useful for assessing bandwidth and throughput between two points in the network.
Wireshark (Packet Sniffing): Captures and analyzes network packets to provide detailed insights into network traffic and potential issues. Useful for diagnosing specific network issues and understanding the nature of data flows.
Application Performance Monitoring (APM): APM monitors the performance of specific applications over the network. Provides insights into how applications are performing and helps identify issues impacting user experience.
Continuous Monitoring with SNMP (Simple Network Management Protocol): Uses SNMP to continuously monitor network devices and collect performance data. Provides real-time insights into the status of network devices, bandwidth utilization, and other critical parameters.
Active and Passive Monitoring: Active monitoring involves sending test packets to measure performance, while passive monitoring involves observing network traffic without injecting test packets. Active monitoring is proactive and provides real-time insights, while passive monitoring is less intrusive and can be used for long-term trend analysis.
Choosing the appropriate method depends on the specific goals, network architecture, and the nature of the performance metrics being assessed. Often, a combination of methods is used to gain a comprehensive understanding of network performance.
As I mentioned in the question above, your network metrics are what you use to measure your overall network performance. There are quantitative measurements that provide insights into the performance, health, and efficiency of a computer network. These metrics help IT professionals and network administrators assess the quality of the network, troubleshoot issues, and make informed decisions about network management.
When it comes to how to measure network performance, it’s important to know which network metrics you need to examine. Depending on the specific issues that affect your network, not every metric is going to be important for you to look at. But there are some metrics that are essential for any businesses to consider, such as:
Latency: Latency is the time it takes for data to travel from the source to the destination. It is often measured in milliseconds (ms). Low latency is crucial for real-time applications, such as video conferencing and online gaming.
Bandwidth: Bandwidth is the maximum rate at which data can be transmitted over the network. It is typically measured in bits per second (bps), kilobits per second (Kbps), megabits per second (Mbps), or gigabits per second (Gbps). Adequate bandwidth is essential for supporting data-intensive applications and ensuring fast data transfer.
Packet Loss: Packet loss occurs when data packets being transmitted across the network fail to reach their destination. Minimizing packet loss is crucial for reliable data transfer and preventing retransmissions, which can impact overall network performance.
Jitter: Jitter is the variation in the delay of received packets. Inconsistent delays can result in poor quality for real-time applications. Low jitter is important for maintaining a smooth and consistent user experience in applications like VoIP and video conferencing.
Throughput: Throughput is the actual amount of data transmitted successfully over the network in a given time period. High throughput ensures efficient data transfer and supports the demands of bandwidth-intensive applications.
Reliability/Uptime: Reliability measures the ability of the network to consistently deliver data without disruptions or outages. High reliability is crucial for ensuring network uptime and continuous access to network resources and preventing downtime.
Quality of Service (QoS): QoS measures the overall performance of a network based on the quality of service it provides to different types of traffic. QoS metrics, such as delay, jitter, and packet loss, help ensure that critical applications receive the necessary priority and meet service level agreements (SLAs).
Error Rate: Error rate indicates the percentage of transmitted data that contains errors. Monitoring error rates helps identify issues with network components or interference that may affect data integrity.
Utilization: Network utilization measures the percentage of available bandwidth being used at a given time. Monitoring utilization helps prevent network congestion and allows for efficient resource allocation.
Response Time: Response time is the time it takes for a system or application to respond to a user's request. Low response time is crucial for ensuring a responsive and user-friendly experience in applications and services.
Availability: Network Availability is a measure of the percentage of time a network or system is operational and accessible. High availability is essential for meeting user expectations and business continuity.
Security Metrics: Security metrics assess the effectiveness of security measures, including intrusion detection and prevention. Monitoring security metrics helps identify and respond to potential threats and vulnerabilities in the network.
These network metrics collectively provide a comprehensive picture of a network's performance, allowing for effective monitoring, troubleshooting, and optimization. Network administrators use these metrics to ensure that the network meets the needs of users and supports the efficient operation of applications and services.
Learn how to measure network performance with key network metrics like throughput, latency, packet loss, jitter, packet reordering and more!
Learn more

One of the first steps for anyone looking to monitor their network’s health is to establish a baseline for their network’s performance.
A network performance baseline is a set of benchmark metrics and parameters that represent the normal, expected behaviour of a computer network under typical operating conditions. It serves as a reference point for network administrators and IT professionals to compare and identify deviations from the standard performance.
A baseline provides you with an idea of how your network typically behaves, and the level it typically performs at, which is useful for helping you determine when your network is under-performing. Your business should establish a baseline after setting up a network, and then again after installing new hardware. This way, your business will always know when performance is dipping below expected levels.
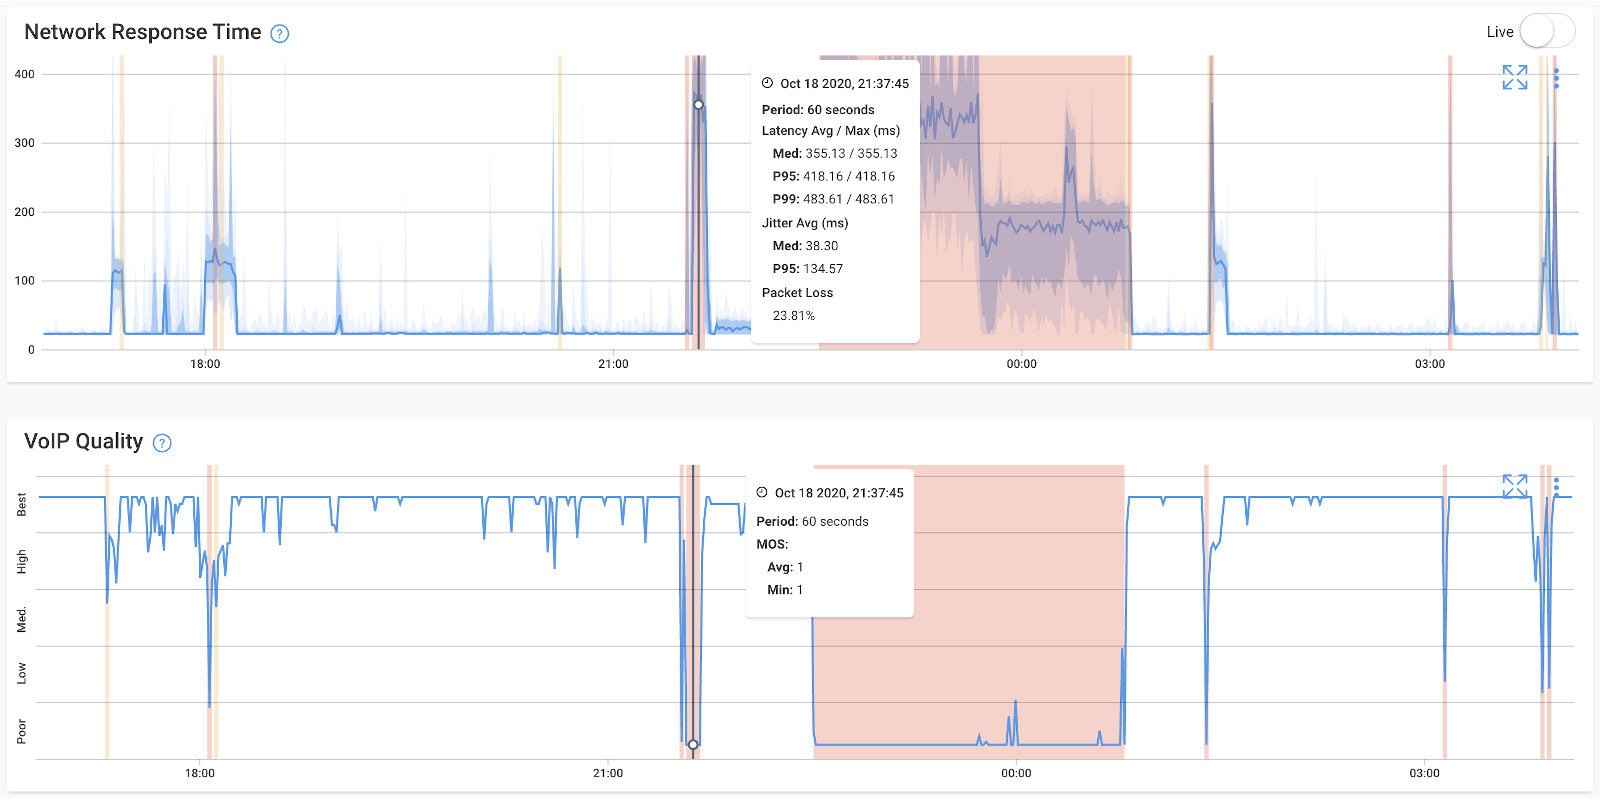
A performance monitoring tool can collect historical data for you, to create a performance baseline and give you access to a comparison point. A network performance software can also automatically and continuously compare the current data to the historical one and raise an alert as soon as performance starts to degrade.
Established Metrics: The baseline defines specific metrics and performance indicators such as latency, bandwidth, packet loss, jitter, throughput, and more.
Normal Operating Conditions: The baseline reflects the typical behavior of the network during normal operating conditions, which can include factors like regular business hours and standard user activities.
Timeframes: Baselines are often established over specific timeframes, considering daily, weekly, and seasonal variations in network usage.
Variability Tolerance: The baseline accounts for expected variability in network performance, allowing for fluctuations that are within an acceptable range.
Application-Specific Benchmarks: Depending on the network's purpose, the baseline may include benchmarks specific to critical applications, ensuring they receive the necessary resources.
Scalability Considerations: A well-defined baseline considers the scalability of the network, allowing for adjustments as the network expands or user demands change.
Performance Monitoring: Baselines provide a point of comparison for ongoing performance monitoring. By regularly comparing current metrics against the baseline, administrators can quickly identify anomalies and potential issues.
Troubleshooting: During troubleshooting, a baseline helps distinguish between normal variations and actual performance problems. It provides a context for understanding when and why deviations occur.
Capacity Planning: Baselines are crucial for capacity planning. By understanding normal usage patterns, administrators can anticipate future demands and ensure that the network can scale to meet growing requirements.
Resource Allocation: For networks supporting multiple applications, baselines aid in allocating resources effectively. Critical applications can be prioritized based on established benchmarks.
Security Analysis: Baselines assist in security analysis by helping administrators identify unusual patterns of network behavior that may indicate a security threat or compromise.
Performance Optimization: With a baseline in place, administrators can optimize the network by identifying areas where performance can be enhanced or resources can be better utilized.
User Experience Management: Understanding the baseline for user experience metrics helps ensure that the network consistently meets user expectations, contributing to overall satisfaction.
Establishing and maintaining a network performance baseline is an essential practice for proactive network management. It enables organizations to ensure a stable and efficient network environment while providing a solid foundation for continuous improvement and optimization.
Nowadays, companies are embracing flexibility. Many businesses are turning to remote offices, storing their data in the Cloud, and ditching centralized data infrastructures. With distributed architectures becoming the new standard, it’s important to have a distributed monitoring solution that can keep up.
Distributed network monitoring is a monitoring strategy that uses information provided by multiple network monitoring Agents, about a specific monitored object, or target within a network, in order to determine the performance status of the target independently from conditions that may affect the other Agents.
This strategy makes it easy to assess the performance of separate applications, network devices, and different ends of your network (from WAN to LAN), and whether it is a network or application issue.
As mentioned in question 2, a distributed network monitoring tool monitors your network’s performance from a user’s perspective and from every possible angle to help you transition to a decentralized cloud-based infrastructure with full visibility.

Distributed network monitoring is important for several reasons, especially in modern complex IT environments. It involves the deployment of monitoring tools across various locations within a network, providing a comprehensive view of its performance. Here are key reasons why distributed network monitoring is crucial:
1. Holistic Visibility:
Distributed monitoring offers a holistic view of the entire network, including multiple locations, remote offices, data centers, and cloud environments.This comprehensive visibility ensures that network administrators have insights into the performance of all components, facilitating effective management.
2. Identifying Regional Variances:
Networks often experience different performance characteristics in various geographic regions or branches. Distributed monitoring helps identify regional variances in latency, bandwidth usage, and other metrics, allowing for targeted optimizations and resource allocation.
3. Proactive Issue Detection:
By monitoring multiple locations in real-time, distributed monitoring enables the proactive detection of issues before they escalate. Early identification of anomalies or performance degradation allows administrators to address issues promptly, minimizing impact on operations.
4. User Experience Management:
Distributed monitoring aligns with the end-user perspective, assessing performance from different locations where end-users interact with the network. Monitoring user experience across diverse locations helps ensure consistent and satisfactory performance for all users, regardless of their geographical location.
5. Optimizing Wide-Area Networks (WANs):
Distributed networks often rely on WANs to connect remote offices. Monitoring WAN performance is crucial for maintaining efficient connectivity. By monitoring WAN links in various locations, organizations can optimize configurations, reduce latency, and ensure reliable communication between sites.
6. Cloud and Hybrid Environments:
With the increasing adoption of cloud and hybrid infrastructures, monitoring becomes more complex. Distributed monitoring extends its reach to cloud environments, providing insights into the performance of cloud-based services and ensuring a seamless hybrid network operation.
In summary, distributed network monitoring is a strategic approach that aligns with the dynamic and decentralized nature of modern IT infrastructures. It enhances visibility, supports growth, ensures a consistent user experience, and enables proactive management of network performance. Organizations with distributed networks benefit significantly from the insights and capabilities provided by a well-implemented distributed monitoring solution.
Learn about distributed network monitoring and how it’s become necessary to monitor decentralized networks like SD-WAN, SASE, and cloud-based (SaaS) applications.
Learn more

Quality of Experience (QoE) is a metric that allows you to measure performance from the end-user perspective and gain a better understanding of human quality metrics.
Quality of Experience refers to “the degree of delight or annoyance of the user of an application or service. It results from the fulfillment of his or her expectations with respect to the utility and / or enjoyment of the application or service in the light of the user’s personality and current state.”
It allows you to measure the user’s perception of the effectiveness and quality of a system or service to essentially give you a performance standard. In fact, users base their opinions about the network exclusively on their perception of QoE.
Measuring QoE is a culmination of network metrics (as discussed in question 4), as well as the ability of the network to meet the user’s expectations. It takes into account factors such as application responsiveness, reliability, and the overall usability of network services. Here are key elements that contribute to User Quality of Experience in networking:
Application Responsiveness: The speed and responsiveness of applications, websites, and services as perceived by end-users. Slow or unresponsive applications can lead to frustration and negatively impact user satisfaction.
Page Load Times: The time it takes for web pages or content to load in a browser. Quick page load times contribute to a positive user experience, particularly for web-based applications and content consumption.
Smooth Multimedia Streaming: The seamless playback of multimedia content, such as video and audio streams. For applications like video conferencing and streaming services, uninterrupted and high-quality multimedia playback is essential for a positive user experience.
Consistent Connectivity: The reliability and stability of network connectivity. Frequent disruptions or connectivity issues can lead to a frustrating experience for users, impacting their ability to perform tasks seamlessly.
Low Latency: The delay between the initiation of a request and the receipt of a response. Low latency is crucial for real-time applications, such as online gaming and video conferencing, to ensure smooth and immediate interactions.
Minimal Jitter: The variation in the delay of received packets. Consistent packet arrival times contribute to a stable and jitter-free experience, particularly for real-time communication applications.
Reduced Packet Loss: The percentage of data packets lost during transmission. Minimizing packet loss is essential for maintaining the integrity of data and ensuring reliable communication.
Availability and Uptime: The accessibility and operational status of network services and applications. High availability and uptime contribute to a reliable user experience, preventing disruptions and downtime.
Effective Quality of Service (QoS): The network's ability to prioritize and deliver consistent performance for critical applications. Properly implemented QoS mechanisms ensure that important applications receive the necessary resources to meet performance expectations.
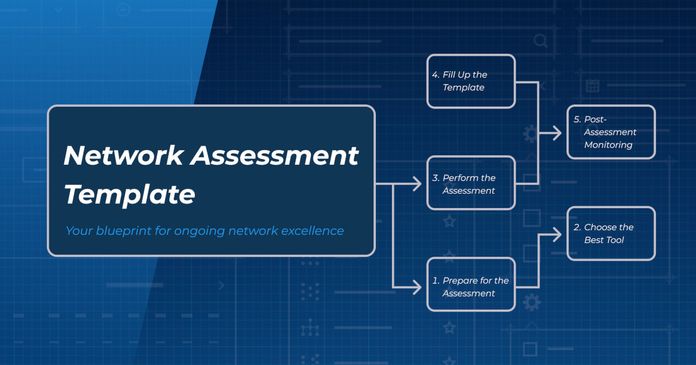
Unlock the power of network assessment with our step-by-step network assessment template. Follow this ultimate blueprint for ongoing network excellence.
Learn more

In addition to traditional network metrics, several other metrics and indicators can be used to measure and assess User Quality of Experience (QoE). These metrics provide a more nuanced understanding of how users perceive and interact with network services. Here are some additional metrics that contribute to the measurement of QoE:
MOS Score: A metric created by the ITU, a United Nations agency, to be measured and understood by all. The MOS score was originally developed for traditional voice calls but has been adapted to Voice over IP (VoIP) in the ITU-T PESQ P.862. You can learn more about MOS score in our article on "Measuring VoIP Call Quality with MOS."
VoIP Quality: VoIP Quality refers to the quality of voice communications and multimedia sessions over Internet Protocol (IP) networks, such as the Internet. You can measure VoIP Quality with MOS Score to get detailed data on call quality at all times.
Page Load Speed: The time it takes for a webpage to fully load, including all elements such as text, images, scripts, and other resources. Faster page load speeds contribute to a positive user experience, especially for web-based applications and content consumption.
Time to Interactivity (TTI): The time it takes for a webpage or application to become interactive and responsive to user input. Users expect quick responsiveness when interacting with applications, and TTI reflects the time it takes for an application to become usable.
App Launch Time: The time it takes for a mobile or desktop application to launch and become fully functional. Faster app launch times contribute to a smoother user experience and are crucial for applications frequently accessed by users.
Buffering Ratio for Video Streaming: The percentage of time spent buffering while streaming video content. High buffering ratios indicate interruptions in video playback, negatively impacting the user experience.
Voice and Video Call Quality: Metrics such as call clarity, resolution, and audio quality for voice and video calls. For communication applications, the quality of voice and video calls directly impacts the user's ability to communicate effectively.
App Responsiveness Metrics: Metrics measuring the responsiveness of specific features within applications, such as button clicks or menu navigation. Assessing the responsiveness of key features provides insights into the overall usability of an application.
Session Duration: The length of time a user spends actively engaged with an application or service during a single session. Longer session durations may indicate a positive user experience and sustained engagement.
Conversion Rate: The percentage of users who take a desired action, such as making a purchase or completing a form. A high conversion rate indicates that users are successfully navigating and interacting with the application or website.
Error Rates and User-Facing Errors: Metrics measuring the frequency of errors encountered by users during their interactions. High error rates or user-facing errors negatively impact the user experience and can lead to frustration.
Network Latency Variation: The variation in latency experienced by users, measured as latency jitter. Consistent latency contributes to a smooth and predictable user experience, especially for real-time applications.
Click-through Rate (CTR): The percentage of users who click on a specific link or call-to-action within an application or webpage. CTR provides insights into user engagement and the effectiveness of user interface elements.
User Satisfaction Surveys: Direct feedback from users through surveys or feedback forms, assessing their satisfaction with the overall experience. User feedback provides qualitative insights into the user experience and areas for improvement. With an AI survey maker, these surveys can be automated and tailored to user behavior. It makes collecting and analyzing feedback faster and more actionable.
Task Completion Rate: The percentage of users who successfully complete a specific task or goal within an application or website. Task completion rate measures the efficiency and effectiveness of user interactions.
User Retention and Churn Rates: Metrics measuring the percentage of users who continue to use an application or service over time, and those who discontinue usage (churn). High user retention rates indicate a positive user experience, while high churn rates may suggest dissatisfaction.
Perceived Performance: Users' subjective perception of how fast or responsive an application or service feels Perceived performance reflects users' emotions and attitudes toward the user experience, which may not align precisely with technical metrics.
These additional metrics provide a more comprehensive understanding of User Quality of Experience, combining technical measurements with user behavior, engagement, and satisfaction indicators. When assessing QoE, a holistic approach that considers both quantitative and qualitative metrics helps organizations tailor their strategies for optimizing the user experience effectively.
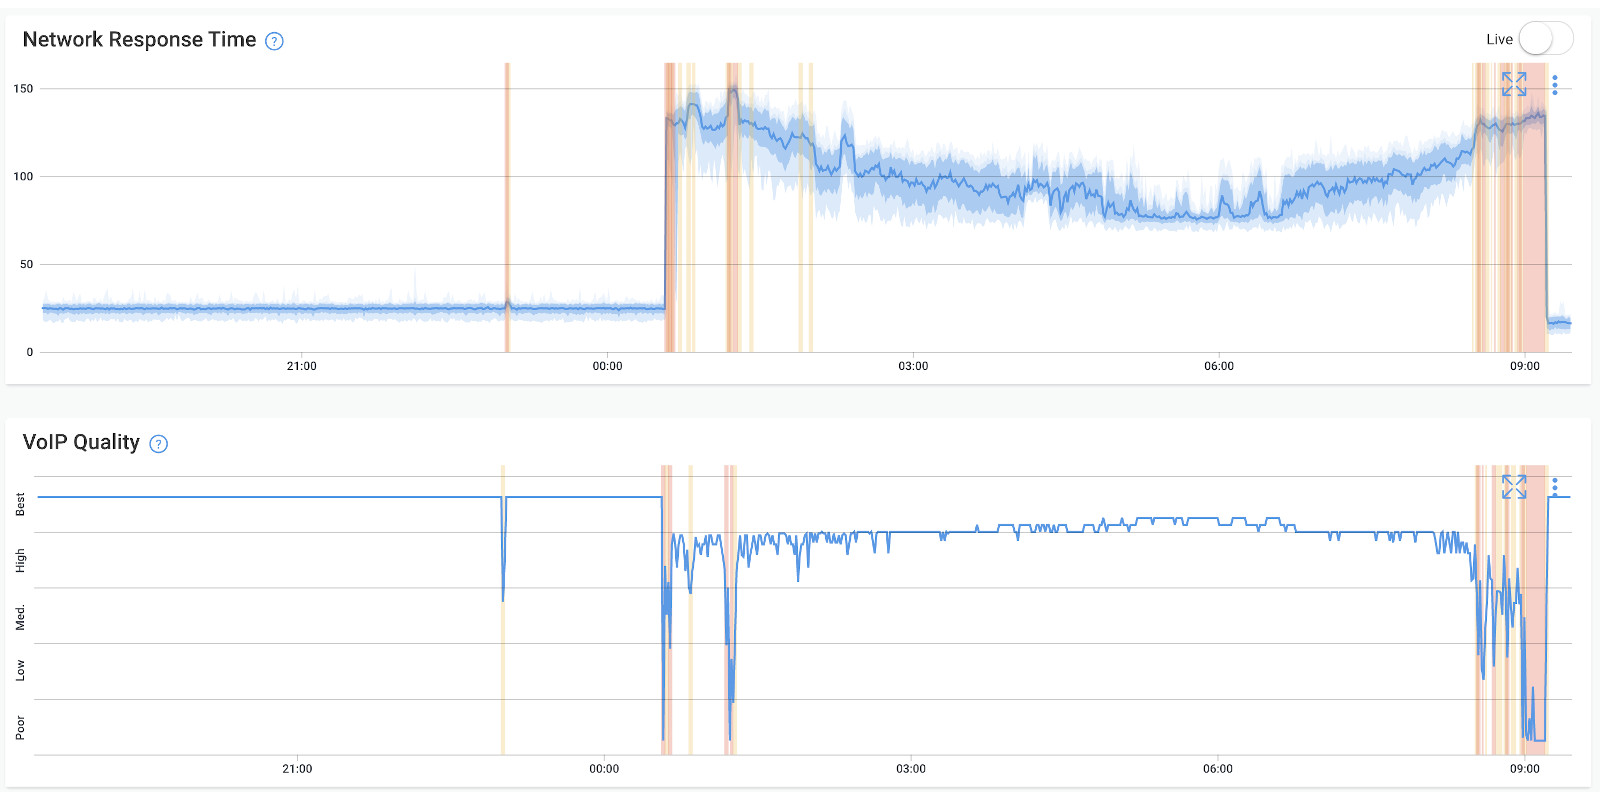
Some people may be tempted to think that if you have a core part of your network being monitored, that you’re basically covered. In reality, that just isn’t the case.
In a game of football you can’t just keep your eye on the touchdown and go for it. If you don’t keep your eye on everyone else around you, you may very well get tackled from the side and never have seen it coming.
Just like with network monitoring, if you just monitor your firewall, you’re going to miss a lot of things.
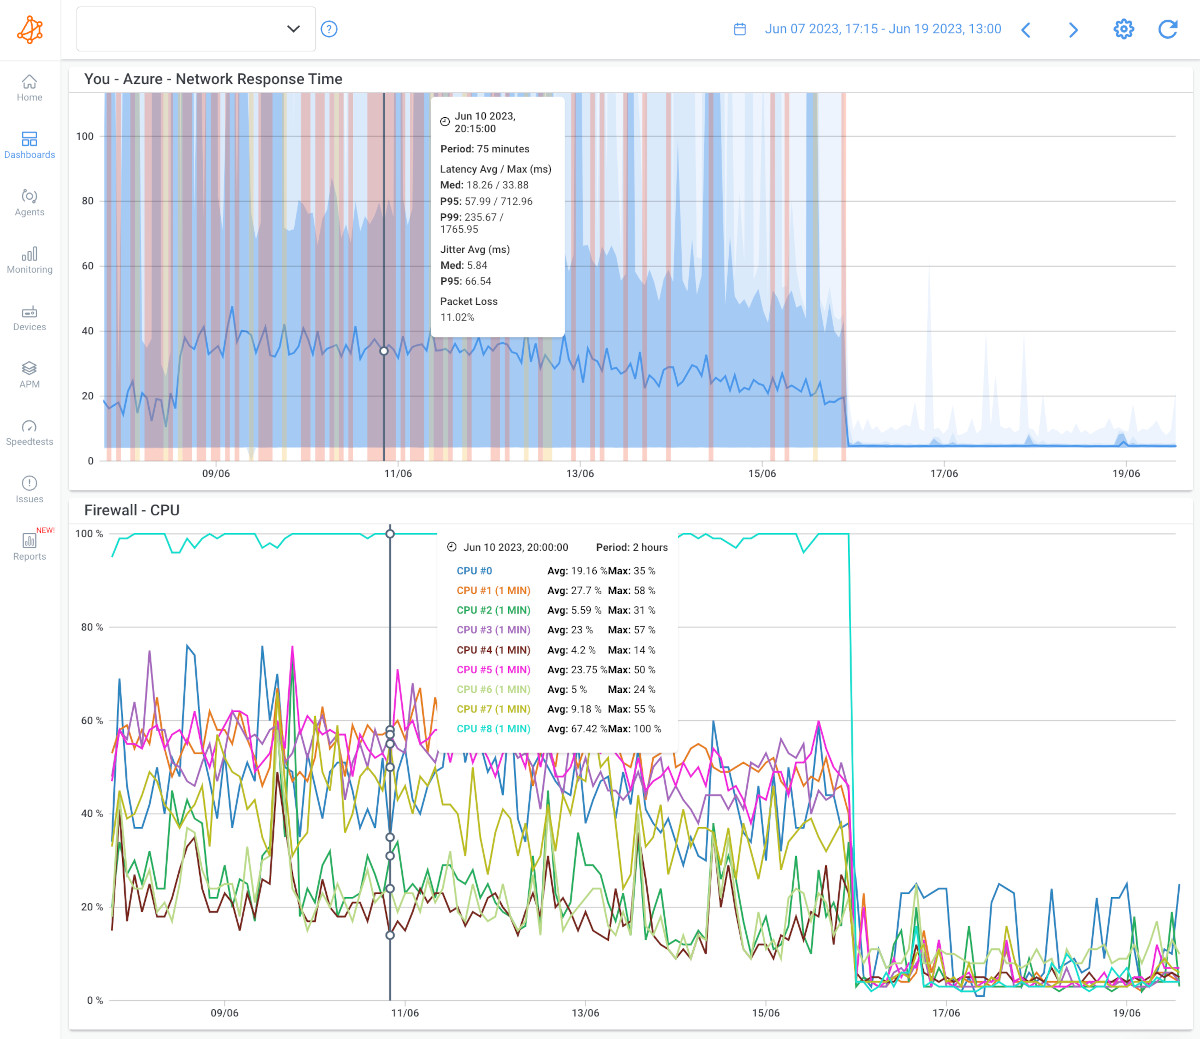
True network performance monitoring requires complete, continuous network monitoring from every angle of your network, from the WAN to the LAN. It is of course important to monitor your firewall, but sometimes you may think a problem is happening within your firewall, but it may actually be caused by something else in your network that is affecting your firewall.
End-to-end performance monitoring stops you from having to play the guessing game of “is this the problem or is it something else?” A network performance monitoring software, like Obkio, will automatically notify you as soon as a problem occurs - with details about where it happened and when it happened.
In the long-term, and even in your everyday life, an end-to-end solution will always give you the most visibility and accuracy and will save you countless hours that you may have spent playing a network guessing game.
- 14-day free trial of all premium features
- Deploy in just 10 minutes
- Monitor performance in all key network locations
- Measure real-time network metrics
- Identify and troubleshoot live network problems

While firewalls are critical components of network security and play a crucial role in controlling incoming and outgoing network traffic, they are primarily designed to manage and filter data based on security policies. Here are key reasons why monitoring network performance requires a more comprehensive approach than just monitoring the firewall:
Limited Visibility:
- Firewall Focus: Firewalls primarily focus on traffic entering or leaving the network, providing limited visibility into internal network communication and performance.
- Missing Internal Issues: Network performance issues within the internal network, such as congestion, latency, or device-specific problems, cannot be effectively monitored through the firewall alone.
Internal Network Challenges:
- Internal Communication: Devices within the internal network often communicate with each other directly, and their interactions may not pass through the firewall.
- Firewall Bypass: Monitoring only the firewall may miss internal network challenges, including issues with local servers, switches, routers, or other infrastructure components.
Application Performance:
- Beyond Security Policies: Firewalls are not designed to monitor application performance comprehensively.
- Application Layer Issues: Monitoring only the firewall does not capture application layer issues, such as slow response times or service-specific performance problems.
Cloud and Remote Access:
- Cloud Services: With the increasing use of cloud services, monitoring through a firewall may not provide insights into the performance of cloud-hosted applications and services.
- Remote Users: Monitoring internal traffic alone does not account for the performance of remote users accessing the network from different locations.
Distributed Networks:
- Multiple Locations: Organizations often have distributed networks with multiple locations, and firewall-centric monitoring may not cover all these locations.
- End-to-End Visibility: Achieving end-to-end visibility requires monitoring at various points within the network to understand the performance from the user's perspective.
Performance Bottlenecks:
- Network Components: Performance bottlenecks can occur within different network components, such as routers, switches, and servers.
- Firewall Bypass: Traffic that doesn't traverse the firewall may encounter issues in these components, and monitoring the firewall alone won't capture such problems.
Quality of Service (QoS):
- Traffic Prioritization: Firewalls implement traffic filtering but may not provide detailed insights into QoS metrics, such as packet loss, jitter, and latency.
- Application Prioritization: Monitoring QoS requires understanding how different applications are prioritized and ensuring the network meets the required service levels.
Real-Time Monitoring Needs:
- Live Data Analysis: Real-time monitoring requires analyzing live data, which may not be feasible solely through the firewall's logs or configurations.
- Granular Metrics: Detailed, granular metrics about network performance often require specialized monitoring tools that go beyond the capabilities of firewalls.
Security vs. Performance:
- Firewall Priorities: Firewalls prioritize security functions, and their monitoring capabilities are centered around security events and policies.
- Performance Monitoring Gap: Network performance monitoring requires a dedicated focus on metrics related to speed, responsiveness, and efficiency, which may not align entirely with the objectives of a firewall.
Comprehensive Troubleshooting:
- Root Cause Analysis: For comprehensive troubleshooting, administrators need to identify the root causes of performance issues, which may involve examining multiple aspects of the network.
- Firewall Limitations: Relying solely on firewall logs or metrics might limit the ability to identify and address issues originating from other parts of the network.
To monitor network performance effectively, organizations often deploy dedicated network monitoring solutions that provide a more holistic view of the network, including both internal and external traffic. These solutions offer insights into various metrics, allowing administrators to proactively address performance challenges, optimize resource allocation, and enhance the overall user experience.
In recent years, IP networks have increasingly been used to transport various types of applications. Applications such as Voice over IP (VoIP), Video Conferencing (ex: GotoMeeting, Zoom, Webex), Unified Communications (ex: Skype for Business) and Collaboration (ex: Microsoft Teams) are a lot more sensitive to network performance and quality.
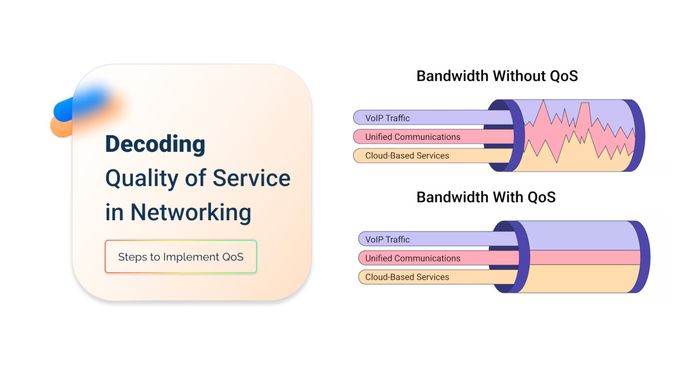
That’s why many network engineers chose to implement QoS Quality of Service to prioritize certain traffic on the network in order to reduce latency, jitter and packet loss.
In case of a network congestion, this ensures that performance sensitive applications are always running without degradation and that only the less critical applications (such as web browsing) are impacted. That’s why QoS is generally implemented for companies with a large network, who operate a large number of sites and applications.
While having QoS enabled is great, the problem is that it’s rarely tested and generally can’t react that way we need it to. QoS configuration requires a big money and time investment, but it's a necessary effort because critical applications such as VoIP need to work 100% of the time.
Unlock the power of Quality of Service (QoS) in networking. Dive into prioritization, bandwidth prioritization & why QoS is your network's vigilant ally.
Learn more

Once QoS (Quality of Service) is implemented, how can you make sure that it's working properly? How can you ensure that the initial setup is still working after a few months or years? Well, you need a good network performance monitoring solution.
With Obkio’s network monitoring solution, customers deploy some Monitoring Agents and configure a Network Monitoring Template to create network performance monitoring sessions for QoS. That way you can actually monitor and leverage your QoS results to bring your users the best experience possible.
You can learn more about this process in our blog post on QoS Monitoring with Obkio.
Learn how to monitor QoS performance on your private network, including MPLS, SD-WAN, or VPN, using Obkio's DSCP features.
Learn more

QoS monitoring is essential for ensuring optimal network performance and user experience. QoS refers to the set of techniques and mechanisms that prioritize and manage network traffic to meet specific service level objectives. Implementing QoS monitoring in your network provides several benefits:
Prioritizing Critical Applications: QoS ensures that critical applications, such as VoIP calls, video conferencing, and real-time collaboration tools, receive priority treatment over less time-sensitive traffic. By prioritizing critical applications, QoS monitoring helps maintain consistent performance for essential services, preventing degradation during periods of network congestion (LAN congestion or WAN congestion).
Reducing Latency for Real-Time Applications: QoS mechanisms aim to minimize latency, ensuring timely delivery of data for real-time applications. Monitoring latency metrics helps identify potential issues and ensures that real-time applications ([ex: VoIP latency issues), which are sensitive to delays, operate smoothly and provide a positive user experience.
Minimizing Jitter for Communication Applications: QoS addresses jitter, the variation in packet delay, to ensure a consistent and smooth flow of data for communication applications. Monitoring jitter levels helps identify and resolve issues affecting the quality of voice and video calls, contributing to a better user experience.
Preventing Packet Loss: QoS helps mitigate packet loss by prioritizing critical packets and ensuring their timely delivery. Monitoring packet loss metrics is crucial for maintaining data integrity and preventing the need for retransmissions, which can impact overall network performance.
Optimizing Bandwidth Utilization: QoS allows for effective bandwidth management, ensuring that available bandwidth is used efficiently based on application priorities. Monitoring bandwidth utilization helps identify patterns and trends, allowing for proactive adjustments to optimize network resources.
Ensuring Consistent Application Performance: QoS aims to provide consistent performance for applications, irrespective of network conditions.Monitoring application-specific performance metrics helps ensure that applications meet service level agreements (SLAs) and user expectations.
Meeting Service Level Agreements (SLAs): QoS monitoring helps organizations meet SLAs by ensuring that network services and applications deliver the agreed-upon performance. Meeting SLAs is crucial for maintaining customer satisfaction, especially in environments where guaranteed performance is a contractual requirement.
Effective Resource Allocation: QoS enables administrators to allocate network resources based on business priorities and application requirements. Monitoring resource allocation helps identify any mismatches between policy configurations and actual network conditions, allowing for adjustments as needed.
Enhancing User Satisfaction: QoS contributes to a positive user experience by ensuring that network services perform reliably and consistently. Monitoring user satisfaction metrics helps gauge the effectiveness of QoS policies in meeting user expectations and addressing potential pain points.
Proactive Issue Identification and Resolution: QoS monitoring provides real-time insights into network performance, allowing for proactive issue identification and resolution. Identifying and addressing potential QoS-related issues before they impact users helps maintain a stable and efficient network environment.
Supporting Diverse Network Environments: QoS is especially valuable in environments with diverse traffic types, such as data, voice, and video. Monitoring QoS ensures that each type of traffic receives appropriate treatment, supporting the coexistence of various applications and services on the network.
Adapting to Changing Network Conditions: QoS monitoring provides the flexibility to adapt to changing network conditions, adjusting priorities based on real-time requirements. Monitoring and analyzing QoS metrics help organizations respond dynamically to evolving network demands, ensuring continued performance optimization.
The final question in this list has to do with ISP performance, and why it should matter in relation to network performance.
How ISPs Affect Your Organization:
Your ISP or Internet service provider is an organization that provides services for accessing, using, or participating in the Internet - so it’s detrimentally important to your organization. As for why you should care about its performance, in short, if you don’t, no one will.
Limited Metrics Provided by ISPs:
Most ISPs only provide metrics to monitor the backbone or the network core. Which means that they don’t monitor all local loops (connections to individual customers) , nor do they monitor performance to identify when there’s a performance issue. That means that when there is a problem, it’s hard to know when to react, and how to treat the problem.
Relying solely on the metrics provided by ISPs can result in delayed detection and response to performance issues, potentially impacting your business operations.
Taking Control of ISP Performance Monitoring:
With ISPs playing such a big part in a company’s ability to perform, it’s important for you to take this into your own hands and start monitoring ISP performance. By actively monitoring your ISP, you gain the ability to identify and address performance issues promptly, ensuring a more proactive approach to maintaining network health.
Luckily, a network performance monitoring tool can do this for you.
Discover what and how to monitor with the right tool, setting the stage for top ISP network performance and a strong foundation for business growth.
Learn more

Proactive Resolution for ISP Issues
Monitoring your ISP performance will allow you to be notified as soon as a problem or ISP Issues occurs, so you can treat it before it affects your business in any big way. Proactive issue resolution minimizes downtime and potential disruptions, contributing to the overall stability and reliability of network services.
A network performance monitoring solution can precisely identify the location of performance problems, facilitating quicker decision-making on assigning responsibilities for issue resolution. Knowing where the problem persists streamlines the troubleshooting process, allowing teams to focus their efforts efficiently.
Avoiding Lengthy ISP Support Cases:
Creating a support case any time you have an Internet problem can be long and tiresome. If you don’t know what the problem is, you might be waiting days to get an answer from the support team on the lines of “have you tried restarting your computer?”
Monitoring ISP performance allows organizations to diagnose and solve problems independently, reducing dependency on external support and expediting issue resolution.
If you’re monitoring performance yourself, then you can actually solve a problem, instead of working around it. And with more logs and data provided to you from your monitoring solution, you can actually escalate a support case way faster to people that can fix the issues you’ve identified. Because unfortunately, rebooting your computer doesn’t fix everything.
If you've ever wondered how to stay ahead of performance issues and maintain a seamlessly functioning network, the answer lies in the realm of Network Performance Monitoring (NPM) tools. From real-time notifications to proactive issue resolution, NPM tools are the key to not just monitoring your ISP but also optimizing your entire network infrastructure.
Certainly! Let's delve deeper into the benefits of using a Network Performance Monitoring (NPM) tool, particularly in the context of monitoring ISP performance:
Real-Time Issue Notifications: Network Performance Monitoring tools continuously analyze network data and metrics in real-time. The real-time monitoring feature allows organizations to receive immediate notifications when performance issues arise with the ISP. This enables swift response times, reducing the impact on users and preventing potential disruptions to business operations.
Precise Location Identification: NPM tools have the capability to pinpoint the exact location of performance problems within the network. Knowing the precise location of issues is crucial for efficient troubleshooting. It enables IT teams to quickly identify whether the problem lies with the ISP, a specific network segment, or an internal component. This precision streamlines the resolution process.
Proactive Issue Resolution: By continuously monitoring ISP performance, NPM tools enable proactive issue resolution.Proactivity is key in preventing performance problems from escalating. NPM tools allow organizations to address issues as soon as they arise, minimizing the impact on users and ensuring a more stable network environment.
Historical Performance Analysis: NPM tools store historical data on network performance. Analyzing historical performance data helps identify patterns, trends, and recurring issues. It also provides a baseline for normal network behavior, aiding in the detection of anomalies. This historical context enhances the overall understanding of the network's performance.
Customizable Alerts and Thresholds: NPM tools allow users to set customizable alerts and performance thresholds. Organizations can tailor alert configurations to match specific performance criteria or business requirements. Customizable alerts ensure that IT teams are notified only when predefined thresholds are breached, reducing unnecessary alerts and focusing attention on critical issues.
Multi-Layered Performance Monitoring: NPM tools often offer multi-layered monitoring capabilities, covering various aspects of network performance. Monitoring different layers of the network, such as application layer, transport layer, and network layer, provides a holistic view. This comprehensive approach helps in identifying performance issues at different levels and facilitates targeted troubleshooting.
User Experience Insights: NPM tools can provide insights into the end-user experience. Monitoring user experience metrics helps organizations understand how network performance impacts actual users. This user-centric perspective is valuable for aligning IT efforts with the expectations and needs of end-users.
Integrated Reporting and Analysis: NPM tools often come with reporting and analysis features. Integrated reporting provides a consolidated view of network performance data. Analysis tools help IT teams derive actionable insights from the data, supporting strategic decision-making and continuous improvement of network infrastructure.
In summary, the benefits of using a Network Performance Monitoring tool extend beyond basic observation. These tools empower organizations to proactively manage and optimize their network infrastructure, ensuring a reliable and high-performing environment for both internal users and external stakeholders.
Monitoring network performance is something that has to be done thoroughly and consistently in order to give you the most accurate metrics. Luckily there’s software out there to do it all for you, so you don’t have to.
Try your hand at network performance with a free trial of Obkio’s network performance monitoring software!
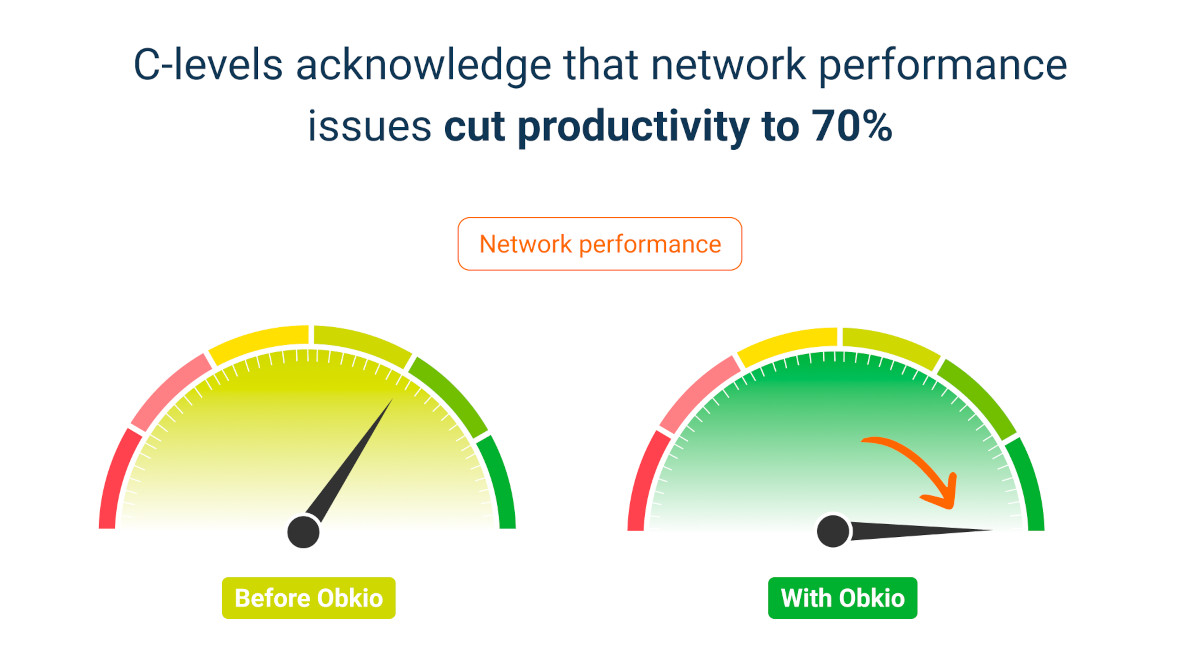
Obkio is a simple Network Monitoring & Troubleshooting SaaS Solution that allows users to continuously monitor the health of their network and core business applications to improve the end-user experience.
- 14-day free trial of all premium features
- Deploy in just 10 minutes
- Monitor performance in all key network locations
- Measure real-time network metrics
- Identify and troubleshoot live network problems

Now that we’ve run you through some of the basic network performance monitoring questions that we get regularly, are there any others that you’d like answered?
Since this is the first article in this series, we wanted to cover some of the basics. So stay tuned for more blog posts covering an array of different network performance monitoring topics!
If you have any questions you want answered asap, contact one of our network performance experts with any questions or comments you may have!


 Obkio Blog


