Table of Contents
Table of Contents
Ladies and gentlemen, get ready to rumble! It's time to enter the ring and choose your fighter in the world of network performance monitoring tools. In this corner, we have the classic heavyweight contenders like SNMP and packet sniffers. And in the other corner, we have agile newcomers like synthetic monitoring and flow analysis.
It's a battle of speed, precision, and power, and only one tool can come out on top. So grab your popcorn and settle in, because it's time for the ultimate showdown of network performance monitoring tools - Choose Your Fighter: Network Edition!
Before you choose your fighter, you need to know what the battle is actually about. Well, it’s the battle for optimal network performance. That is achieved with Network Performance Monitoring.
Network Performance Monitoring or NPM is the process of monitoring end-to-end network performance and end-user experience to optimize network performance and troubleshoot network issues. Unlike traditional monitoring, network performance monitoring measures network performance from the end-user perspective, between two points in the network.
For Example:
- The performance of a user, who works in the office, and the application they use in the company’s data center
- The performance between two offices in a network
- The performance between the head office and the Internet
- The performance between your users and the cloud
The goal of network performance monitoring is to ensure that the network is operating efficiently and effectively and to identify and address network availability issues and network performance issues anywhere in your network infrastructure. This process involves collecting information about network traffic, bandwidth usage, packet loss, latency, and other key network metrics, as well as using various tools and techniques to analyze and interpret this data.
The information gathered through network performance monitoring can be used to set or raise network performance expectations, troubleshoot and help fix network issues, and make informed decisions about network capacity and infrastructure priorities and planning.


If the fight is for great network performance, then Network Performance Monitoring tools are your fighters!
In the world of networking, Network Performance Monitoring Tools are software applications that are designed to help IT teams keep a close eye on the performance of their computer networks. These tools collect and analyze data about the network, such as traffic flow, bandwidth usage, and device status, and provide insights into the overall health and performance of the network.
The data collected by network performance monitoring tools can be used to identify issues and troubleshoot problems, optimize network performance, and ensure that the network is meeting the needs of its users. These tools can also help IT teams to proactively detect and prevent issues before they have a chance to impact network performance or cause downtime.
There are many different types of network performance monitoring tools available, each with its own unique features and capabilities. Some tools are designed to monitor specific aspects of the network, such as application performance or security, while others provide a more comprehensive view of network performance across multiple domains.
Looking to solve your network issues and get complete network visibility? Unlock valuable insights into your network's performance with Obkio's end-to-end network performance monitoring solution today. Don't let any missing pieces hold you back - start your free trial now and see the full picture of your network's performance.
- 14-day free trial of all premium features
- Deploy in just 10 minutes
- Monitor performance in all key network locations
- Measure real-time network metrics
- Identify and troubleshoot live network problems

Network performance monitoring tools are used to monitor and analyze the performance of computer networks. They help IT teams to identify problems, troubleshoot network issues, optimize network performance, and ensure that the network is meeting the needs of its users.
Here are some of the common use cases for network performance monitoring tools:
- Continuous Network Monitoring: Proactively identify network issues in real-time with a continuous view of network performance. Instead of periodic checks or manual monitoring, use network performance monitoring tools to get a view of your network’s performance at all times.
- Network Troubleshooting: When network issues arise, network performance monitoring tools can help IT teams identify the source of the problem, such as network congestion or a faulty device.
- Network Performance Optimization: Network performance monitoring tools can help IT teams optimize network performance by identifying bottlenecks and areas for improvement.
- Network Auditing: Similarly to the point above, network performance monitoring tools can help you audit the health of your network to identify areas for improvement. This can be done to prepare your network for a new service deployment or migration as well.
- Capacity Planning: By monitoring network traffic and usage patterns, these tools can help IT teams identify potential capacity issues and plan for future growth.
- Security: Some network performance monitoring tools can detect and alert IT teams to potential security threats, such as unauthorized access or unusual network activity.
- Compliance: Network performance monitoring tools can help organizations comply with regulatory requirements by providing insights into network activity and usage.
Overall, network performance monitoring tools are critical for ensuring that computer networks are performing at their best and providing reliable and efficient connectivity for users.
Network performance monitoring tools are designed to help organizations monitor and manage their network infrastructure in real-time. While some of the features included will depend on the tool you choose, there are some features that are common for many different types of network performance monitoring tools.
Here are some of the main features of network performance monitoring tools:
- Network Performance Metrics: Network performance monitoring tools provide real-time and historical performance metrics for network devices, such as packet loss, latency, and throughput.
- Network Device Monitoring: Network performance monitoring tools monitor the health and status of network devices such as network switches, routers, servers, and other network devices. This includes monitoring CPU usage, memory usage, and other performance metrics.
- Traffic Analysis: These tools monitor network traffic in real-time and provide analysis of network traffic patterns. This allows network administrators to identify and troubleshoot any network congestion or performance issues.
- Alert Management: These tools generate network monitoring alerts and notifications when network issues are detected. This helps network administrators quickly identify and address network problems.
- Historical Reporting: Network performance monitoring tools provide historical data and reports that can help identify trends, track performance over time, and make informed decisions about network upgrades or changes.
- Application Performance Monitoring: These tools monitor the performance of critical applications running on the network, such as email, databases, and other business-critical applications.
- Network Mapping: These tools provide network administrators with a visual representation of the network topology, allowing them to quickly identify and troubleshoot network issues.

Now that you know what you’re working towards and how, it’s time to see the lineup of tools available at your disposal. To optimize, monitor and troubleshoot network performance, businesses use a variety of Network Performance Monitoring tools and techniques.
The tool (or tools) you use can depend on your business’ needs and budget, your network’s size, and your team’s expertise. Let’s go through some of the different types of network performance monitoring tools that are commonly used in modern networks:
Passive network performance monitoring tools collect and analyze data on network traffic as it flows through the network. They work by capturing and analyzing traffic that is flowing through the network.
Passive network performance monitoring tools are typically used to capture network traffic, measure network performance metrics, and provide visibility into network usage patterns.
Passive network performance monitoring tools work by:
- Capturing and analyzing real user traffic in the network.
- Analyzing packet headers and payloads to measure network performance metrics such as latency, jitter, and throughput.
- Providing detailed visibility into network traffic patterns, which can be used to identify trends, troubleshoot issues, and monitor application performance.
- Identifying bandwidth-intensive applications, analyzing traffic patterns, and identifying network congestion points or network overload.
Passive network performance monitoring tools are designed to monitor network performance without actively interfering with network traffic. These tools operate by listening to network traffic, capturing packets and analyzing them to provide insights into network performance.
Here are some of the advantages of passive network performance monitoring tools:
- No impact on network performance: Passive monitoring tools do not introduce additional traffic onto the network, so they do not impact network performance or introduce potential bottlenecks.
- Wide visibility: Passive monitoring tools have the ability to monitor all traffic on the network, providing a comprehensive view of network performance across all devices and applications.
- Real-time analysis: Passive monitoring tools can provide real-time analysis of network traffic, allowing IT teams to quickly detect and respond to potential issues.
While passive network performance monitoring tools have many advantages, there are also some potential disadvantages to consider:
- Limited visibility into application performance: Passive monitoring tools may not be able to provide detailed insights into application performance, as they do not actively interact with the network or applications and most of the data is encrypted.
- Incomplete data capture: Passive monitoring tools may not capture all network traffic, especially if the traffic is encrypted or using non-standard protocols.
- Limited ability to troubleshoot: Passive monitoring tools can identify potential issues, but they may not provide enough information to troubleshoot and resolve issues.
- Network latency: Passive monitoring tools may introduce network latency if the network is congested or if the monitoring tool is not configured properly.
- Resource-intensive: Passive monitoring tools can be resource-intensive, as they require a significant amount of storage and processing power to capture and analyze network traffic. This also leads to significant cost and scalability issues.
Active network performance monitoring tools monitor network performance by sending data packets across the network to simulate user traffic and test network performance. These tools actively monitor and measure network performance, identify issues in real-time, and generate alerts when network performance falls below acceptable levels.
Active network performance monitoring tools typically involve:
- Deploying monitoring agents or probes in key network locations for end-to-end monitoring.
- The agents or probes continuously send synthetic data packets across the network to measure network latency, throughput, and packet loss.
- These tools also allow network administrators to simulate user behaviour and test how the network responds under different loads and conditions.
Because Active network performance monitoring tools are distributed in nature and can monitor modern decentralized network architectures, they increasingly replacing older Passive monitoring solutions.
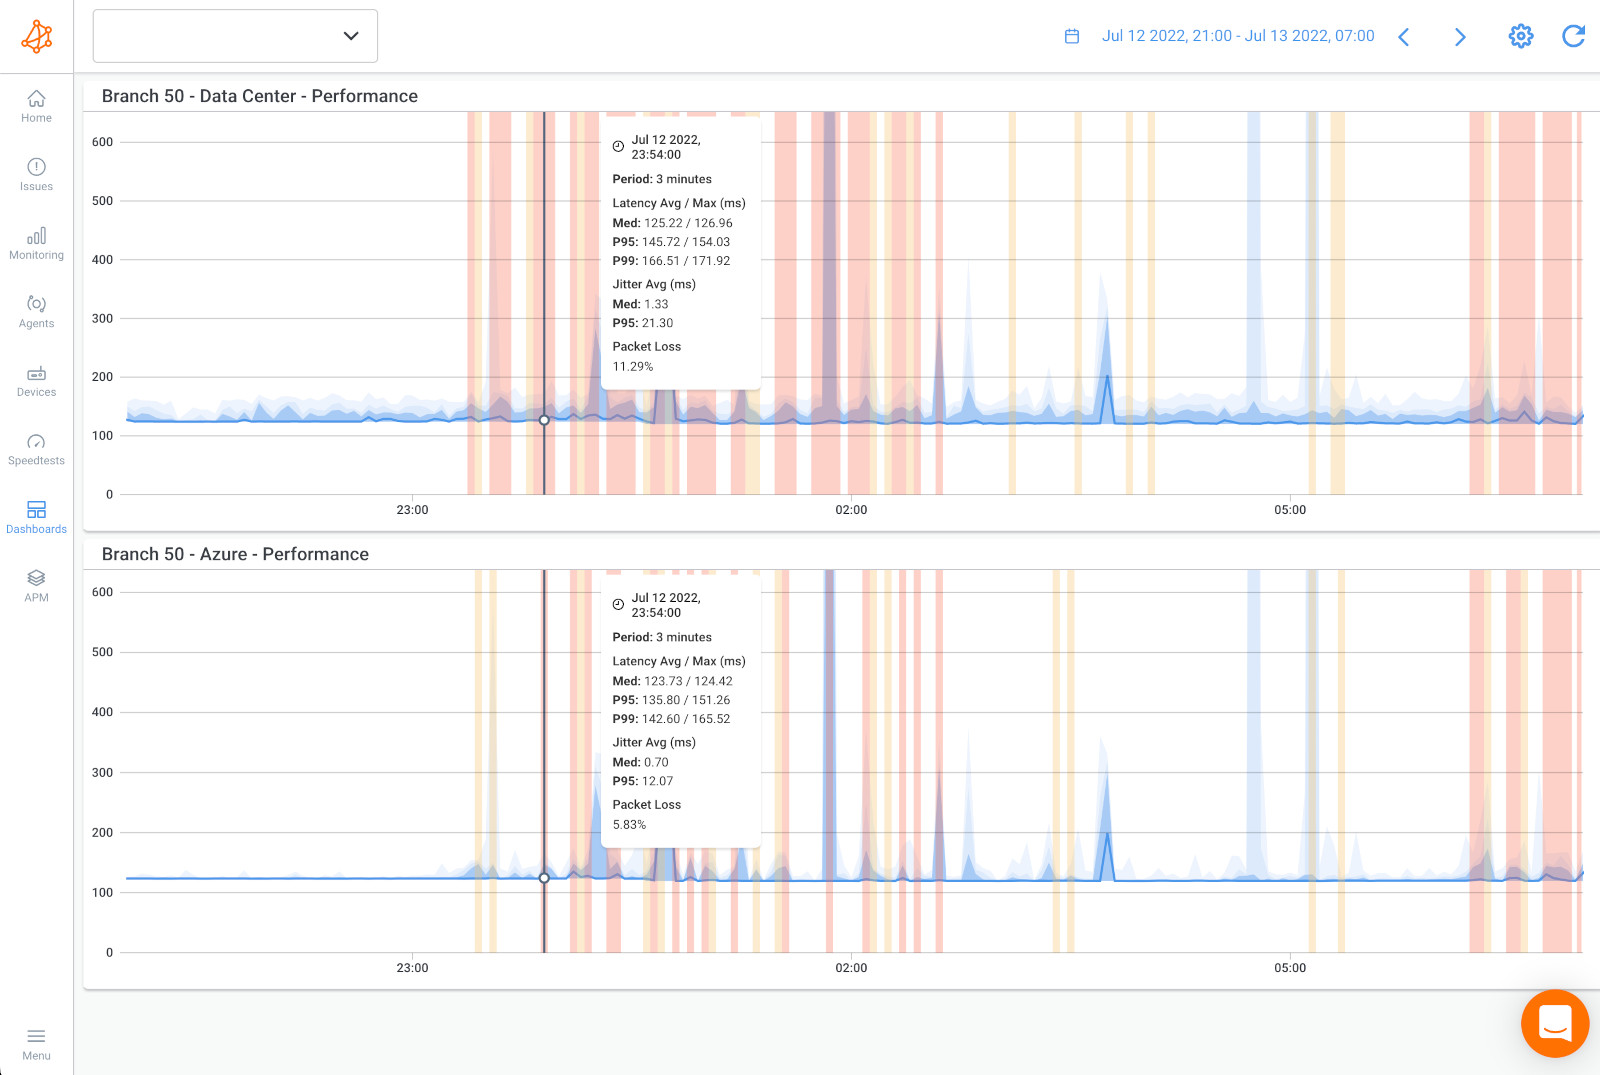
Some common examples of active network performance monitoring tools include Ping, and Traceroute, which are built-in tools available in most operating systems. As well as more advanced commercial tools like Obkio Network Performance Monitoring, which monitors network performance using Monitoring Agents which send synthetic UDP traffic every 500ms between each other in key network locations.

It doesn’t stop there! There are many other advantages of active network performance monitoring tools that are helping them surpass passive network performance monitoring tools in popularity with modern businesses!
Here are some of the key advantages of active network performance monitoring tools:
- Proactive Monitoring: Active monitoring tools actively test and measure network performance in real-time, allowing for proactive monitoring and identification of potential issues before they become serious problems. Continuous performance tests allow you to monitor network performance even if there’s no traffic currently going through the network - unlike passive monitoring, which requires network traffic for monitoring.
- Quick Diagnosis: These tools can quickly identify the root cause of network issues, reducing troubleshooting time and increasing network uptime.
- Improved Network Security: Active monitoring tools can help identify security vulnerabilities and potential threats, enabling network administrators to take preventive measures before a security breach occurs.
- Better Network Planning: Active monitoring tools provide detailed performance data, which can be used to plan for network upgrades, capacity expansions, and other improvements.
- Compliance and Reporting: Active monitoring tools can provide reports and data necessary for compliance with regulatory requirements, such as the Payment Card Industry Data Security Standard (PCI DSS).
- Cost Reduction: By identifying and addressing network issues early, active monitoring tools can reduce network downtime, which can result in significant cost savings.
- Enhanced User Experience: Active monitoring tools can ensure that network performance meets the needs of users and applications, resulting in a better user experience and improved productivity.
There aren’t many disadvantages of active network performance monitoring tools, and it’ll also depend on the actual solution you choose, but here are some to consider:
- Cost: Active network monitoring tools can be expensive to purchase and maintain and may require additional resources such as dedicated hardware or personnel to operate.
- Intrusiveness: Some active monitoring techniques, such as network probes or active testing, can be intrusive.
- Tuning: Active monitoring tools may generate false positives if they detect anomalies or performance issues that are not actually problems, so a period of alert tuning is necessary during the implementation process.
Obkio is a cloud-based active network performance monitoring tool uses synthetic traffic to monitor network devices and measure response time, packet loss, and other performance metrics.
SNMP (Simple Network Management Protocol)-based network performance monitoring tools are software applications or hardware devices that use SNMP to gather network performance data from network devices such as routers, switches, and servers. SNMP is a standard protocol that is widely used in network management to monitor and manage network devices.
SNMP-based network performance monitoring tools typically use SNMP queries to retrieve data from SNMP-enabled devices. The collected data can include device uptime, bandwidth utilization, network utilization, CPU usage, memory usage, and other performance metrics. This data is then analyzed and displayed in various formats such as tables, charts, graphs, and alerts.
Network Performance Monitoring tools like Obkio, also have SNMP Network Device Monitoring capabilities, which allow you to have a network, application, and network device monitoring solution in one.
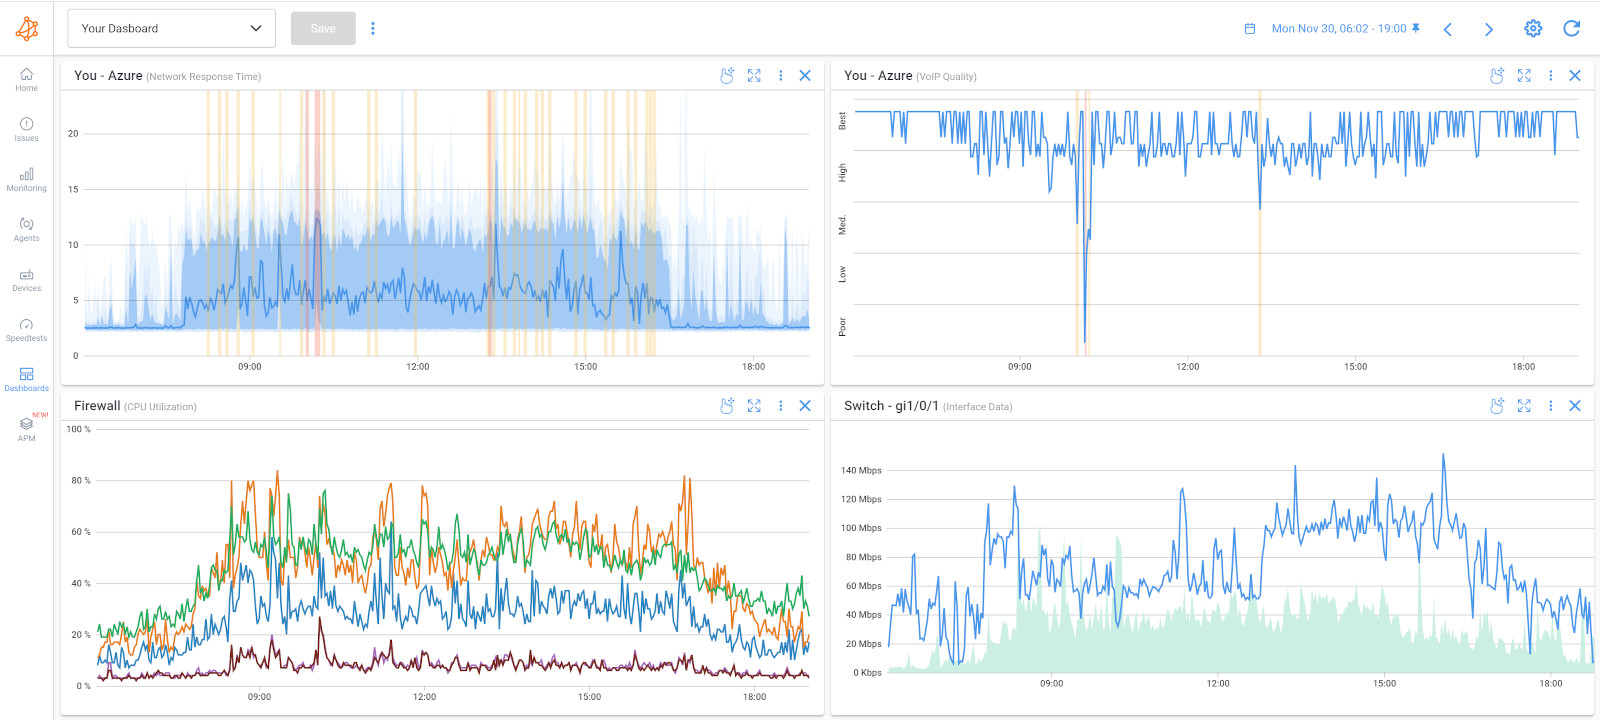
Overall, SNMP-based network performance monitoring tools are a cost-effective and reliable way to monitor network performance, allowing administrators to quickly identify and resolve performance issues before they impact network operations.
Here are some of the advantages of SNMP-based network performance monitoring tools:
- Low Overhead: SNMP-based network performance monitoring tools use a low amount of network bandwidth and system resources, making them a good choice for monitoring large-scale networks.
- Compatibility: SNMP is a widely used standard protocol, and most network devices support SNMP, making it easy to integrate with existing network infrastructure.
- Scalability: SNMP-based network performance monitoring tools can scale to monitor large and complex networks, allowing administrators to monitor performance across multiple devices and locations.
- Ease of Use: SNMP-based network performance monitoring tools are typically easy to use and configure, with intuitive user interfaces and dashboards.
- Flexibility: SNMP-based network performance monitoring tools offer a high degree of flexibility and customization, allowing administrators to tailor monitoring to meet the specific needs of their network.
- Historical Analysis: SNMP-based network performance monitoring tools can store performance data for historical analysis, allowing administrators to identify trends and patterns over time.
- Data Visualization: SNMP-based network performance monitoring tools can present network performance data in various formats such as tables, charts, and graphs, making it easy to understand and analyze network performance.
SNMP-based network performance monitoring tools do have some disadvantages that network administrators should be aware of: Limited Data Collection: SNMP-based network performance monitoring tools can only collect data that is available through the SNMP protocol, which may not include all performance metrics or detailed data.
- Lack of Real-Time Monitoring: SNMP-based network performance monitoring tools usually rely on periodic polling of network devices, which means that the collected data may not reflect real-time performance, particularly for high-speed or latency-sensitive applications.
- Vulnerability to SNMP-based Attacks: SNMP-based network performance monitoring tools can be vulnerable to attacks that exploit vulnerabilities in the SNMP protocol, such as denial-of-service (DoS) attacks or unauthorized access to network devices.
- Difficulty with Customization: Customizing SNMP-based network performance monitoring tools to meet specific needs may require technical expertise or coding skills, which can be a challenge for some network administrators.
- Complexity of Configuration: SNMP-based network performance monitoring tools can be complex to configure and set up, particularly for large and complex networks, which can make them time-consuming and costly to deploy.
- Lack of Compatibility: Some network devices may not support SNMP or may require additional configuration to be compatible with SNMP-based network performance monitoring tools.
Keep your network devices in top shape with this awesome SNMP-based monitoring tool! Obkio is a cloud-based network performance monitoring tool that uses SNMP to monitor network devices. It can monitor the health and performance of network devices, including CPU usage, memory usage, and network traffic. It can also send test traffic to network devices and measure response times, packet loss, and other performance metrics.
Application Performance Monitoring (APM) tools monitor the performance and availability of applications in real-time. APM tools can identify, diagnose, and resolve performance issues that affect application performance and user experience.
APM tools provide visibility into the entire application stack, including the application code, web servers, databases, and other infrastructure components by collecting various metrics related to application performance, such as response times, throughput, error rates, and resource utilization, to provide insights into application behaviour and help optimize performance.
Many also have features such as application mapping, transaction tracing, and code-level diagnostics to help identify and diagnose performance issues.

APM tools are a valuable investment for organizations looking to ensure optimal application performance, enhance user experience and improve productivity and customer satisfaction.
Some advantages of Application Performance Monitoring (APM) tools include:
- Increased Application Performance: APM tools help organizations identify and resolve performance issues quickly, ensuring optimal application performance.
- Better User Experience: With APM tools, organizations can monitor the user experience of their applications, identifying issues that could negatively impact user experience and resolving them quickly.
- Increased Productivity: APM tools enable organizations to identify and resolve performance issues quickly, reducing the amount of downtime or slow performance that could negatively impact productivity.
- Better Resource Allocation: APM tools help organizations identify which resources are being used the most by their applications, enabling them to allocate resources more efficiently.
- Improved Customer Satisfaction: By ensuring optimal application performance and user experience, APM tools can help to improve customer satisfaction, leading to increased customer loyalty and retention.
- Enhanced Security: APM tools can help organizations identify security vulnerabilities or breaches in their applications, allowing them to take appropriate action to address these issues quickly.
- Detailed Insights: APM tools provide organizations with detailed insights into the performance of their applications, enabling them to identify trends and patterns over time.
While Application Performance Monitoring (APM) tools offer several advantages, they also have some disadvantages that organizations should consider before implementing them:
- Complexity: APM tools can be complex to set up and configure, particularly for large and complex applications, which can make them time-consuming and expensive to deploy.
- High Cost: APM tools can be costly, particularly if they are used to monitor a large number of applications or if they require additional hardware or software.
- Data Overload: APM tools can generate a lot of data, which can be overwhelming and difficult to manage for organizations that do not have dedicated resources for data analysis.
- Lack of Compatibility: APM tools may not be compatible with all types of applications or technologies, which could limit their usefulness in certain environments.
- Inaccurate Data: APM tools rely on monitoring data collected from applications, which may not always provide an accurate representation of actual user experience or performance.
- Lack of Control: APM tools may not provide organizations with the level of control they need to make changes or adjustments to their applications based on monitoring data.
End-User Experience Monitoring (EUEM) tools track the experience of end-users while they are using an application or accessing a website. They monitor how applications and services are performing for end-users, regardless of where they are accessing them from, and can help identify and troubleshoot issues related to network performance.
EUEM tools collect data on a variety of user experience metrics, including page load times, response times, and error rates, among others. Some EUEM tools also offer the ability to simulate user interactions with applications, allowing IT teams to identify potential issues before they impact end-users.
EUEM tools are a valuable investment for organizations looking to ensure optimal application performance, enhance user experience, and improve productivity and customer satisfaction.
Some advantages of End-user experience monitoring (EUEM) tools include:
- Improved User Experience: EUEM tools monitor application performance from the end-user's perspective, helping organizations to identify and address performance issues that impact user experience.
- Better Resource Allocation: EUEM tools help organizations identify which resources are being used the most by their applications, enabling them to allocate resources more efficiently.
- Reduced Downtime: EUEM tools can help organizations to identify and resolve performance issues quickly, reducing the amount of downtime or slow performance that could negatively impact productivity.
- Increased Productivity: EUEM tools enable organizations to identify and resolve performance issues quickly, reducing the time that employees spend troubleshooting or waiting for applications to respond.
- Enhanced Customer Satisfaction: By ensuring optimal application performance and user experience, EUEM tools can help to improve customer satisfaction, leading to increased customer loyalty and retention.
- Better Data Analysis: EUEM tools provide organizations with detailed insights into the performance of their applications, enabling them to identify trends and patterns over time and make data-driven decisions to improve application performance.
- Better Compliance: EUEM tools can help organizations to ensure compliance with industry regulations and standards by monitoring application performance and identifying areas where performance needs to be improved.
While EUEM tools can be a valuable investment for organizations looking to improve application performance and user experience, they have some limitations that organizations should consider when selecting a monitoring solution.
- Complexity: EUEM tools can be complex to set up and configure, particularly for large and complex applications, which can make them time-consuming and expensive to deploy.
- High Cost: EUEM tools can be costly, particularly if they are used to monitor a large number of applications or if they require additional hardware or software.
- Data Overload: EUEM tools can generate a lot of data, which can be overwhelming and difficult to manage for organizations that do not have dedicated resources for data analysis.
- Lack of Compatibility: EUEM tools may not be compatible with all types of applications or technologies, which could limit their usefulness in certain environments.
- Inaccurate Data: EUEM tools rely on monitoring data collected from end-users, which may not always provide an accurate representation of actual user experience or performance.
- Lack of Control: EUEM tools may not provide organizations with the level of control they need to make changes or adjustments to their applications based on monitoring data.
Synthetic Network Performance Monitoring tools simulate user behaviour on a network to measure network performance. These tools generate synthetic traffic that is sent over the network to measure various performance metrics, such as latency, packet loss, throughput, jitter.
Synthetic Network Performance Monitoring tools are very similar to Active Network Performance Monitoring tools, and although they are often used interchangeably, they do have differences.
Synthetic monitoring tools are used to continuously monitor network performance, test the performance of new network infrastructure, as well as identifying and troubleshooting network problems in existing network infrastructures. They can also be used to simulate real-world scenarios, such as heavy user loads or specific types of network traffic, to test the network's performance under different conditions.
Active Network Performance Monitoring tools are oftentimes also synthetic monitoring tools. A tool like Obkio generates synthetic UDP traffic to measure network performance every 500ms.
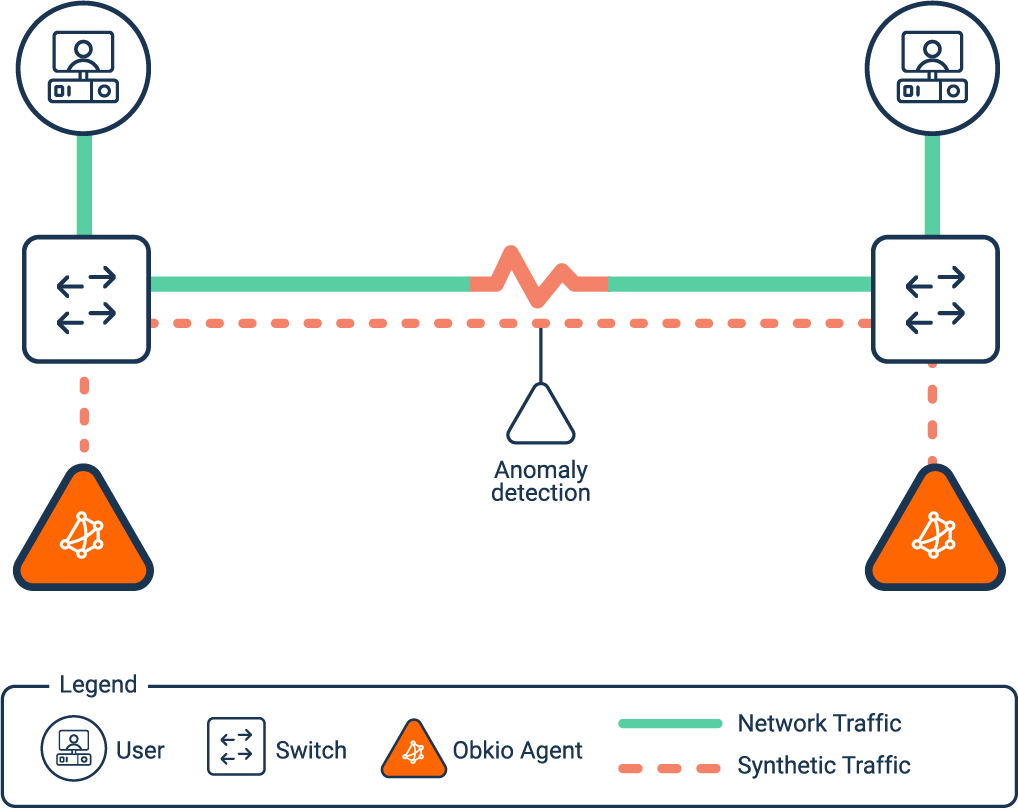
Overall, synthetic network performance monitoring tools provide a way to proactively monitor and optimize network performance without capturing real user traffic.


Synthetic network performance monitoring tools are a valuable investment for organizations looking to ensure optimal network performance, improve user experience, and increase productivity. There are especially important for ensuring user privacy and security since they don’t capture real user traffic.
Here are some of the several advantages of Synthetic network performance monitoring tools:
- No Packet Capture: Since synthetic network performance tools generate synthetic traffic to simulate user behaviour, they don’t require packet capture like older network performance monitoring tools. This means that there are no security or privacy concerns related to data capturing and analysis for users.
- Proactive Monitoring: Synthetic network performance monitoring provides organizations with the ability to proactively monitor network performance and identify issues before they impact end-users.
- Reproducibility: Syntheticnetwork performance monitoring allows organizations to create and reproduce network conditions to test the performance of their applications under different scenarios, enabling them to optimize their applications for optimal performance.
- Scalability: Synthetic network performance monitoring can be easily scaled to monitor large and complex networks, enabling organizations to monitor their entire network infrastructure from a single console.
- Cost-Effective: Synthetic network performance monitoring can be more cost-effective than other monitoring methods, as it does not require additional hardware or software to be installed on the network.
- Comprehensive Reporting: Synthetic network performance monitoring provides organizations with comprehensive reporting and analysis, enabling them to identify performance trends and patterns over time and make data-driven decisions to optimize their network performance.
- End-to-End Testing: Synthetic network performance monitoring can test the entire network stack, including network infrastructure, servers, and applications, providing organizations with a complete view of their network performance.
- Simplicity: Synthetic network performance monitoring is relatively simple to set up and use, making it accessible to organizations with limited IT resources.
While synthetic network performance monitoring tools provide several advantages, they also have some disadvantages that organizations should consider:
- Limited Real-World Testing: Synthetic network performance monitoring tools simulate network traffic and conditions, which may not accurately reflect real-world network usage or conditions.
- Resource Consumption: Synthetic network performance monitoring can consume resources on the network, particularly when running large or complex tests, which may impact the performance of other applications or services.
- Complexity: Synthetic network performance monitoring can be complex to set up and configure, particularly for large and complex networks, which can make it time-consuming and expensive to deploy.
- Limited Customization: Synthetic network performance monitoring tools may not provide organizations with the level of customization they need to address specific network performance issues.
Don't leave your network performance to chance! Synthetic Network Monitoring tools are like magicians, simulating traffic to keep your network performing at its best.
Obkio is a commercial Synthetic Network Monitoring tool that provides active network performance monitoring. It can simulate network traffic and measure network performance, including latency, packet loss, and jitter.
Use Obkio to to simulate network traffic, identify issues, troubleshoot problems, and optimize network performance. With Obkio's Synthetic Network Monitoring tools, you can ensure that your network is performing at its best and delivering the best possible user experience.

Network packet analyzers, also known as packet sniffers, protocol analyzers, or network analyzers, capture and analyze the data packets sent and received over a network.
These tools allow network administrators and security professionals to examine the network traffic, identify the source and destination of the packets, and analyze the content of the packets to troubleshoot network issues, optimize network performance, and detect and prevent security threats.
Network packet analyzers are very similar to Passive Network Performance Monitoring tools, and although they are often used interchangeably, they do have differences.
Packet analyzers can be used in wired and wireless networks, and they support a variety of network protocols and interfaces, such as Ethernet, Wi-Fi, TCP/IP, and HTTP.
Network packet analyzer tools, also known as packet sniffers or protocol analyzers, provide organizations with several advantages, including:
- Real-Time Monitoring: Network packet analyzer tools allow organizations to monitor network traffic in real-time, providing immediate visibility into network performance and potential issues.
- Comprehensive Analysis: Network packet analyzer tools capture and analyze every network packet that passes through the network, providing organizations with comprehensive insights into network performance and potential security threats.
- Network Troubleshooting: Network packet analyzer tools can be used to troubleshoot network issues, identify the root cause of problems, and quickly resolve performance issues.
- Security: Network packet analyzer tools can be used to identify potential security threats, such as malware or unauthorized access attempts, and alert IT teams to potential risks.
- Customization: Network packet analyzer tools can be customized to capture specific network traffic or filter out unwanted traffic, providing organizations with a more targeted view of network performance.
- Integration: Network packet analyzer tools can be integrated with other network monitoring tools and solutions, providing a comprehensive view of network performance and potential issues.
- Compliance: Network packet analyzer tools can help organizations comply with industry regulations and standards, such as PCI DSS or HIPAA, by providing visibility into network traffic and potential security threats.
While network packet analyzer tools are a valuable tool for monitoring network performance and security, organizations should carefully consider their limitations before implementing them, and should also supplement them with other monitoring methods to ensure a comprehensive view of network performance and security.
- Complexity: Network packet analyzer tools can be complex to set up and configure, particularly for large and complex networks, which can make it time-consuming and expensive to deploy.
- Performance Impact: Network packet analyzer tools can consume resources on the network, particularly when capturing and analyzing large volumes of network traffic, which may impact the performance of other applications or services.
- Limited Scalability: Network packet analyzer tools may not be scalable enough to monitor large and complex networks, particularly when capturing and analyzing high volumes of network traffic.
- Security Risks: Network packet analyzer tools may be used to capture sensitive information, such as passwords or personal data, which can pose a security risk if the tool is not properly secured.
- Limited Expertise: Network packet analyzer tools require specialized expertise and knowledge to use effectively, which may not be available within an organization or may require additional training or hiring.
- Legal Compliance: The use of network packet analyzer tools may be subject to legal restrictions or regulations, particularly if the tool is used to capture sensitive or confidential information.
Flow-based network performance monitoring tools collect and analyze information about network traffic by analyzing flow data. Flow data is metadata that describes the characteristics of network traffic, such as the source and destination IP addresses, port numbers, and the amount of data transmitted.
Flow-based network performance monitoring tools use this information to identify the types of traffic that are traversing the network, as well as the endpoints generating and receiving the traffic. This allows network administrators to identify which applications are consuming the most bandwidth, track usage patterns, and troubleshoot network issues.
Flow-based network performance monitoring tools offer several advantages to organizations, particularly in large and complex network environments, including:
- Real-Time Monitoring: Flow-based network performance monitoring tools provide real-time visibility into network traffic, enabling IT teams to quickly identify and troubleshoot issues that impact network performance.
- Comprehensive Insights: Flow-based network performance monitoring tools capture and analyze data at the network flow level, providing a more comprehensive view of network performance and potential security threats.
- Scalability: Flow-based network performance monitoring tools are highly scalable and can be used to monitor large and complex networks, making them ideal for enterprise environments.
- Reduced Overhead: Flow-based network performance monitoring tools consume fewer network resources than packet-based monitoring tools, reducing the overhead on the network and minimizing the impact on network performance.
- Security: Flow-based network performance monitoring tools can be used to identify potential security threats, such as DDoS attacks or unauthorized access attempts, and alert IT teams to potential risks.
- Easy to Deploy: Flow-based network performance monitoring tools are relatively easy to deploy and configure, particularly compared to packet-based monitoring tools, which can be complex and time-consuming to set up.
- Integration Options: Flow-based network performance monitoring tools can be integrated with other network monitoring tools and solutions, providing a comprehensive view of network performance and potential issues.
While flow-based network performance monitoring tools offer several advantages, they also have some disadvantages that organizations should consider, including:
- Limited Data: Flow-based network performance monitoring tools capture data at the network flow level, which can be less granular than packet-based monitoring tools, potentially leading to less detailed insights into network performance issues.
- Incomplete Visibility: Flow-based network performance monitoring tools may not capture all network traffic, particularly if traffic is encrypted or uses non-standard protocols, leading to incomplete visibility into network performance and potential security threats.
- Inaccuracy: Flow-based network performance monitoring tools rely on flow sampling techniques, which can result in inaccuracies or false positives, particularly when monitoring high-speed networks or capturing short-lived flows.
- Limited Protocol Support: Flow-based network performance monitoring tools may not support all network protocols, particularly newer or less commonly used protocols, potentially leading to gaps in network visibility and insights.
- Resource Constraints: Flow-based network performance monitoring tools require hardware or software resources to process flow data, which can be costly or resource-intensive, particularly for large and complex networks.
- Limited Expertise: Flow-based network performance monitoring tools require specialized expertise and knowledge to use effectively, particularly in configuring flow sampling techniques and interpreting flow data, which may not be readily available within an organization.
Cloud-based network performance monitoring tools allow for network performance monitoring from a remote location. They are hosted in the cloud and use a network of servers to collect and analyze data on network traffic, application performance, and other relevant metrics.
Cloud-based network performance monitoring tools are often subscription-based, and they can offer features such as real-time monitoring, alerts, and reporting. They can also scale easily to accommodate growing networks and offer high availability and reliability and help organizations reduce their IT infrastructure costs by eliminating the need to purchase and maintain hardware and software on-premises.
Cloud-based network performance monitoring tools offer several advantages over traditional on-premises monitoring tools. Here are some of the key benefits:
- Scalability: Cloud-based tools can easily scale up or down depending on your organization's needs, which can be useful if you need to monitor a large number of devices or if you have a sudden increase in traffic.
- Easily Accessible: Cloud-based tools can be accessed through a web interface, from anywhere with an Internet connection, making them ideal for remote teams or organizations with multiple locations.
- Cost-Effective: Cloud-based tools can be more cost-effective than traditional on-premises tools because they do not require the same level of hardware, software, and maintenance costs.
- Faster Deployment: Cloud-based tools can be deployed quickly, often in a matter of hours, compared to traditional on-premises tools that can take weeks or even months.
- Advanced Features: Cloud-based tools often offer more advanced features than on-premises tools, such as machine learning and artificial intelligence, which can help detect and resolve network issues more quickly and accurately.
- Easy Upgrades: Cloud-based tools are typically upgraded automatically, so you always have access to the latest features and functionality without the need for manual upgrades.
- Improved Security: Cloud-based tools often come with built-in security features such as encryption and access controls that can help keep your network data safe from unauthorized access.
While cloud-based network performance monitoring tools offer many benefits, they also come with some potential disadvantages. Here are a few key ones to keep in mind:
- Dependence on the Internet: Cloud-based network performance monitoring tools require a stable Internet connection to function properly, which can be a disadvantage if your organization's internet connection is unreliable or experiences downtime.
- Data Privacy Concerns: Cloud-based network performance monitoring tools require you to upload network data to a third-party provider's servers, which can raise concerns about data privacy and security. It's important to ensure that the provider has adequate security measures in place to protect your data.
- Vendor Lock-In: Once you start using a cloud-based network performance monitoring tool, it can be difficult and costly to switch to another provider. This can limit your flexibility and ability to negotiate better pricing or features.
- Limited Customization: Cloud-based network performance monitoring tools may offer limited customization options compared to on-premises tools. This can be a disadvantage if you require highly customized monitoring capabilities or if you have unique network requirements.
- Subscription-Based Costs: Cloud-based network performance monitoring tools typically require a recurring subscription fee, which can add up over time and may be more expensive in the long run compared to an on-premises solution.
- Performance and Latency: Cloud-based network performance monitoring tools may experience latency or slower performance if the provider's servers are located far from your organization's network devices. This can impact the accuracy and speed of monitoring and reporting.
Cloud-Based Network Performance Monitoring Tools are like superheroes that protect your cloud-based network infrastructure. These tools are designed to provide real-time visibility into the performance and health of cloud-based networks, including AWS, Azure, and Google Cloud
Obkio is a cloud-based network performance monitoring tool that can monitor network performance metrics for cloud environments, including AWS, Azure, and Google Cloud. It can monitor network latency, packet loss, and bandwidth usage for all types of network connections, including Cloud, WAN, and Internet.
WiFi Performance Monitoring Tools monitor and analyze the performance of WiFi networks. They capture and analyze data from WiFi devices and access points, providing insights into various WiFi performance metrics such as signal strength, throughput, latency, and packet loss.
Wi-Fi Performance Monitoring Tools help identify and troubleshoot Wi-Fi performance issues, optimize WiFi network performance, and ensure high-quality WiFi service delivery to end-users.
WiFi performance monitoring tools offer several advantages for organizations that rely on wireless networks. Here are some of the key benefits:
- Improved Network Performance: WiFi performance monitoring tools can help you identify and troubleshoot issues that affect your wireless network performance, such as signal strength, interference, and congestion. This can help you optimize your network performance and ensure a better user experience.
- Increased Network Visibility: WiFi performance monitoring tools provide real-time visibility into your wireless network, including device usage, bandwidth consumption, and network topology. This can help you identify trends and patterns that can inform network optimization and capacity planning.
- Enhanced Security: WiFi performance monitoring tools can help you identify and mitigate security threats, such as unauthorized access, rogue devices, and malware. This can help you ensure the security of your wireless network and protect your organization's data and assets.
- Remote Monitoring: WiFi performance monitoring tools can be accessed remotely, which can be useful if you have multiple locations or remote workers. This allows you to monitor and troubleshoot your wireless network from anywhere with an internet connection.
- Cost-Effective: WiFi performance monitoring tools can be more cost-effective than traditional wired network monitoring tools, as they do not require the same level of hardware and cabling costs.
- Easy to Use: Many WiFi performance monitoring tools have a user-friendly interface that makes it easy to set up and use, even for non-technical users. This can help you get up and running quickly and minimize the need for specialized expertise.
While WiFi performance monitoring tools can be useful for identifying and resolving issues in wireless networks, there are some disadvantages as well:
- Cost: Some WiFi performance monitoring tools can be expensive to purchase, especially those that offer advanced features or capabilities. Additionally, some tools require ongoing licensing fees or subscriptions, which can add up over time.
- Complexity: Some WiFi performance monitoring tools can be difficult to set up and use, especially for users who are not familiar with networking concepts or terminology. This can lead to errors or incorrect interpretations of data.
- Inaccuracy: WiFi performance monitoring tools rely on data collected from wireless access points and client devices, which can be affected by a number of factors such as interference, distance, and obstructions. This can result in inaccurate or incomplete data, leading to incorrect diagnoses and solutions.
- Privacy Concerns: Some WiFi performance monitoring tools may collect sensitive information about network usage, such as usernames, passwords, and browsing history. This can raise privacy concerns and may require additional measures to ensure data security.
- Compatibility Issues: Some WiFi performance monitoring tools may not be compatible with all types of wireless networks or devices, which can limit their usefulness in certain environments.
- Performance Impact: Some WiFi performance monitoring tools may impact the performance of the network itself, especially if they require a significant amount of bandwidth or processing power to operate. This can lead to further performance issues and may require additional resources to mitigate.
As you can see, there are many types of network performance monitoring tools you can use to monitor your network, device, and application performance. The one you use will depend on your network’s and business’ needs and resources.
Keep in mind that many tools on the market can actually have features from many of the different tools listed above. You may need a little more information to help you choose your Ultimate Fighter - so here are the 10 best network performance monitoring tools on the market.
Obkio is a cloud-based network performance monitoring and testing tool that helps organizations monitor the performance of their network infrastructure and applications. With Obkio, IT pros can can monitor network metrics, including latency, packet loss, and network jitter, and troubleshoot network issues in real-time to ensure optimal network performance.
The Obkio's NPM tool includes multiple network monitoring tools, such as active and passive monitoring agents, network path monitoring, and cloud network monitoring, that help users identify and diagnose network issues quickly. The platform's user-friendly interface provides real-time insights into network performance, enabling users to detect and address issues before they impact end-users.
Obkio is designed to be easy to deploy and use, with a simple setup process and an intuitive interface that requires minimal training. The platform is suitable for organizations of all sizes and can be used across various industries, including professional services, manufacturing, finance and more.
Overall, Obkio is an effective and reliable network performance monitoring tool that can help organizations proactively manage their network infrastructure and ensure optimal performance for end-users.
Obkio is a "Pure Play Network Performance Monitoring tool" - meaning it focuses network performance from an end-user perspective and use all kinds of high-tech ingredients like agent-based network monitoring solutions and synthetic testing to deliver a top-notch experience. Some of the specific types of network performance monitoring offered by Obkio include:
- Network Metric Monitoring
- Synthetic Monitoring
- Cloud-Based Monitoring
- Device/ SNMP Monitoring
- APM (Application Performance Monitoring)
- Network Availability Monitoring
- Visual Traceroutes
- Real-Time Monitoring
Obkio has a team with 20 years of experience in the telecom industry and 5 years of active presence in the NPM market, which has helped them create a modern and comprehensive network performance monitoring tool.
Obkio's interface is sleek and user-friendly, and the customizable templates and deep insights into network performance make it both performance-driven and visually appealing.
Whether your goal is to optimize performance or prevent downtime, Obkio is a dedicated NPM provider that can meet the needs of even the most discerning customers.

The Obkio platform is designed to have a user-friendly interface that makes it easy for users to navigate and access the network monitoring and testing features. The interface is intuitive and provides real-time insights into network performance, enabling users to detect and troubleshoot network issues quickly.
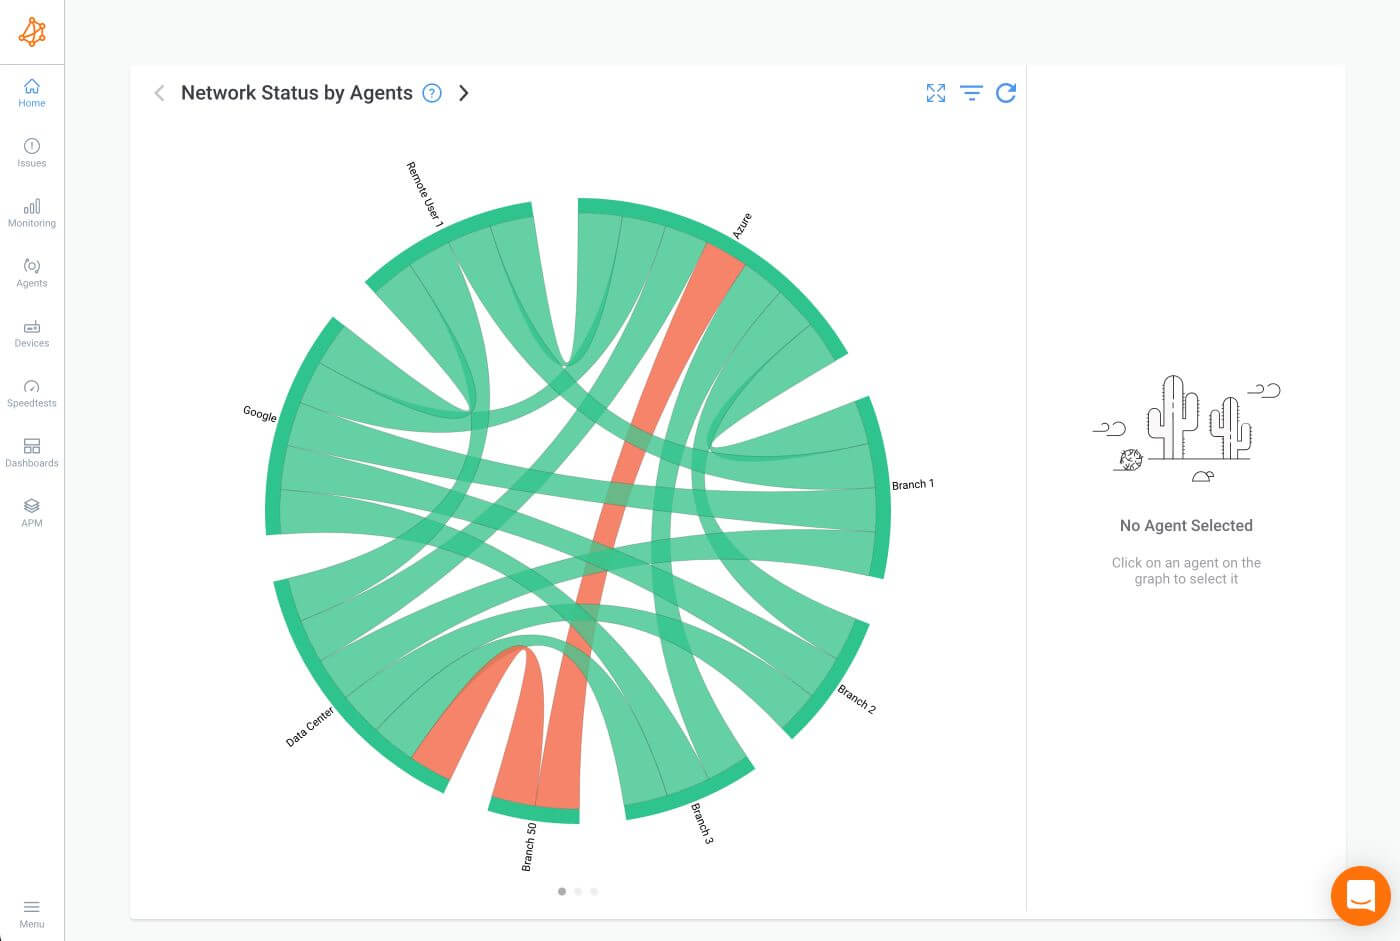
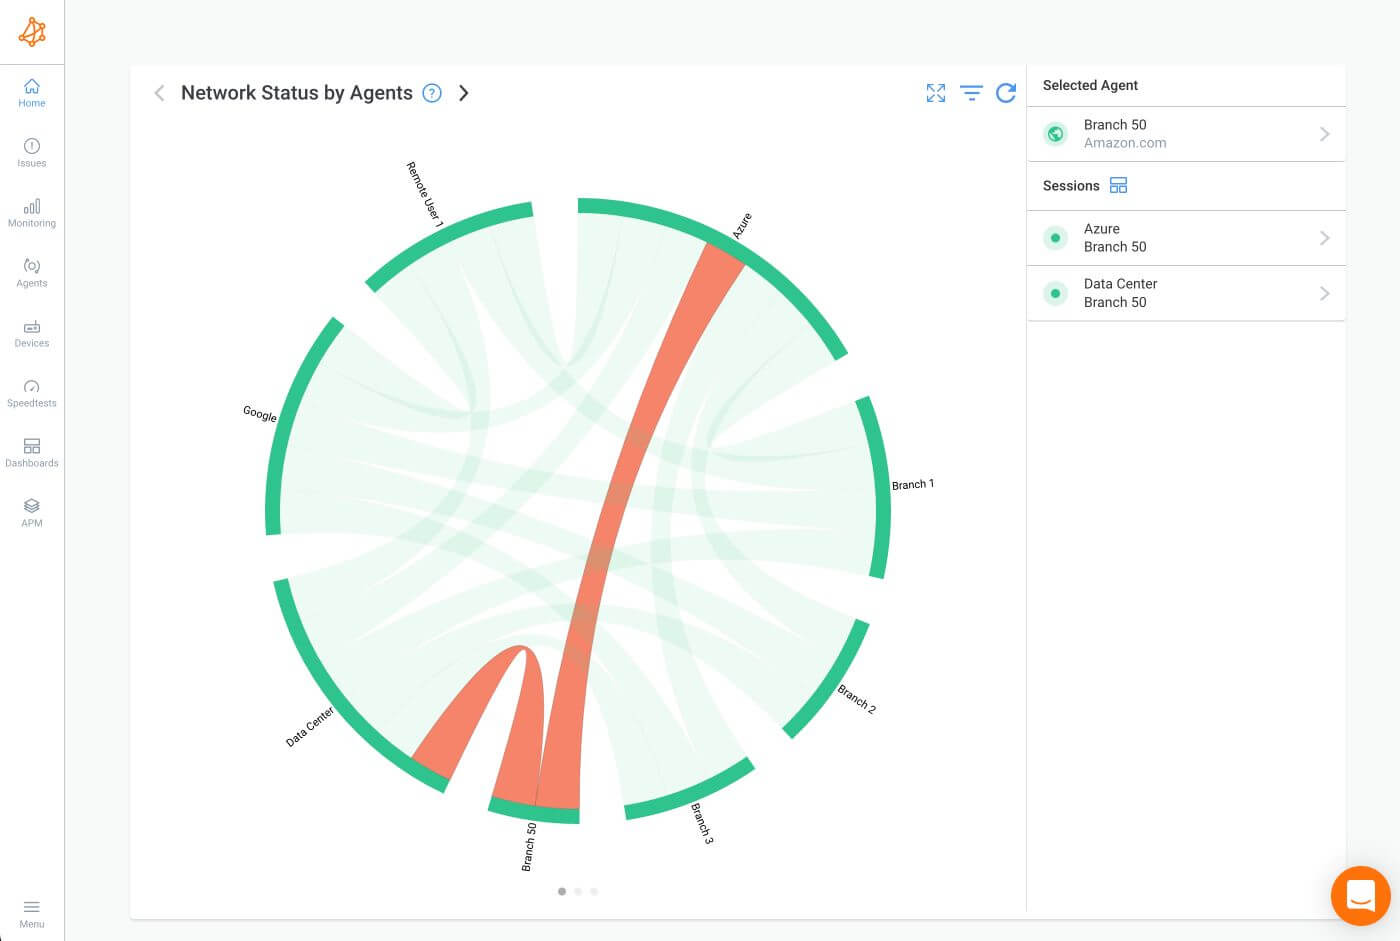
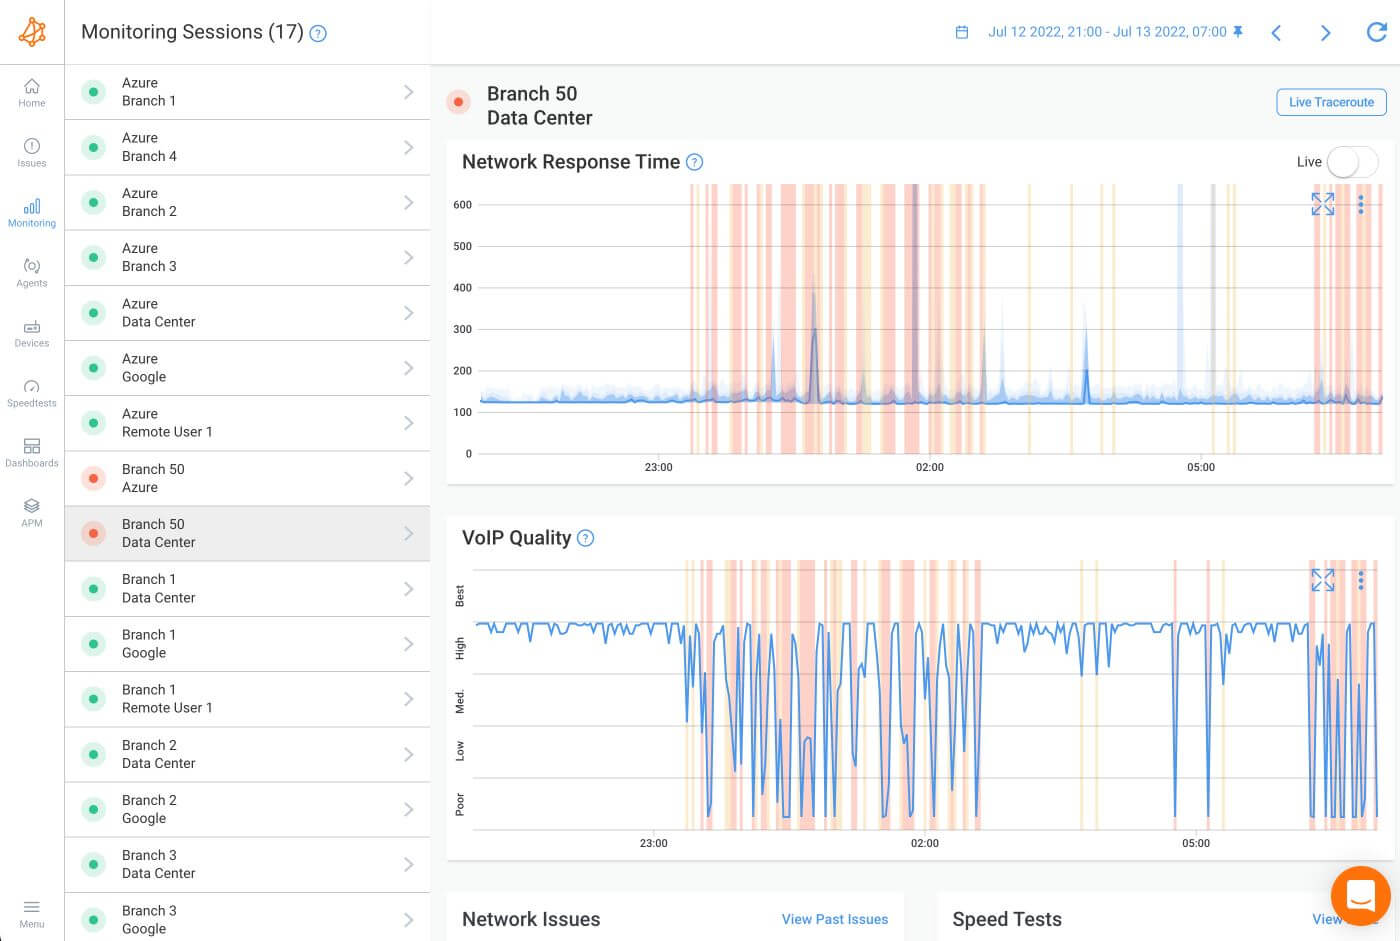

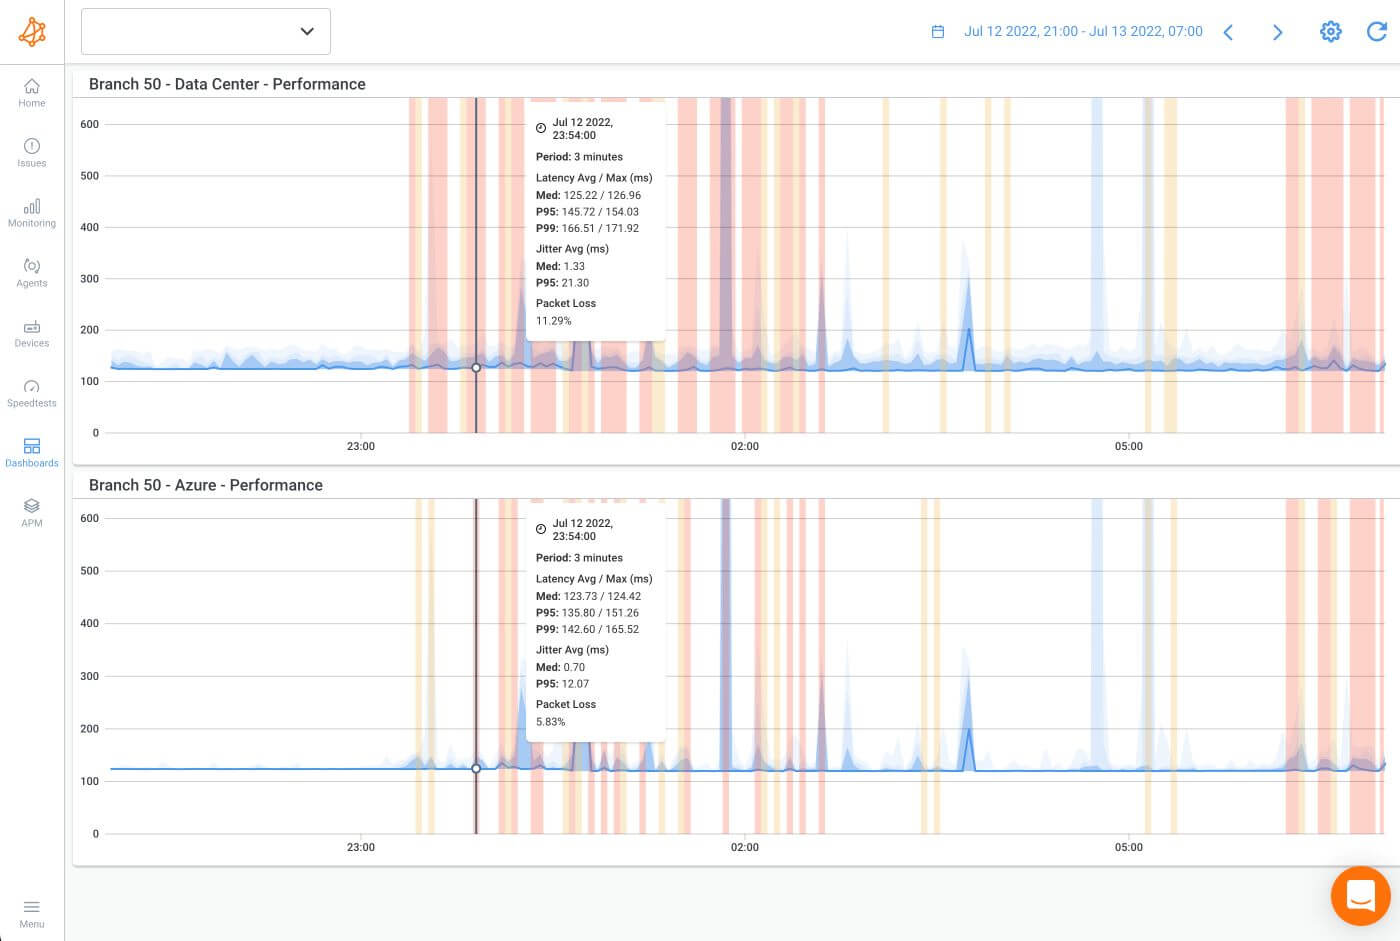
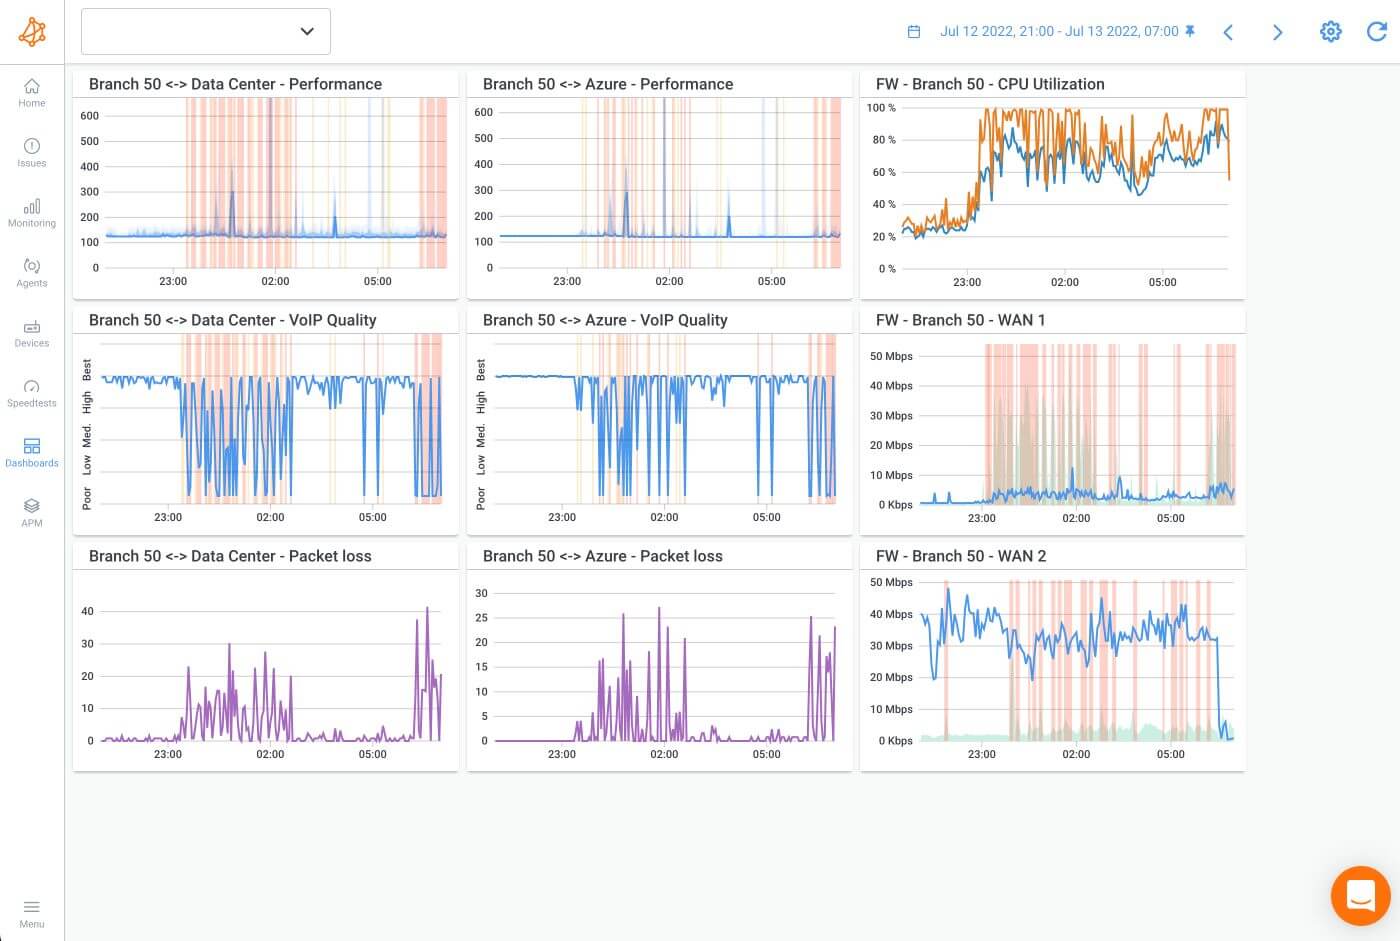
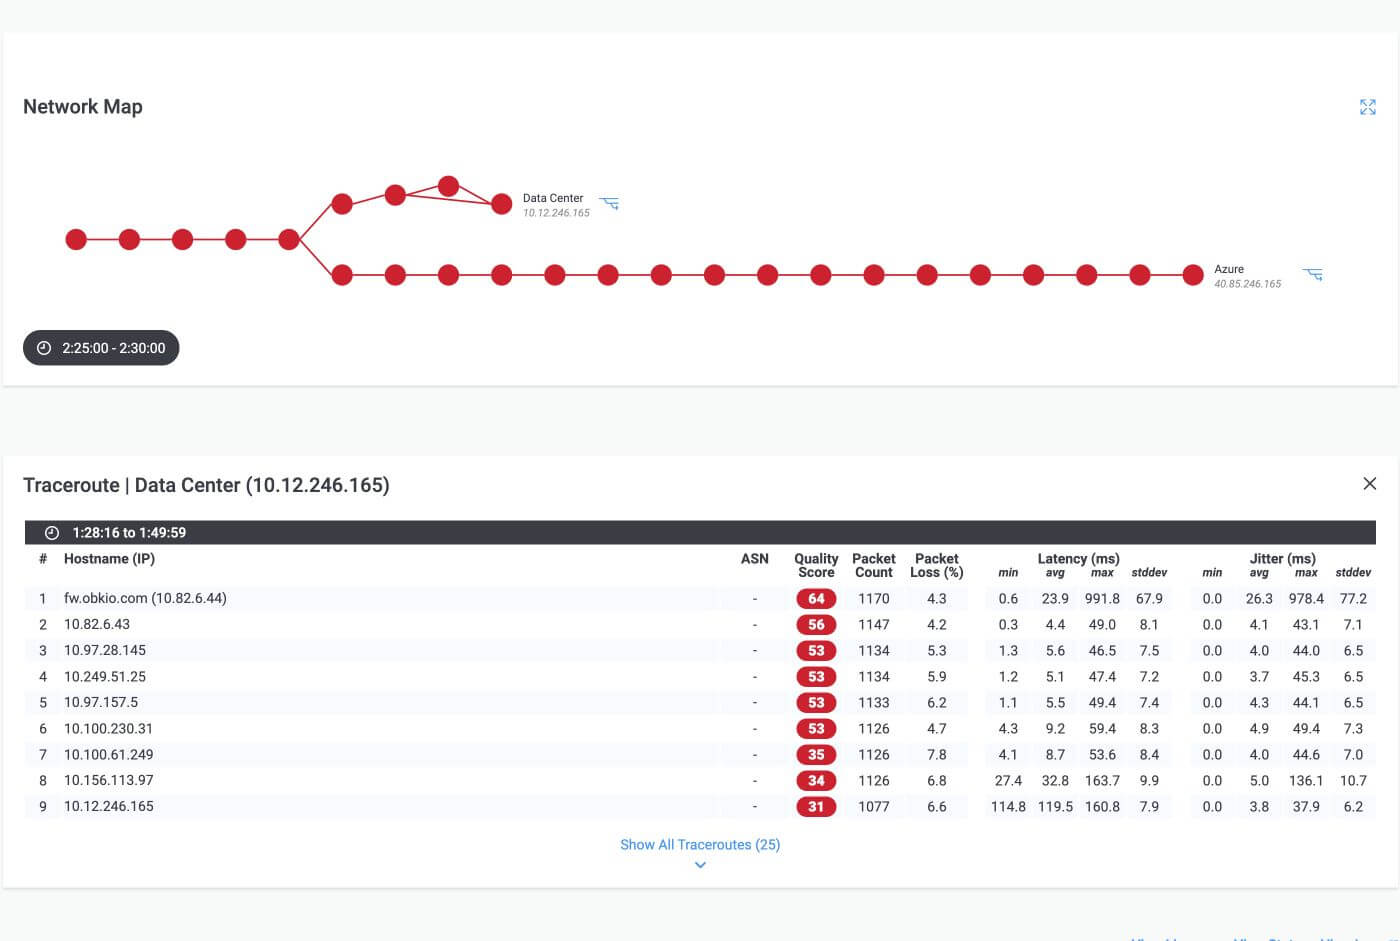
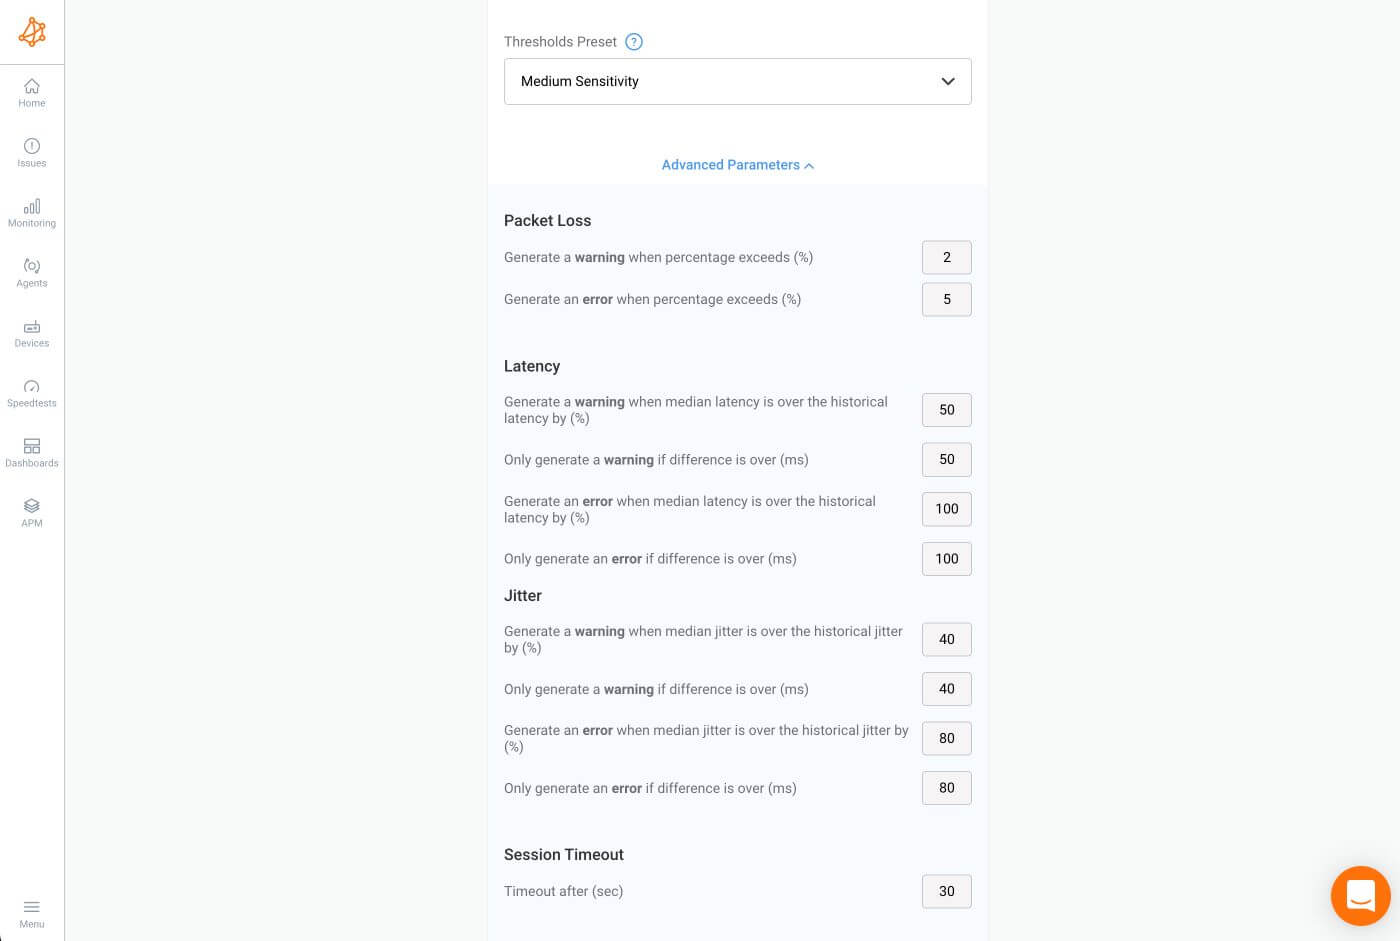
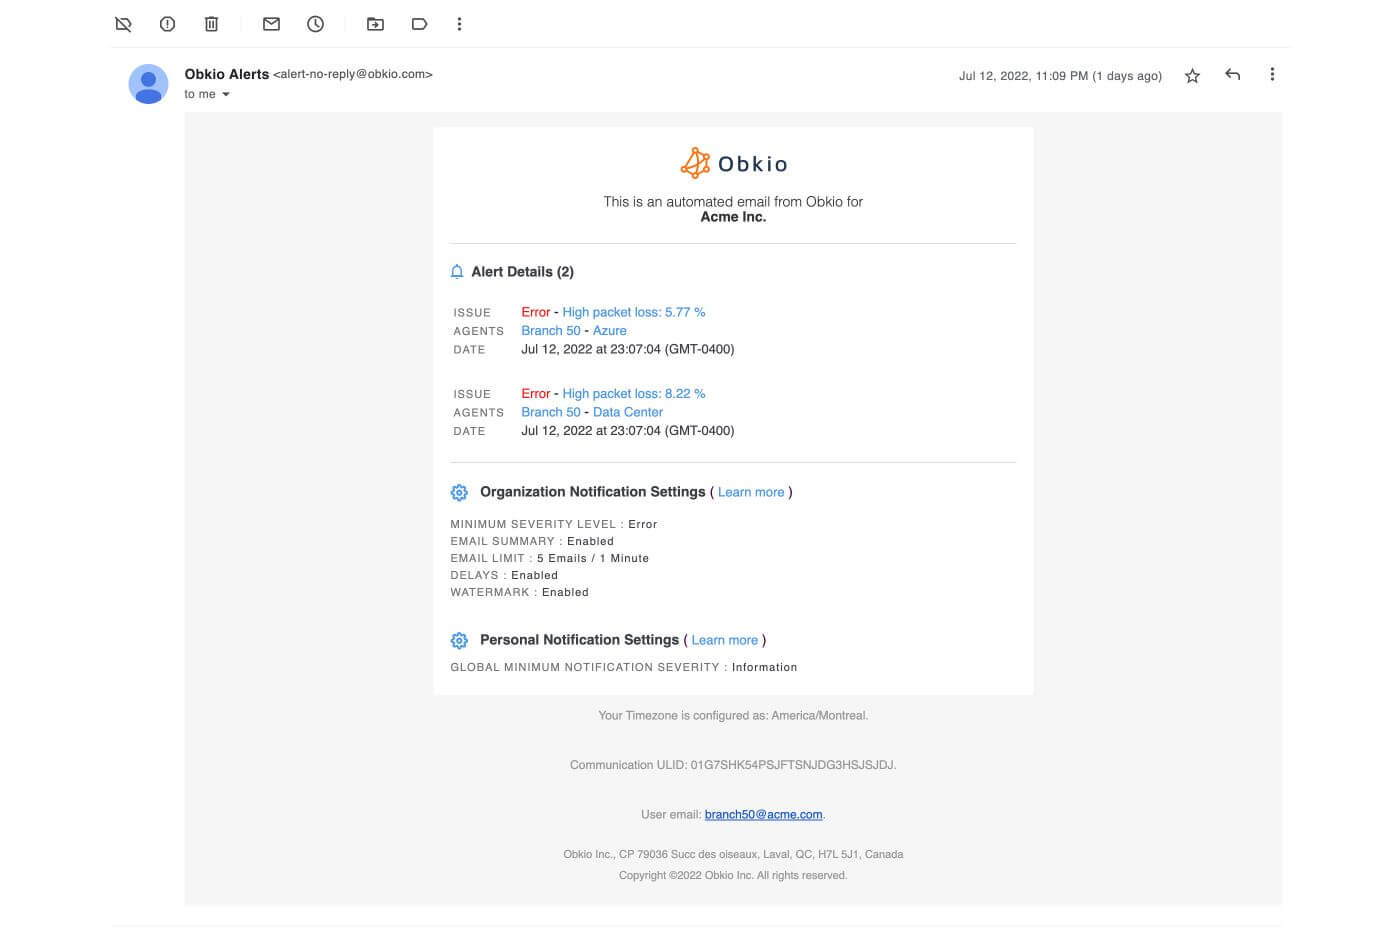
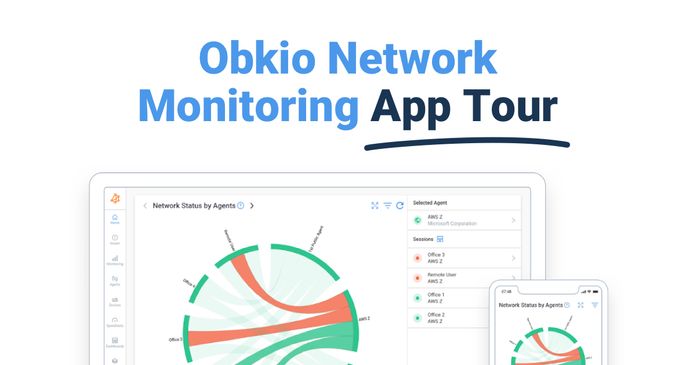
Be guided through how to identify and troubleshoot network problems with Obkio’s Network Monitoring app tour and features through screenshots.
Learn more

- Capterra/GetApp/Software Advice 4.9 (52 Reviews)
- Gartner 4.7 (7 Reviews)
- G2 4.9 (10 Reviews)
- SourceForge 5 (6 Reviews)
"Obkio was very easy to deploy and use, providing detailed network performance visibility without needing access to network equipment."
"Obkio is so user friendly and has so much power in simple views that has not only met our expectations and needs but is giving our organization added value in our Operations and Project teams."
"The team behind Obkio is absolutely amazing and passionate about what they do. Whenever there's something different happening with our servers, they write an email to wave a flag and when we don't understand, they take time to explain the situation."
"The nice part about Obkio cons is that you can discuss these with the Obkio team and they will build those features for you."
"It is priced fairly low for the amount of features you get. Also, they are constantly working on making it better with more features and public agents."
"Accurate internet performance measurement and monitoring Ease of use Ease of deployment Support for Raspberry Pi, Windows and Linux Detailed breakdown of performance issues using weighted scoring."
If you're interested in seeing Obkio's network monitoring platform in action, a free demo is available on their website.

In conclusion, when it comes to network performance monitoring, there are plenty of tools out there to help you "Choose Your Fighter" and keep your network running smoothly.
Whoever or whatever tool you’re rooting for, each one offers unique strengths and capabilities to help you optimize your network's performance. So, what are you waiting for? Choose your fighter and get ready to win the network performance battle!
If you’re looking for a network performance monitoring tool that does it all, Obkio is here to deliver the knockout network performance you need. Networks may be complex. But Obkio makes network monitoring easy. Monitor, measure, pinpoint, troubleshoot, and solve network problems.
- Monitor performance in all key network locations
- Measure real-time network metrics
- Identify and troubleshoot live network problems
- Monitor network devices and application performance
- Analyze and collect historical performance data

Let us show you why Obkio is the simplest Network Performance Monitoring tool on the market! We'll discuss your use case and show you around Obkio's app.
You can rest assured that we're not like those pushy Sellsy people - there's no catch here. We firmly believe in the excellence of our product, but if it's not the right fit for you, we understand and want what's best for you.


 Obkio Blog


