


Table of Contents
Table of Contents
Today, we delve into a pivotal tool that holds immense value for both network admins and business owners alike: Network Assessment Reports (NARs). Not only will we explore the significance of network assessments in maintaining a well-functioning network, but we'll also guide you on creating dynamic visual network assessment reports. These reports serve as a comprehensive source of crucial information, offering insights into network issues, areas for improvement, and much more.
Consider this scenario: your client's, as well as your own network, function like a precision-engineered engine, powering day-to-day operations effortlessly. But how can you ensure it remains well-maintained? This is where Network Assessments come into play – a strategic ally in securing a resilient and high-performing network for all parties.
In this article, we'll showcase why this is not just a matter of technical competency for every network admin but a crucial aspect for business owners seeking operational stability and strategic insights. Additionally, we'll walk you through the art of crafting visually compelling network assessment reports, ensuring that crucial information about your network is presented in a way that even non-technical team members can easily grasp.
Understanding Network Assessments 
Embarking on an exploration of your network's intricacies, a network assessment acts as a guiding compass, providing invaluable insights into the vitality of your digital infrastructure. This comprehensive audit employs a series of processes and scripts to meticulously scan every corner of your network from WAN to LAN.
The primary objectives?
Uncover potential risks, highlight anomalies, and collect a wealth of data concerning your network's performance.
This meticulous examination ensures a profound understanding of your network's pulse, enabling informed decision-making for your business. Whether grappling with existing challenges, seeking opportunities for improvement, or aiming for a panoramic view of your network's health, a network assessment equips you with the insights necessary for strategic planning.
But Why Does A Network Assessment Matter?
A network assessment is a proactive measure, transforming the management approach from reactive troubleshooting to strategic alignment with business objectives. Before delving into the realm of Network Assessment Reports (NARs), it's crucial to recognize the pivotal role these assessments play.
Consider the scenario of contemplating a migration to a new network infrastructure – a shift from traditional MPLS to the dynamic realm of SD-WAN or SASE, or a leap from an on-premise ERP system to a cloud-based ERP solution. Whether planning a significant alteration or deploying a game-changing service like hosted VoIP or implementing a Secure Access Service Edge (SASE) architecture, the insights gained from network assessment reporting empower proactive issue resolution, strategic migration planning, and adept navigation of evolving network technologies.
Stick around as we unravel the layers of network assessment reports, demonstrating how this proactive approach reshapes the landscape for both network administrators and business owners alike.

Learn how to perform a network assessment with Obkio Network Monitoring to optimize network performance for a new service deployment or migration.
Learn moreDemystifying the Key Elements of A Network Assessment Report
As we journey deeper into the intricacies of network optimization, it's crucial to unravel the significance of Network Assessment Reports (NARs). NARs are not just Excel spreadsheets but comprehensive documents that include detailed graphs, network test results and visual dashboards providing a detailed analysis of a network's health and functionality. Think of them as the live and dynamic blueprint that decodes the language of your network, providing a roadmap for optimization and strategic decision-making.
Overview of Key Elements in a Typical NAR:
Within the realm of NARs, key elements form the backbone of actionable insights. These include device inventory, network topology (both yours and your client’s network), performance metrics and tests, the origin of common issues and areas for improvement, existing and future services, as well as a meticulous examination of security and SLA compliance. Together, these components paint a holistic picture of your network, empowering MSPs with the data needed for informed strategies.
1. Network Topology:
- Detailed diagrams of both the assessed network and the client's network.
- Identification of potential bottlenecks, optimal routing, and areas for enhancement in the network topology.
- Assessment of current services and their performance.
2. Device Inventory:
- Comprehensive list of network devices, their specifications, and configurations.
- Analysis of the device inventory for potential vulnerabilities and areas of improvement.
3. Network Metric Measurements:
- Bandwidth, Latency, Throughput, and Error Rates.
- Identify peak usage, latency issues, variations in throughput, and error-prone segments.
4. Report of Identified Issues:
- Security, Performance, Configuration, Compliance, Capacity, Redundancy, and Documentation.
- Detail vulnerabilities, bottlenecks, misconfigurations, compliance gaps, capacity concerns, redundancy issues, and documentation shortcomings.
5. Prioritization of Issues:
- Critical, Medium, and Low-Priority.
- Categorize issues based on urgency and potential impact.
6. Remediation Plan:
- Actionable Steps, Timeline, Monitoring, and Validation.
- Provide specific steps, timelines, and ongoing monitoring for issue resolution.
7. Areas for Improvement:
- Recommendations for enhancing network performance, security, and overall efficiency.
- Guidance on areas that can be improved for better scalability and reliability.
Now, why are Network Assessment Reports more than just a bundle of data?
They serve as a strategic tool for MSPs, acting as a compass in the vast landscape of network management. By presenting a clear snapshot of your network's strengths, weaknesses, and potential risks, NARs pave the way for proactive decision-making and planning.
Whether it's optimizing performance, enhancing security, or planning for future scalability, NARs provide the insights needed to steer your network in the right direction.

The Benefits of Network Assessment Reports for MSPs
The practice of conducting regular network assessments yields a multitude of benefits that extend beyond immediate issue identification:
1. Proactive Issue Resolution:
Regular network assessment reports serve as vigilant guardians, allowing MSPs to detect and address potential issues in both their own and customers’ networks. By identifying vulnerabilities, bottlenecks, or performance gaps early on, MSPs can take proactive measures before they escalate, ensuring a seamless and optimized network environment. This not only enhances the overall reliability of client networks but also contributes significantly to client satisfaction.
2. Enhanced Client Relationships:
Through transparent communication of findings, recommendations, and the strategic roadmap for network improvements, MSPs build trust with their clients. The collaborative nature of network assessment reports contributes to a deeper understanding of client needs, aligning services with their evolving business goals. As a result, MSPs become trusted partners in the growth and success of their clients' enterprises.
3. Informed Decision-Making:
Regular network assessment reports empower MSPs with a wealth of data and insights. This valuable information serves as a foundation for informed decision-making. Whether it's planning for future expansions, adopting new technologies, or optimizing existing network configurations, MSPs armed with comprehensive NARs can make strategic decisions aligned with their clients' business objectives.
4. Cost-Efficient Resource Management:
Network assessments contribute to cost-efficient resource management by identifying areas where resources are underutilized or where additional investments may be required. By optimizing existing infrastructure and ensuring it aligns with actual usage patterns, MSPs can guide clients in making resource allocation decisions that are both cost-effective and performance-oriented. This strategic resource management enhances the overall financial efficiency of network operations.
5. Demonstrable Value Proposition:
Regularly providing clients with Network Assessment Reports reinforces the value proposition of MSP services. The tangible insights, improvements, and proactive measures outlined in the reports demonstrate the real impact of MSP efforts on the client's network health and business continuity. This, in turn, substantiates the ongoing value that MSPs bring to the table, reinforcing client confidence and satisfaction.
In conclusion, the benefits derived from regular network assessments extend beyond technical enhancements. MSPs adopting a proactive approach to network health position themselves as indispensable partners, contributing not only to the seamless functioning of client networks but also to the overall success and growth of client businesses.
Perform the Network Assessment For Your Business
Now that we've highlighted the importance of assessments and delved into the fundamentals of network reports, it's time to roll up your sleeves and initiate the process. Before diving into the specifics of network assessment reports for your business, network administrators must conduct a thorough assessment.
To guide you through this pivotal stage, we offer a quick overview below. However, for a comprehensive and detailed guide with a template for efficient assessment, we highly recommend downloading our Free Guide "The Ultimate Network Assessment Template for Your Business".

1. Network Assessment Questionnaire
Our network assessment checklist questions serve as the initial step in understanding the intricacies of your network. By addressing these questions, you not only gain insights into your network's current state but also pinpoint areas for improvement.
It involves a deep reflection on:
- Network Purpose
- Network Users
- Network Devices
- Network Infrastructure
- Network Servers
- Network Bandwidth
- Network Traffic Load
- Network Storage Capacity
- Network Backup and Recovery
- Network Security Measures
- Network Uptime
- Network Performance Metrics
- Network Maintenance and Upgrades
- Network Policies and Procedures
- Network Access and Permissions
- Network Costs
Think of it as the preparational step in creating a comprehensive network assessment report.
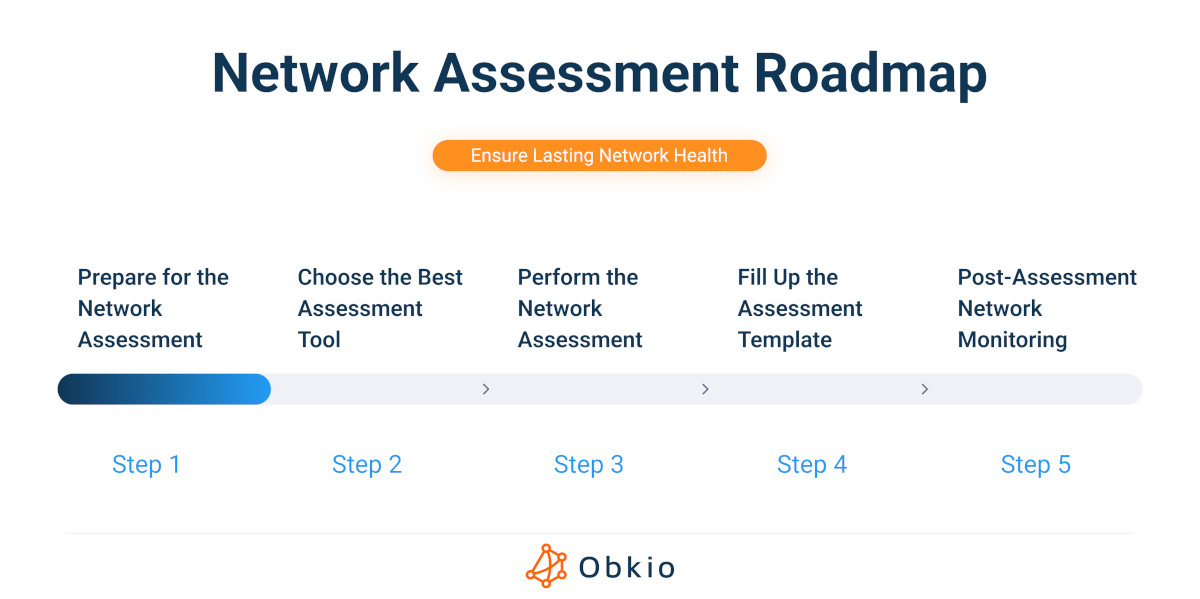
2. Choose the Best Network Assessment Tool
For some MSPs, deciding to do a network assessment template alone could seem like a risky decision, but you don't have to do it alone. Without the proper network assessment tools, trying to examine your network infrastructure in-depth can be time-consuming, short of comprehensive insights, and prone to human mistakes.
That's where your Network Detective comes into play, and in our case, it goes by the name Obkio Network Performance Monitoring — a top-tier network inspection tool. Unlike human examinations, which might unintentionally introduce errors, Obkio gives you the most accurate 360-degree picture of your network.
Why settle for uncertainty when you can leverage the power of Obkio's Network Monitoring?
This tool doesn't just identify performance issues; it's your proactive ally in spotting potential weaknesses that could rear their heads in the future.
Curious to witness the transformation?
Dive into Obkio's free trial, where you can conduct a no-obligation network assessment (POC). It's your chance to swiftly determine if your network is causing headaches and gather the insights needed to troubleshoot network issues effectively.
- 14-day free trial of all premium features
- Deploy in just 10 minutes
- Monitor performance in all vital network locations
- Measure real-time network metrics
- Identify and troubleshoot live network problems
Get started with Obkio for free!


3. Conducting the Network Assessment
Now, it's time to delve into the heart of the matter. Here are the practical steps of assessing your network, providing you with the tools and insights needed to unravel its intricacies.
3.1. Network Monitoring:
A crucial component of network assessment is network monitoring, which entails ongoing observation of system performance, network traffic, and general network health. Network health monitoring has two main objectives: first, to identify possible problems and abnormalities in the network's behaviour; second, to gather information for further analysis and performance improvement.
It involves strategies like:
- Synthetic Monitoring: Synthetic monitoring is a technique for keeping an eye on network and application performance. It is also known as active or proactive monitoring. Using network resources to simulate user activity, this technique evaluates network performance and spots possible problems.
- Packet Sniffing: This technique consists of intercepting and examining the data packets that are moving across the network. Real-time packet sniffers provide information on user behaviour, security, and network performance.
- Network Flow Analysis: To perform a network flow analysis, one must collect and analyze data on traffic patterns, including data transfer volume and frequency, to spot patterns and anomalies. This method helps identify possible security risks, network congestion, and other issues.
- Network Device Monitoring: Examining every aspect of your network, including important network devices, is essential when performing a comprehensive network evaluation. A crucial instrument for this undertaking is the Network Device Monitoring function integrated into Obkio's software, which is based on SNMP monitoring.
- Event Log Analysis: Examining system and application logs in order to identify possible problems and security risks is known as event log analysis. This method functions as a detective and can find instances of malware infestations, illegal access attempts, and other security problems.
3.2. Historical Data Analysis
Analyzing past performance data is essential to getting a thorough network assessment. It is crucial to examine performance metrics over time to obtain a precise picture of your network's performance, particularly to identify sporadic problems.
In this procedure, important performance-related network indicators are measured, and a historical record of the data gathered is compiled. You may create a network baseline for network performance by analyzing past trends, which will help you identify any patterns, abnormalities, or possible bottlenecks. Your network management team can stay ahead of possible issues by using this baseline to help set thresholds for network issue alerts.
3.3. Key Network Metrics For Assessment Reports:
A targeted strategy for real-time monitoring is just as important as historical network performance in understanding your network's performance. After analyzing the historical data, you focus on real-time insights extraction from important network parameters. These measurements are essential for analyzing the state of your network's health.
Key Metrics for Your Network Assessment Checklist:
- Jitter: Evaluate latency variation over time for real-time applications. Monitoring identifies areas with significant variations, allowing corrective actions to minimize the impact of jitter on your network.
- Packet Loss: Measure packet loss percentage during transmission, indicating potential issues from network congestion or hardware malfunctions. Excessive packet loss triggers data retransmission, affecting application performance.
- Latency: Assess data packet transmission delay, crucial for real-time applications like video conferencing and VoIP. Monitoring latency reveals areas of delay, enabling measures for performance optimization.
- Network Throughput: Quantify data transfer efficiency and uncover limitations in network infrastructure over a specified timeframe.
- Bandwidth: Measure available bandwidth to assess the network's capacity, identifying bottlenecks or potential limitations.
- VoIP Quality: Examine voice communication clarity, reliability, and consistency. Monitoring factors specific to VoIP traffic helps identify issues affecting the communication experience.
- Error Rates: Measure error rates during data transmission, revealing potential issues with network components or environmental factors affecting data integrity.
- Quality of Service (QoS): Assess QoS effectiveness by measuring metrics related to delay, jitter, and packet loss for specific applications or services.
- Network Utilization: Monitor the percentage of network capacity used to identify peak usage periods and potential bottlenecks.
- Network Security: Evaluate security posture by measuring metrics related to firewall rules, intrusion detection systems, access control lists, and other security measures.

Learn how to measure network performance with key network metrics like throughput, latency, packet loss, jitter, packet reordering and more!
Learn more3.4. Network Topology Mapping:
When it comes to creating a visual depiction of the parts and connections that make up a network, network mapping is a particularly useful method for reporting on network assessments.
Network mapping's main goal is to provide administrators with a clear picture of the network's architecture so they can identify any potential security holes, performance snags, and other areas that require improvement.
3.5. Traffic Analysis:
Traffic analysis is a crucial approach used in network assessment that is centred on the analysis and investigation of network traffic. Understanding the data flow inside the network, locating possible bottlenecks or sites of congestion, and spotting anomalies or security threats are the main objectives of traffic analysis.
Various approaches exist for traffic analysis, including:
- Protocol Analysis: This approach entails analyzing network traffic to comprehend the several protocols—HTTP, FTP, SMTP, and TCP/IP—that are in use. Network administrators can optimize network performance by identifying problems such as device breakdowns or misconfigurations by closely examining protocol headers and payloads.
- Network Packet Analysis: The process of collecting and examining individual data packets as they move over a network is the core of network packet analysis. Administrators can learn more about the behaviour, security, and performance of their networks by examining the packet headers and payloads. This method helps detect malware infestations, illegal access attempts, and other security problems.
- Flow Analysis: Monitoring network traffic patterns, which include variables like data transfer volume and frequency, is the responsibility of flow analysis. Network administrators can identify potential network congestion, performance barriers, or other anomalies that may require optimization by examining these trends.
3.6. Vulnerability Scanning
Vulnerability scanning is a crucial methodology in the field of network evaluation that involves discovering potential vulnerabilities in network devices, systems, and applications. Vulnerability scanning's main goal is to proactively identify any security threats and put in place the necessary countermeasures to neutralize them before they can be exploited.
3.7. Performance Testing:
One essential method for assessing a network's functionality is performance testing, which examines how well the network performs in various scenarios, including high network loads or volumes of traffic. Network testing's main objective is to locate any possible performance bottlenecks and optimize the network for increased dependability and effectiveness.
Different Approaches to Performance Testing:
- Load Testing: To evaluate how well a network can handle high network loads or heavy traffic, load testing involves creating scenarios of these kinds of conditions. By helping to locate bottlenecks such as missed packets or delayed response times, it gives network administrators the ability to maximize network performance as a whole.
- Stress Testing: The goal of stress testing is to evaluate the network's ability to withstand adverse circumstances, such as unexpected increases in traffic or possible denial-of-service (DoS) assaults. Administrators can identify weaknesses and efficiently prepare for prospective security incidents by stress testing the network.
- Bandwidth Testing: The process of bandwidth testing includes determining the network's available bandwidth and locating any possible congestion or bottlenecks. This method helps network managers make the most of the network's capabilities and optimize performance.
3.8. Security Testing:
A key component of the network assessment template is security testing, which focuses on examining the network's security posture and identifying any vulnerabilities or security risks. Security testing's main goal is to proactively detect security threats and put the appropriate safeguards in place to prevent cybercriminals from taking advantage of them.
Various techniques are employed in security testing, including:
- Penetration Testing: Penetration testing includes simulating an actual network attack to find security flaws and vulnerabilities. To mimic attacks and learn more about the security resilience of the network, testers use a variety of tools and strategies, such as social engineering and the use of known vulnerabilities.
- Vulnerability Scanning: A comprehensive network scan for known vulnerabilities is called vulnerability scanning, and it is followed by suggestions for mitigation. These technologies find possible vulnerabilities in software applications and network devices by using testing scripts and a database of known flaws.
- Threat Modeling: In order to detect potential security threats and vulnerabilities, a thorough investigation of the network's architecture is required for threat modelling. This method helps network managers understand the security posture of the network and create workable plans to reduce possible security threats.
- Compliance Testing: The goal of compliance testing is to assess how well the network complies with industry standards and laws, like PCI-DSS and HIPAA. Administrators can identify possible problems and make sure that standards are met by conducting compliance testing.
Crafting a Comprehensive Network Assessment Report: Network Issue Example
When people envision a network assessment report, the mental image often defaults to rows and columns in an Excel spreadsheet. However, what we're unveiling here is a transformative perspective – a network assessment report should be visual, dynamic, and intuitive.
Leveraging the power of graphs, dashboards, and alert reports is not just a choice but a strategic imperative. These visual elements not only translate data effectively but also provide a real-time, actionable representation of your network's health.
Our focus is on accentuating the benefits of shifting from traditional text-based reports to visually engaging presentations. We intend to demonstrate how graphs and dashboards can significantly enhance your understanding of network issues, making the entire reporting process more insightful and accessible for both network administrators and business owners.
Let’s delve into it then!
Having successfully completed a network assessment, you should now possess an in-depth understanding of your infrastructure, knowing precisely what's crucial to track and where your focus should lie.
The next step for a network admin is a crucial one: compile a comprehensive network assessment report. This report is not just a documentation of the issue but a strategic document that sheds light on:
- The root causes of network issues
- When and where bottlenecks appear
- Responsible teams for troubleshooting
- And most importantly, insights on optimizing the network against future issues
Now, it’s time to roll up your sleeves and put together a stellar network assessment report with Obkio’s Network Monitoring Web Application!
1. Understanding Your Network Locations and Services
Here’s a real-life example of a network issue with the right steps to effectively report and address it.
When you log onto Obkio’s app, you are presented with a holistic view of the network's health through Obkio’s Chord Diagram. This diagram visualizes the live performance of all network branches equipped with Obkio Monitoring Agents that send probes using synthetic traffic.
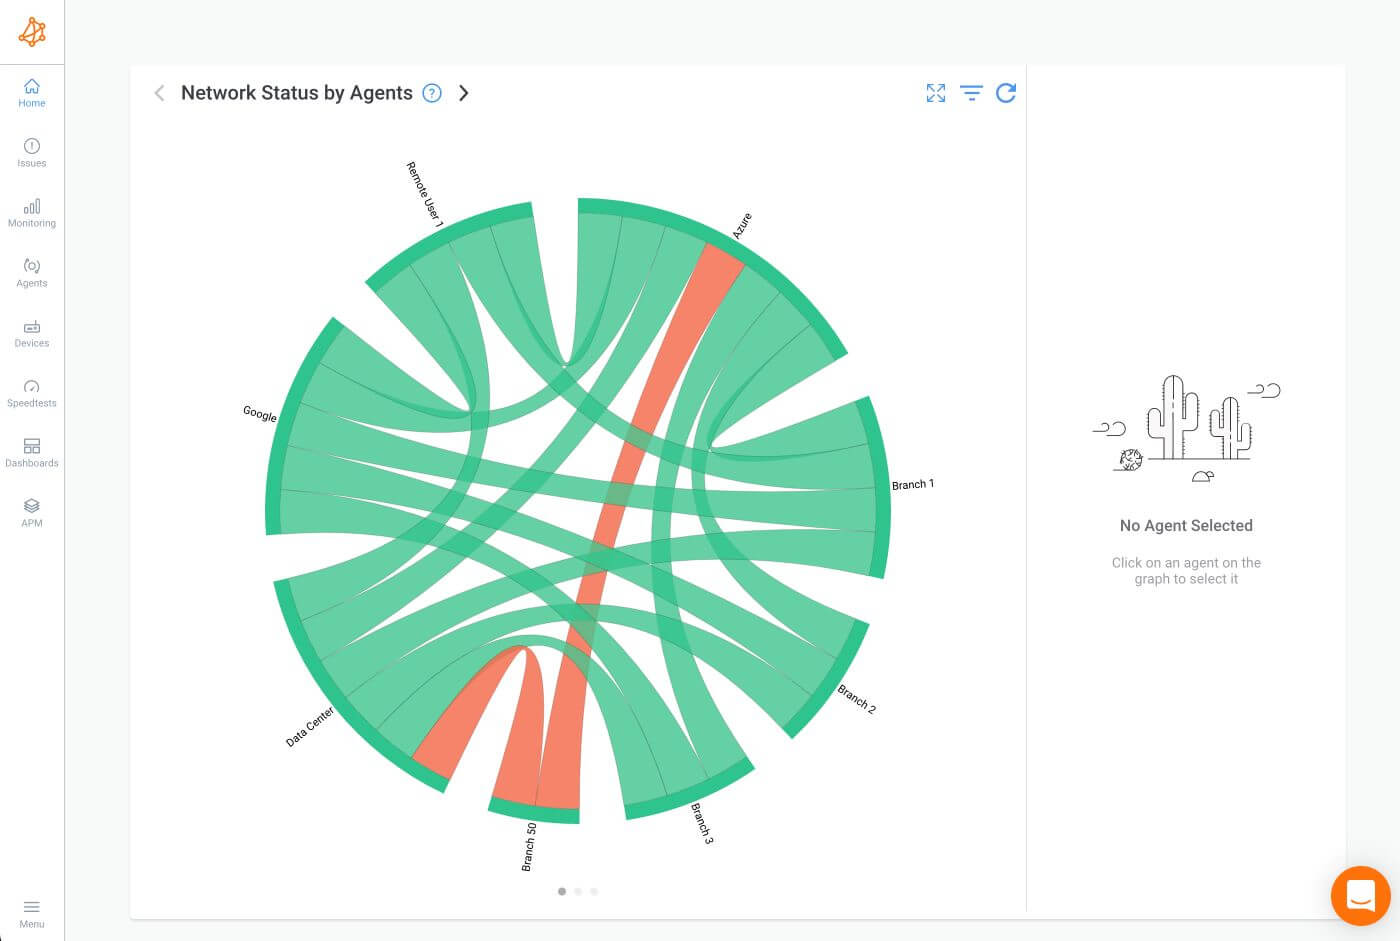
The chord diagram serves as the initial point of entry, offering real-time insights that lay the groundwork for a concentrated investigation into the overall reported network performance.
From this starting point, we’ll delve deeper, guiding you through the process of building a custom dashboard and adding essential graphs and widgets that are integral to constructing your personalized network assessment report.
Network Monitoring Agent Details:
By selecting the affected branch, Branch 50, on the Chord Diagram, you can zoom in on the specific Monitoring Agent and Monitoring Session responsible for the reported issues.
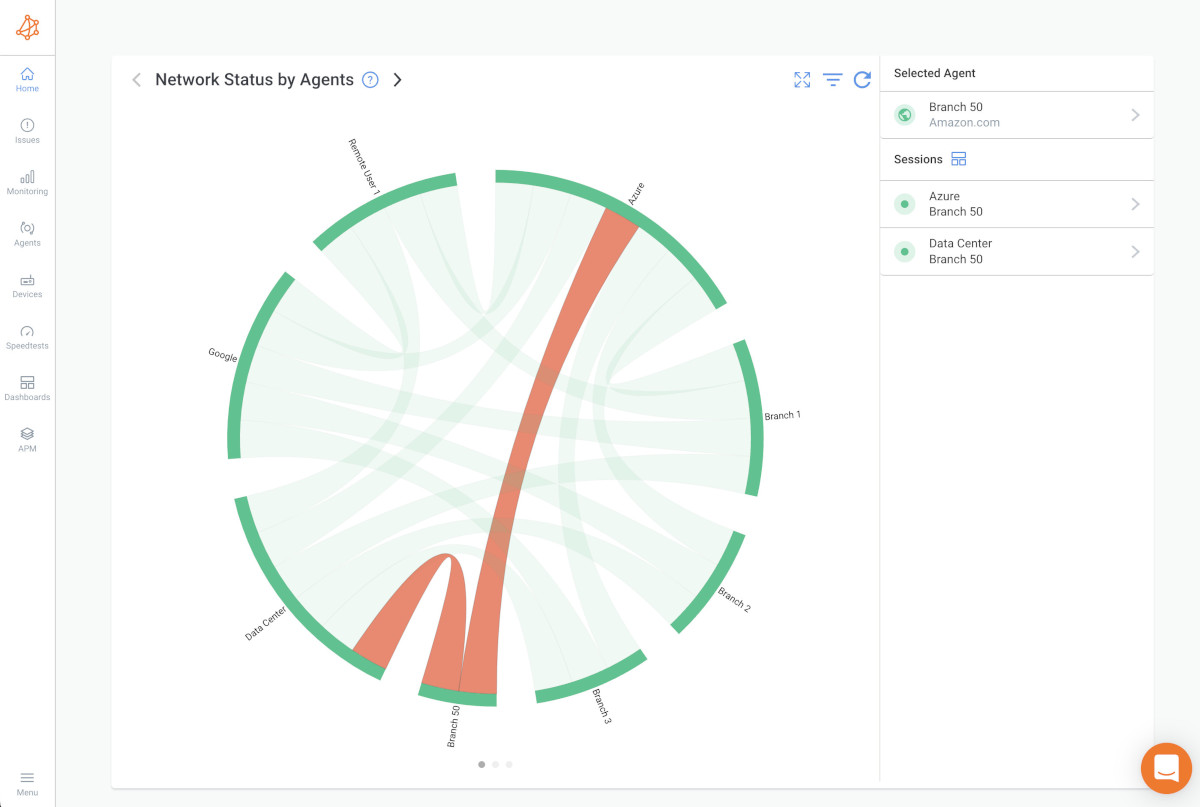
The red status on monitoring sessions immediately signals a performance problem with UDP packets, pinpointing the location of the issue. For example, UDP packet loss.
The Network Session Page:
Choose the monitoring session between the Branch 50 and Data Center Agents in Obkio's Network Monitoring software to drill down even deeper, and then go into the Network Session Page.
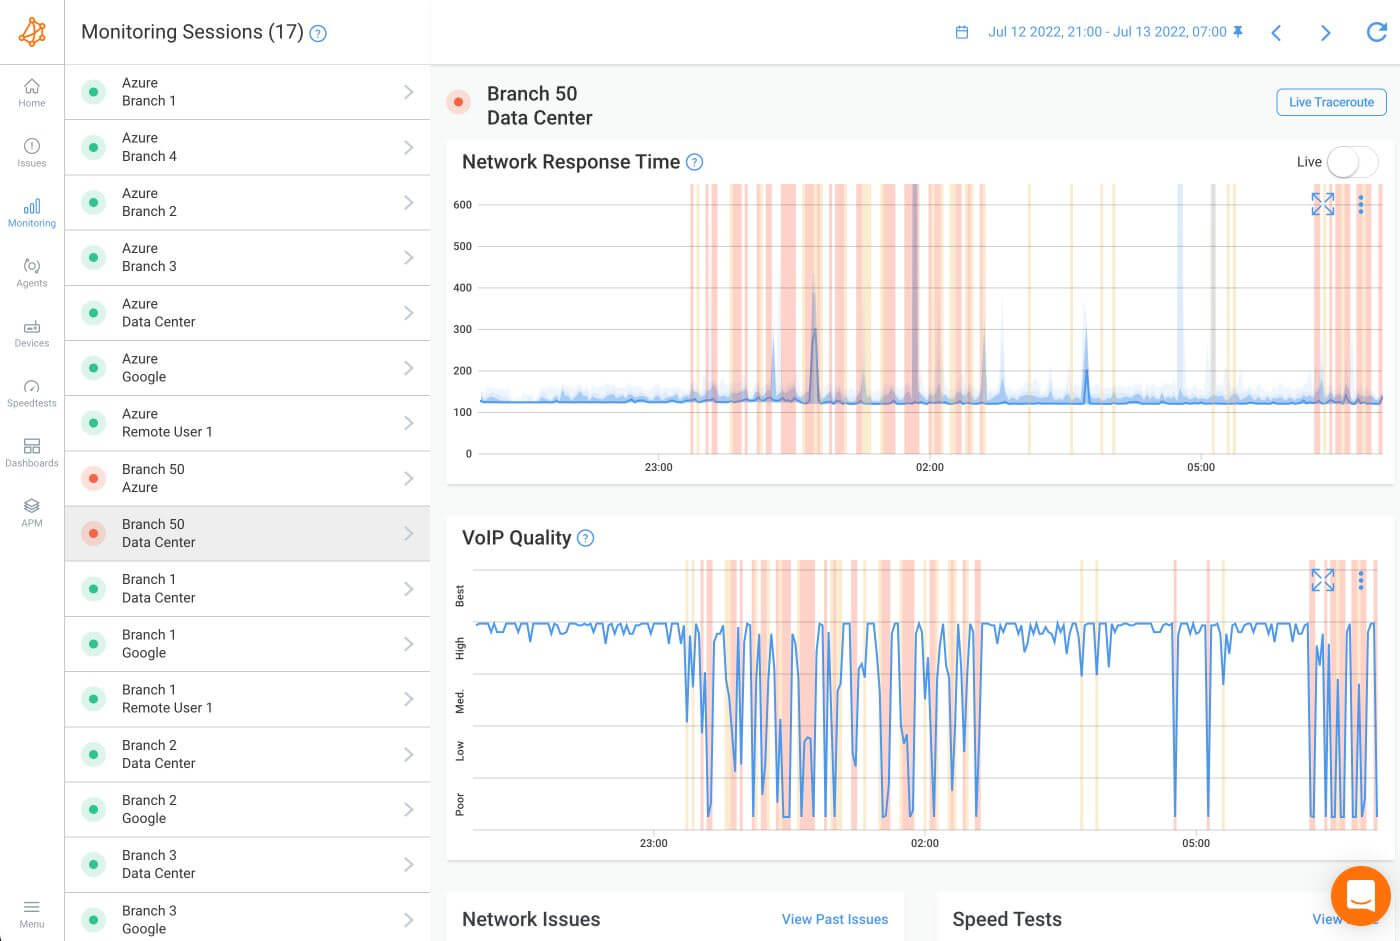
These essential graphs form the initial segment of your network assessment report. The two primary graphs above provide crucial insights into the network's health: VoIP Quality for the last 10 hours and Network Response Time. You have the flexibility to either export these graphs directly or seamlessly integrate them into a custom dashboard tailored to your specific reporting needs.
- The Network Response Time Graph displays raw network metrics such as Jitter (shown by the various blue hues surrounding the solid blue line), Latency (represented by the solid blue line), and Packet Loss (represented by the yellow and red columns).
- The VoIP Quality Graph measures MoS and gives Branch 50 users visibility into the call quality using the metrics of the Network Response Time graph.
Two instances of notable packet loss are depicted in the graph. A nightly one that runs from approximately 23:00 to 2:00 and a continuous one that begins at approximately 6:00.
2. Building Your First Dashboard For Your Network Assessment Report
Developing a Dynamic Dashboard holds immense value in the context of the network assessment. It enables you to perform a comprehensive comparison of network performance across various locations, providing a nuanced understanding of how different segments of your network are functioning. This comparative analysis is a key component in the broader range of the network assessment, offering valuable insights into:
- Overall network health
- The scope of network issues
- Network performance of each location.
Below is a Dynamic Dashboard from the Data Center's perspective:
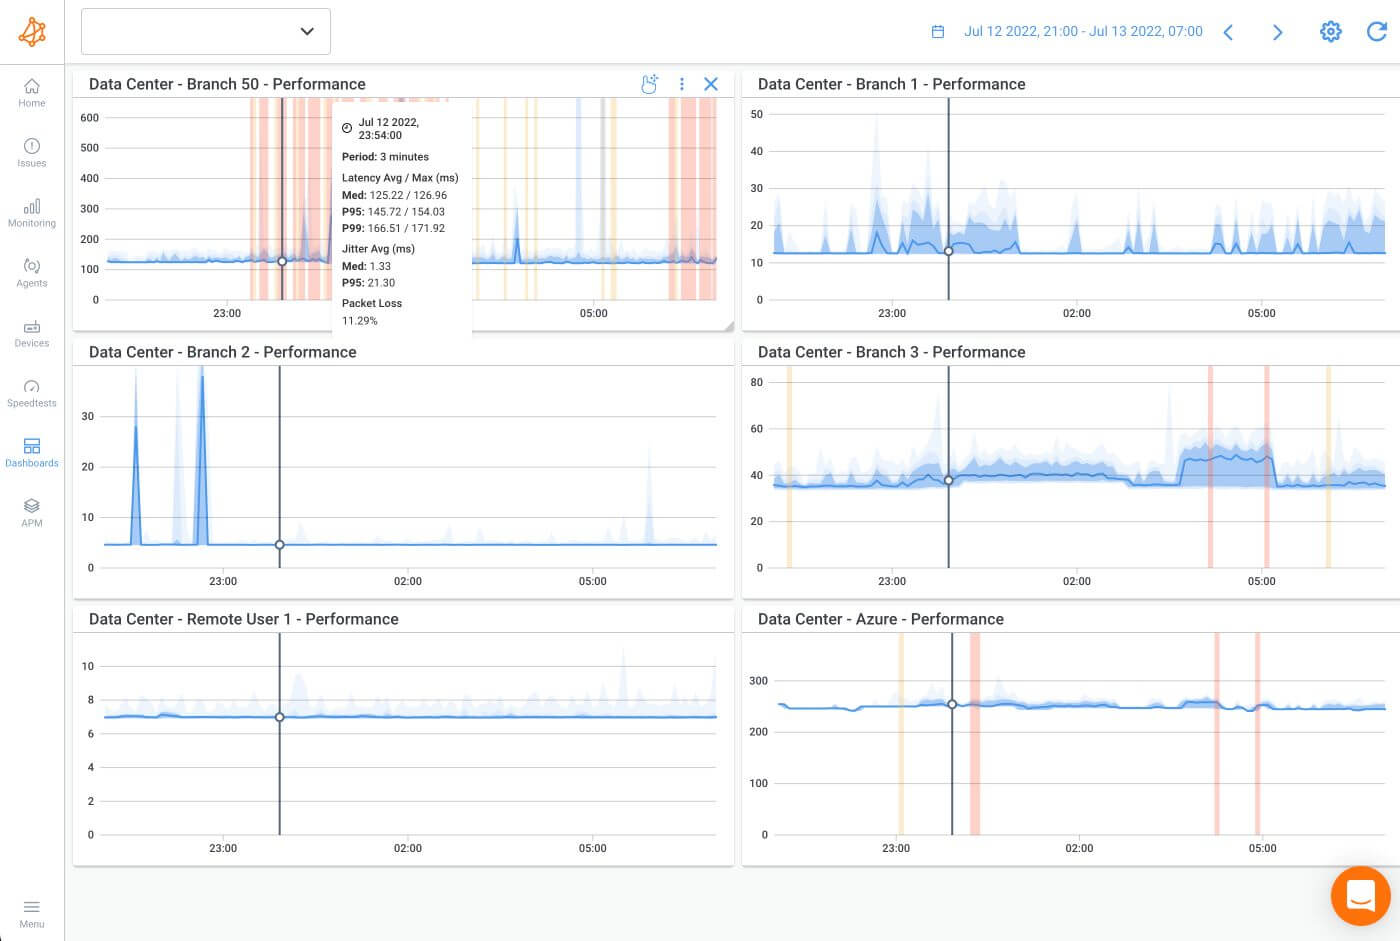
This step is pivotal in confirming that the issue (more than 11% packet loss) is localized to Branch 50, ruling out problems originating from the Data Center side.
Branch 50 Dynamic Dashboard:
Building a Dynamic Dashboard specific to Branch 50's perspective provides further clarity.

The network monitoring graph from Branch 50 to the Microsoft Azure Public Monitoring Agent (supplied by Obkio and accessible via the Internet) and the network monitoring graph between Branch 50 and the Data Center both exhibit an 11% packet loss.
Given that both monitoring sessions exhibit the same pattern, Branch 50 is obviously the source of the performance problem.
3. Identifying Network Issues in Your Network Assessment Report
Knowing that Branch 50 is experiencing a network issue, you can choose to use the premade dashboard that was created especially for the branch before the incident, which provides a quick overview of the branch's network health.
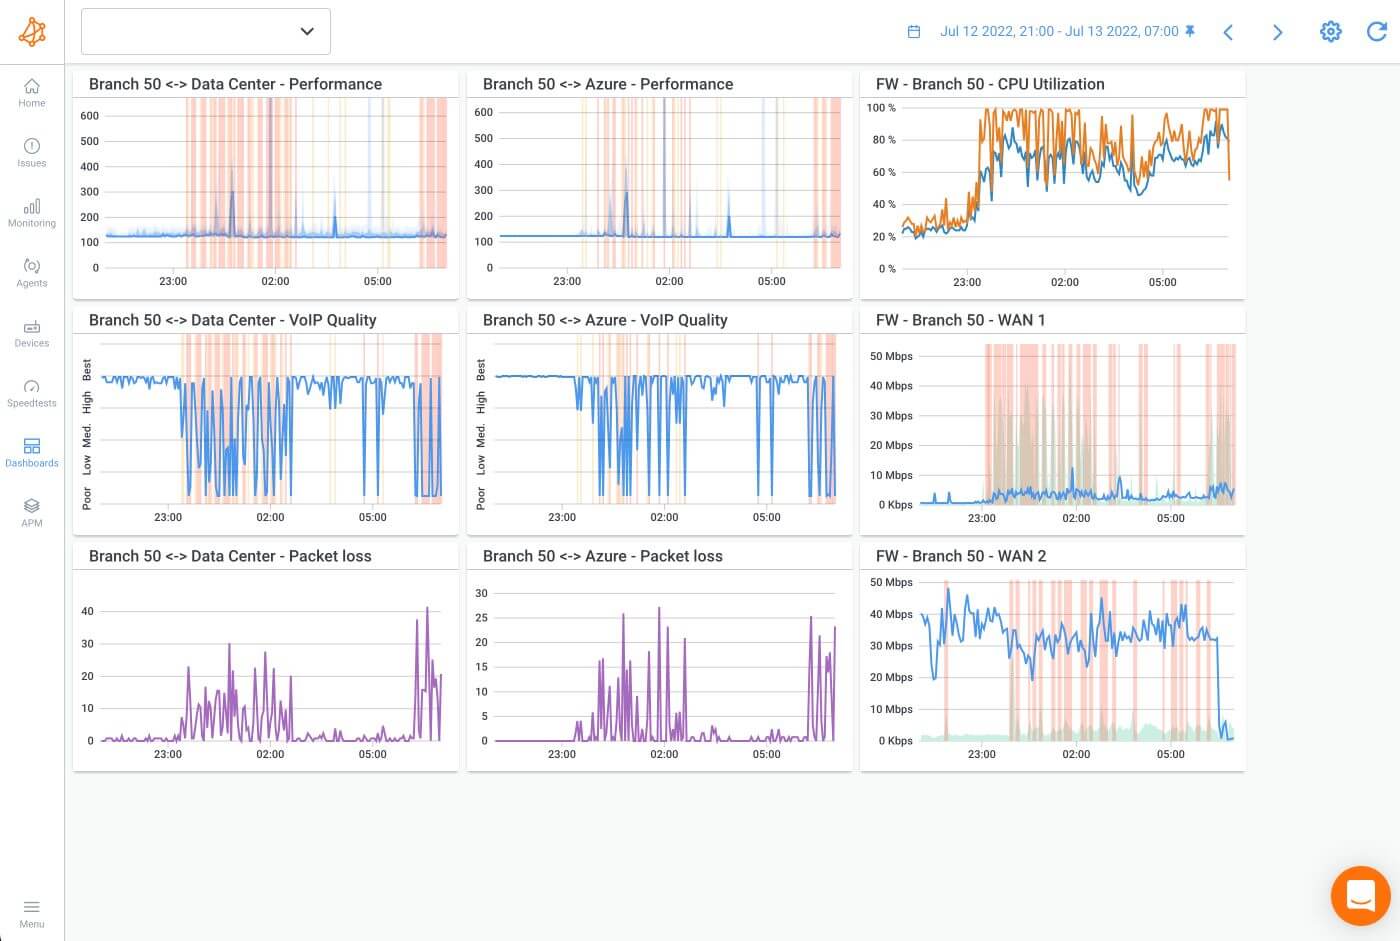
The dashboard displays VoIP Quality and Packet Loss graphs for various destinations together with network performance graphs for the Data Center and Microsoft Azure Agents.
Look at the graphs in the dashboard's final column. The graphs display CPU and bandwidth utilization on both WAN ports based on data obtained from SNMP polling, which is carried out from the Branch 50 Agent to the Branch 50 SD-WAN Firewall.
Every packet loss test is accompanied by an increase in WAN port 1 bandwidth utilization and a high CPU usage rate.
P.S. The Network Device Monitoring feature of Obkio is used to keep an eye on network devices and equipment.
The Issue with the Network
So we conclude that the firewall is discarding a lot of packets because it is unable to process the volume of traffic and lacks CPU.
When you log into the firewall, you can discover that a source IP is transferring files while consuming a lot of bandwidth.
Fix the problem temporarily by applying a rate-limiting rule to file transfers, which drastically lowers the Firewall's bandwidth and CPU consumption.
4. Adding Traceroute Results to Your Network Assessment Report
Moving forward in the network assessment process, particularly when delving into a thorough troubleshooting phase, leveraging Obkio Vision becomes instrumental. It is an advanced Visual Traceroute tool, offering a sophisticated means to analyze and troubleshoot network issues at their roots.
As part of the network assessment report, the inclusion of traceroute test results is crucial. Traceroutes obtained through Obkio Vision, provide a detailed map of the network's routes, showcasing the journey of data packets and pinpointing areas of concern.
You have the ability to not only export traceroute results for documentation but also share them seamlessly with relevant teams using a generated link. This integration of traceroute data adds a layer of depth to the network assessment report, offering a visual representation of the network's intricacies and aiding in the effective communication of troubleshooting processes.
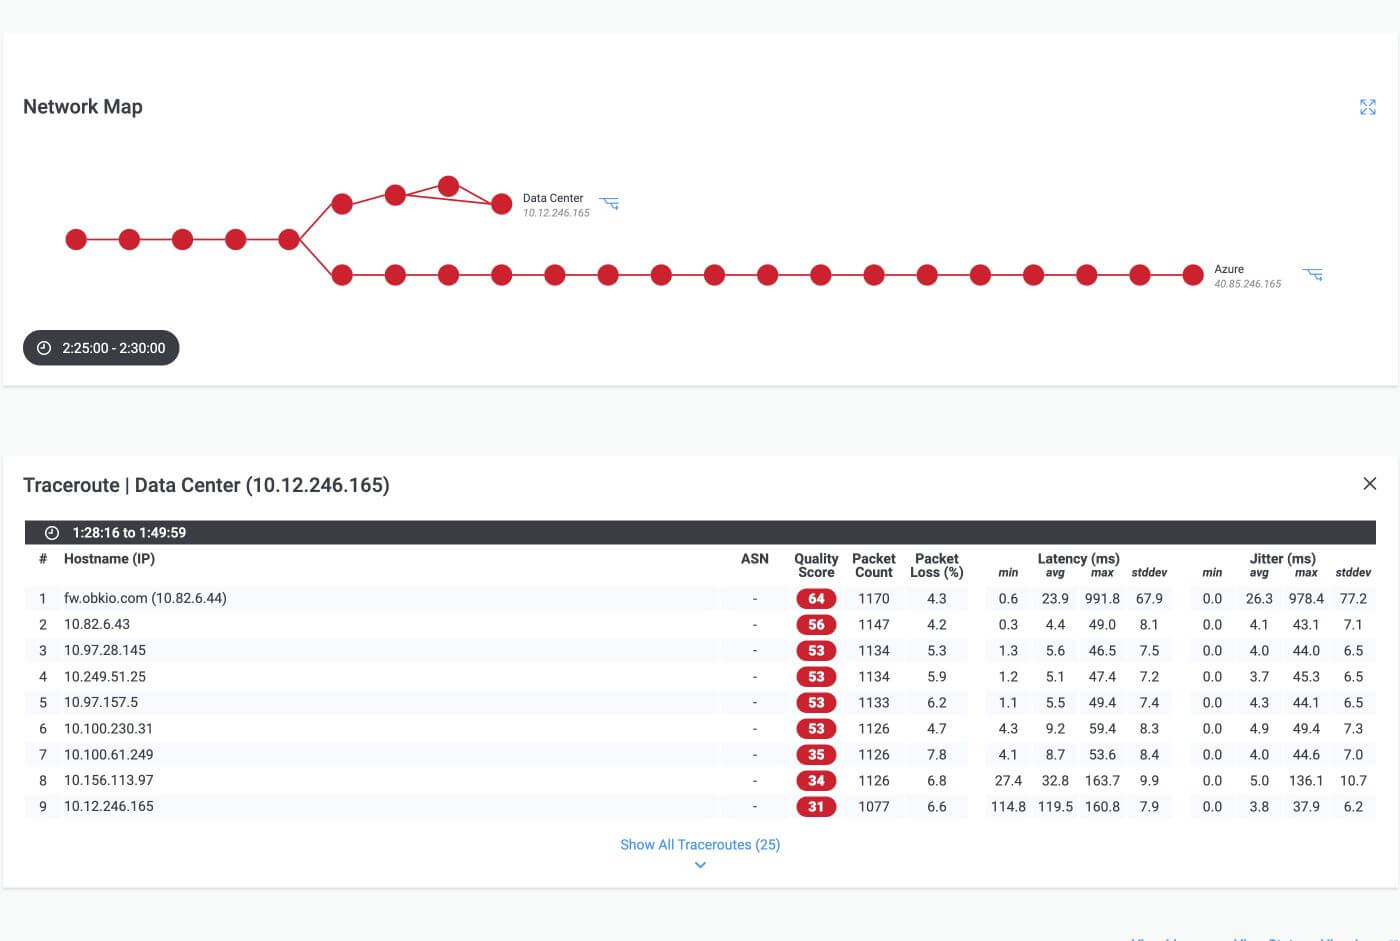
The network admin verifies that the packet loss originated at the SD-WAN Firewall by examining the Network Map and Traceroute data.
The traceroutes also show that, in comparison to the other hops along the route, the Firewall is responding to the ICMP packets with noticeably higher delay and jitter.
From this vantage point, you can confirm that there is a problem with the network equipment.
5. Configuring Issues Alerts for the Network Assessment Report
To delve deeper into the intricacies of your network assessment report, issue alerts emerge as a pivotal component, providing real-time insights into the current state of your network. Alerts serve as a dynamic indicator, promptly notifying you of any ongoing issues and offering a quantitative measure through the count of alerts.
Navigate to the Network Monitoring app's settings on Obkio to gain a comprehensive understanding of the Network Monitoring Thresholds. These thresholds play a crucial role in determining when alarms are triggered, signalling the occurrence of network problems. By exploring and configuring these thresholds, you not only fine-tune the sensitivity of your network monitoring but also tailor the alert system to align with the specific needs and priorities of your network infrastructure.
In essence, alerts become the pulse of your network assessment report, vividly highlighting and categorizing the issues affecting your network health.
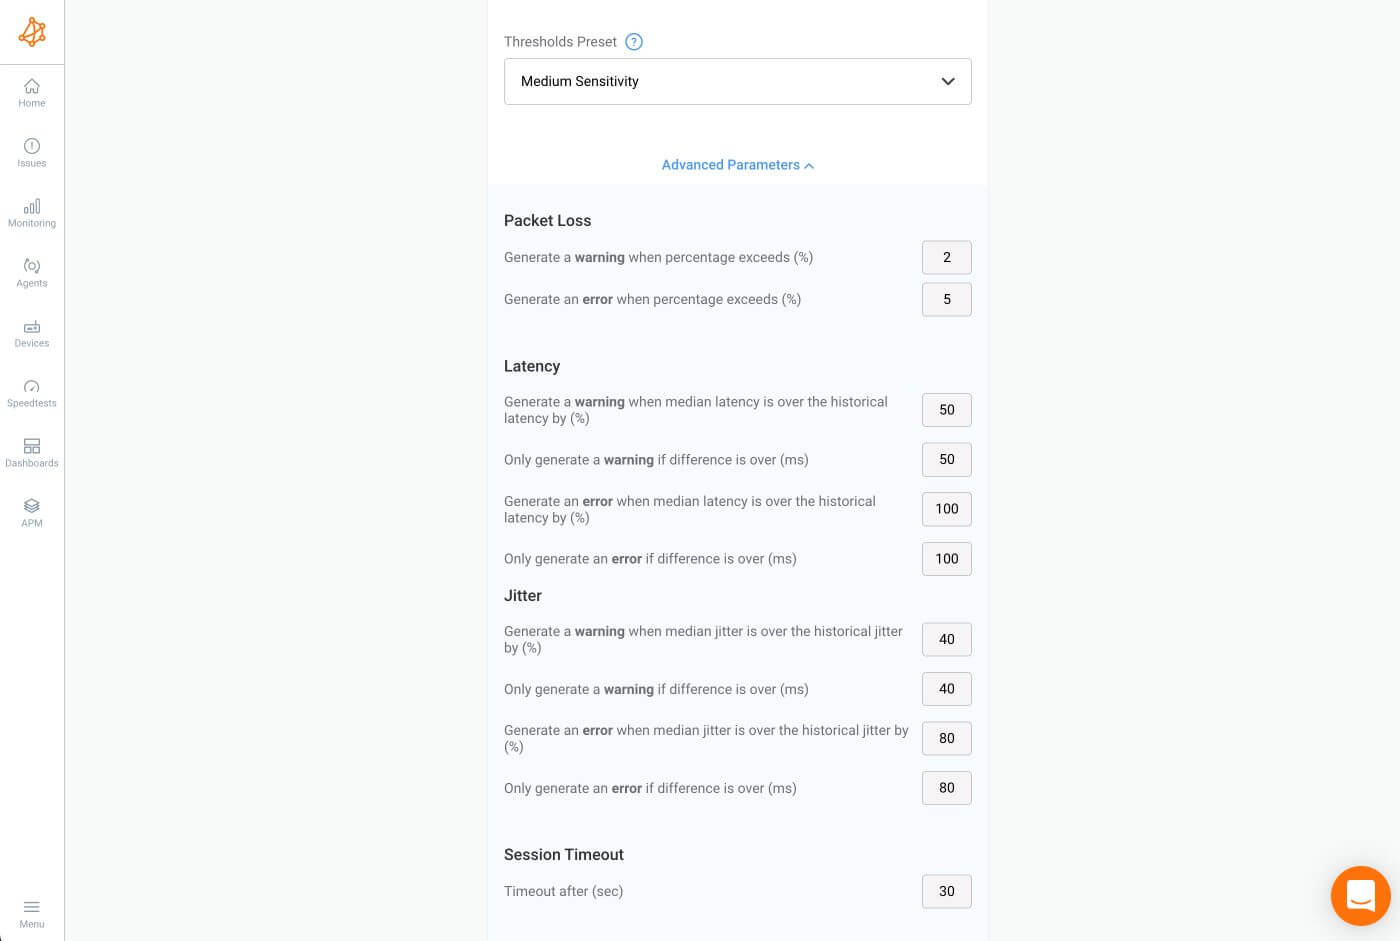
As seen by the yellow and red columns in the previous graphs, the sessions are set up to cause an error issue for more than 5% packet loss and a warning issue for more than 2% packet loss.
Additionally, thresholds for latency and jitter are in place to highlight problems with these measurements.
Email Notifications:
You can choose to receive notifications from Obkio via email, Slack, and Teams. Additionally, you have the option to set up delays before sending the user notifications.
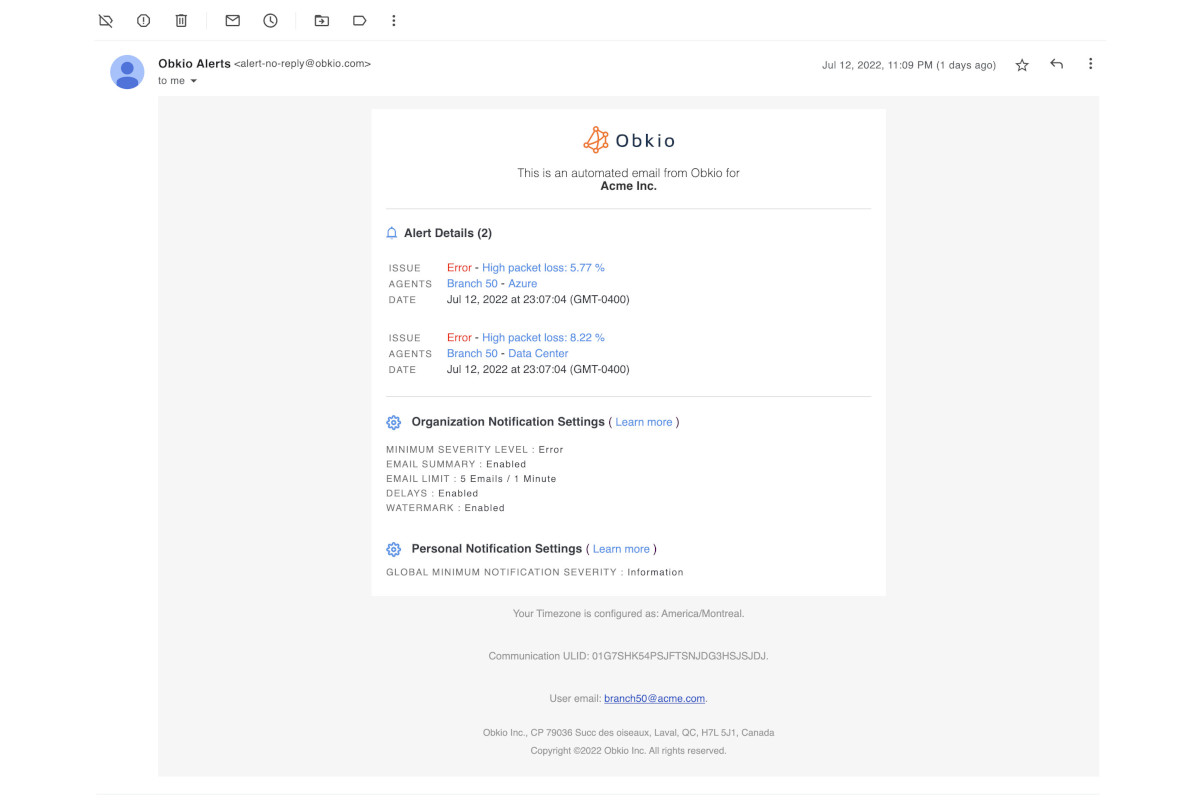
When the first episode started at roughly 23:00, look at your mailbox and confirm that you had received an email notification pointing out the packet loss on both sessions.
Obkio's Network Monitoring Web Application not only facilitates in-depth network assessments but also streamlines the process of creating detailed and visually intuitive Network Assessment Reports. These reports serve as valuable tools for communication across technical and non-technical teams, empowering all stakeholders to make informed decisions for optimizing network performance and ensuring future resilience.
Post-Network Assessment Report Monitoring
The primary objective of the network assessment report is to provide a comprehensive overview of the network assessment, covering identified networks, hardware and software components, performance metrics, security measures, policies, and suggested improvements.
To enhance the clarity and efficiency of the implementation process, it is advantageous to categorize all recommendations into different priorities—designating them as low, medium, or high priority based on severity levels. This strategic approach aims to ensure that critical concerns are promptly and appropriately addressed as well as streamline the work of your network admin.

By prioritizing recommendations according to their severity and origin, Managed Service Providers can optimize the effectiveness of their network assessment endeavours and promptly attend to the most vital aspects requiring improvement.
View network assessment reports as regular check-ups for your digital infrastructure. Engaging in consistent monitoring, ideally scheduled every 6 months or annually, enables you to stay proactive against potential issues, adapt to evolving business objectives, and accommodate the expansion of your network. Consider this practice akin to preventive care for the overall well-being of your network.
Leveraging the data collected through Obkio's application, you can conclude your Network Assessment by generating Network Performance Reports. Employ Report Schedules to automate the execution and generation of reports on a daily, weekly, or monthly basis. These reports provide an executive summary of your network's performance health, spotlighting any identified issues for swift attention and resolution.
Conclusion: Starting Your Network Assessment Report
The journey through crafting a comprehensive network assessment report has unveiled a transformative perspective – one that challenges the notion of a traditional, text-heavy Excel sheet.
With the power of interactive and visual tools like Obkio's Network Monitoring Tool, network assessment reports are no longer confined to mere statistics; they become dynamic, intuitive, and engaging representations of your network's health.

The benefits of adopting a visual approach are manifold. From real-time insights with chord diagrams to the creation of custom dashboards and graphs, each element serves as a stepping stone toward enriching the depth of your reports and enabling business owners to grasp the intricacies of their digital infrastructure.
Embrace the interactive and visual capabilities of Obkio and embark on your network assessment journey. Transform the way you perceive and present network performance – start your network assessment today!

