


Measuring VoIP Call Quality with MOS
- What is the VoIP Quality MOS Score
- How to calcule MOS Score using network metrics
- How network metrics influence MOS Score
What you are going to learn:
Obkio Measures VoIP Quality 
Obkio’s Network Monitoring tool continuously measures VoIP Quality using MOS score for call quality to guarantee optimal performance for VoIP applications.
Measure end-to-end VoIP Quality for your business between key business locations (head office, branches, remote offices), and your users, all the way up to your Service Provider network.
Continuous monitoring is essential to catch VoIP Quality issues as soon as they happen, and identify if they’re happening in your network or your VoIP Service Provider’s network.
What is VoIP Quality Mean Opinion Score (MOS)
The Mean Opinion Score (MOS) has been a commonly-used metric to measure the overall voice call quality for decades. MOS score is a rating from 1 to 5 of the perceived quality of a voice call, 1 being the lowest score and 5 the highest for excellent quality. It has been standardized by the International Telecommunications Union ITU-T.
MOS was originally developed for traditional voice calls but has been adapted to Voice over IP (VoIP) in the ITU-T PESQ P.862. The standard defines how to calculate MOS score for VoIP calls based on multiple factors such as the specific codec used for the VoIP call. Each VoIP codec (ex: G.711, G.722, G.723.1, G.729) behaves differently. Some codecs such as G.711 are uncompressed for higher quality but use more bandwidth than compressed codecs such as the G.729.
The MOS score we measure is the G.711 codec, which is by far the most commonly used codec for VoIP calls. The maximum MOS in VoIP for a G.711 call is 4.4.
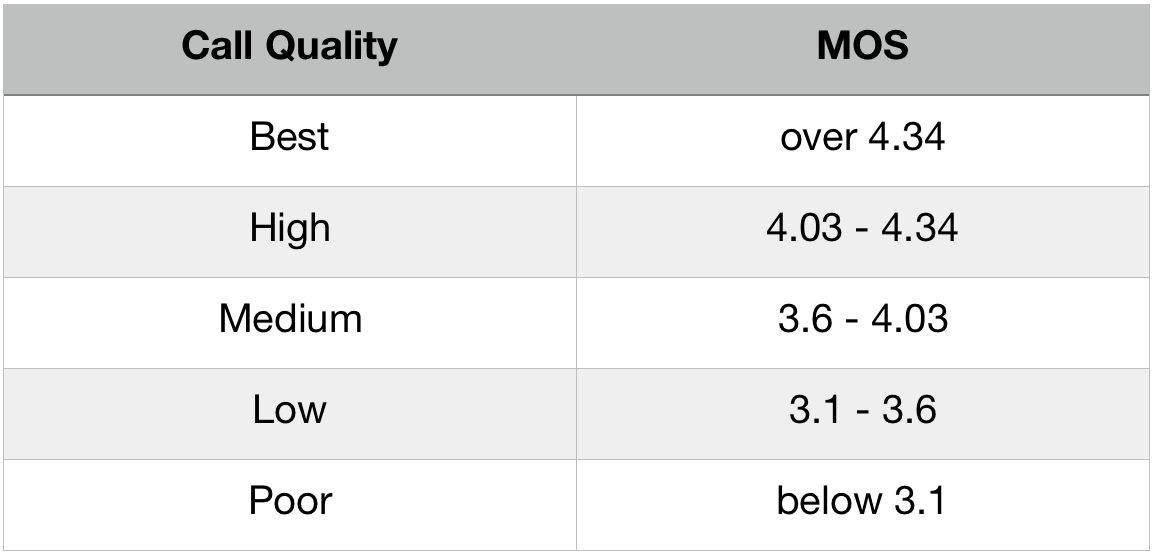
MOS Score vs Call Quality
We select the Call Quality in the App based on the MOS Score. The following table lists the different qualities and the lower MOS limit for each of them. The limit values are from the ITU-T standards.
VoIP Quality and Network Monitoring Sessions
On each Network Monitoring Session page, located below the standard Network Monitoring Graph, there a is a graph that details the VoIP Quality for the session. This is where we display results related to MOS Score VoIP metrics. The y axis on the graph is the VoIP Call Quality (from Best to Poor) and the exact VoIP MOS Score test is available in the mouse tooltip.
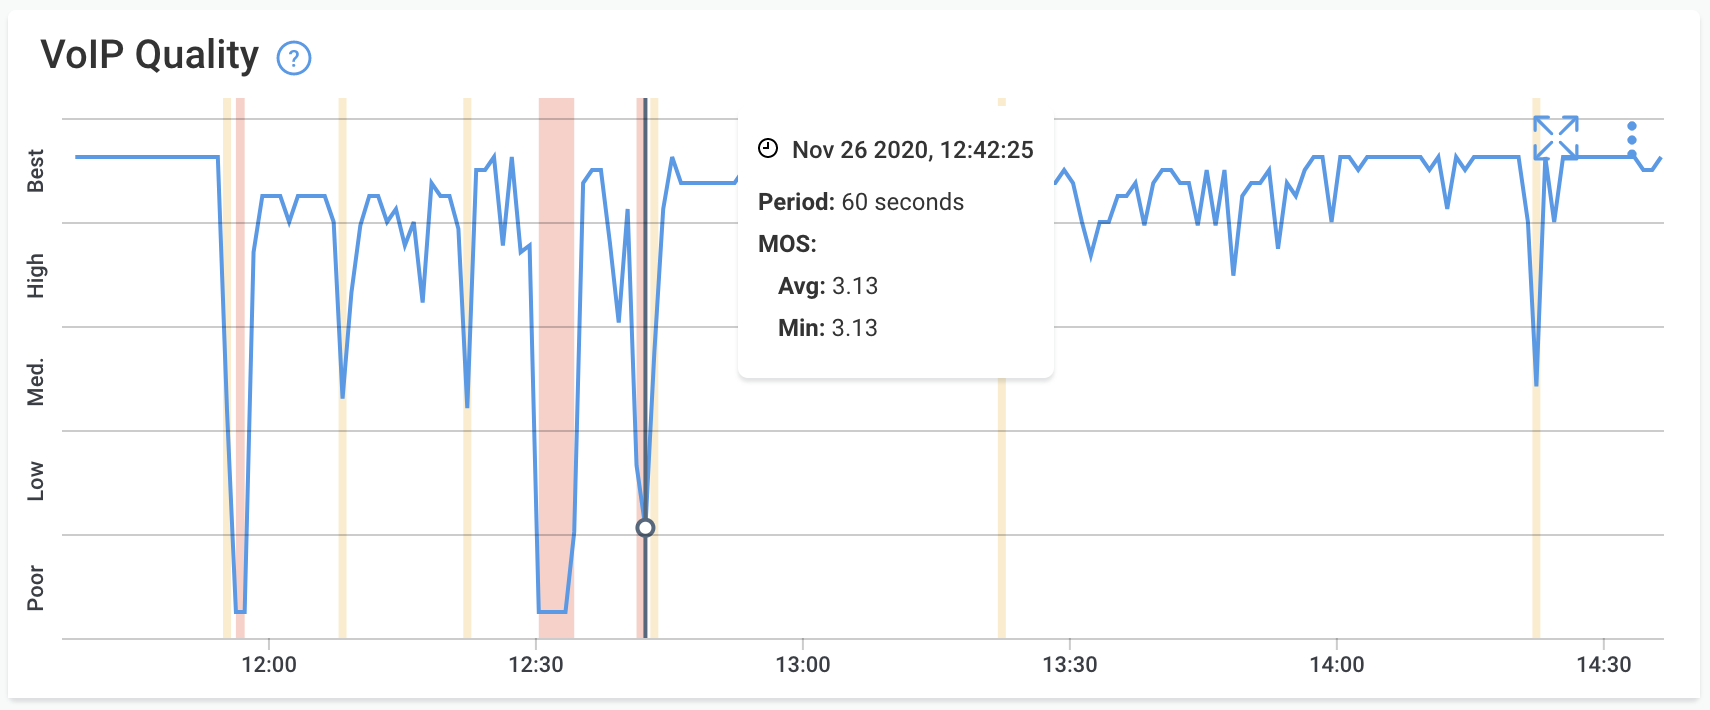
In the graph, the yellow area indicates a voip call quality score of Medium and the red area a voip call quality of Bad or Poor. As for the network response time, if there is aggregation, the worst value is displayed (i.e. the smallest MOS score).
QoE (Quality of Experience)
It's important to understand the impact of VoIP quality on the end-user experience to understand if performance issues are affecting the end-user. That’s why Obkio measures QoE (Quality of Experience) metric, which represents the quality and end-user experience during a VoIP call.
Blog Post
A more detailed article about measuring VoIP MOS quality of a call is available on our Blog: Measuring VoIP Quality with MOS Score (Mean Opinion Score).
