


Table of Contents
Table of Contents
Many businesses rely on SD-WAN services to deliver optimal Internet, cloud, and UC performance. But like any network, SD-WAN can experience network issues that affect user experience. So you need to be ready.
Essentially, the most common SD-WAN issues are caused by network bandwidth congestion (network bottleneck) or high network devices ressources usage (High CPU). This usually occurs on the Local Loop or the customer Edge Router, which are both prone to network congestion.
In addition, most of the problems in an ISP's backbone that can cause SD-WAN issues are related to congestion on their peering and transit paths with other networks or Service providers. Although ISP's backbone are more reliable and robust than other network infrastructures, performance issues can still happen. The same goes for SD-WAN networks in general. SD-WAN vendors promise their solution is magic, but the user experience is not always magical.
Keep reading for more details about where SD-WAN issues occur, and concrete examples of the 3 most common issues and how to identify them.
This article is part of a series of articles about monitoring and troubleshooting SD-WAN networks before, during, and after migrations. The articles include:
- How to Monitor SD-WAN Migrations
- How to Monitor MPLS to SD-WAN Migrations
- How to Monitor SD-WAN Networks
- SD-WAN Troubleshooting
- Most Common SD-WAN Issues (this article)

Learn how to monitor SD-WAN networks with Network Monitoring to get complete visibility over your SD-WAN service and identify SD-WAN issues.
Learn moreWhere SD-WAN Issues Occur In A Network 
SD-WAN issues can arise at various points within a network infrastructure. By understanding where SD-WAN issues may arise, organizations can focus their troubleshooting efforts on those specific points, enabling them to address the problems effectively and optimize the overall performance and reliability of their SD-WAN deployments.
In this section, we will explore the key areas where these issues commonly occur.
1. SD-WAN Issues in "The Last Mile"
Since always, the weakest link in a network has always been the last mile. The last mile is the last segment of the network, which generally has the lowest speeds, the least route diversity and the most single points of failure.
SD-WAN networks are no exception to this rule.
So it wasn't a surprise for our team of network pros to discover that 75% of our customer base experience SD-WAN issues located on the last mile of their network.
This is why most SD-WAN networks rely on more than one link.
The assumption is that, if a problem occurs, it should not affect all the links at the same time and the SD-WAN Edge Router should be able to load-balance the network sessions on the best link available. But link diversity on its own is not enough to avoid all issues that can happen in SD-WAN Networks.
2. SD-WAN Issues in WAN Edge Devices
SD-WAN deployments typically involve WAN edge devices located at branch offices or remote sites. Issues with these devices can include hardware or software failures, misconfigurations, or compatibility problems with other network components.
3. SD-WAN Issues in Transport Links
SD-WAN relies on different transport links, such as MPLS, broadband, or LTE, to transport data between locations. Issues can arise if these links experience disruptions, congestion, or poor performance, leading to latency, packet loss, or unreliable connectivity.
4. SD-WAN Issues in Routing and Traffic Optimization
SD-WAN dynamically routes traffic based on policies and prioritizes applications for optimal performance. Issues may occur in accurately identifying and prioritizing applications, leading to suboptimal traffic routing or performance degradation.
5. SD-WAN Issues in the Centralized Controller
SD-WAN solutions often have a centralized controller that manages and orchestrates network policies. Issues may arise if the controller experiences failures, becomes overloaded, or suffers from misconfigurations, impacting the overall functionality and control of the SD-WAN deployment.
6. SD-WAN Issues in Applications
SD-WAN aims to optimize application performance by dynamically routing traffic. However, issues can occur if the SD-WAN solution fails to accurately identify critical applications or if application-specific problems arise, leading to degraded performance or poor user experience.
Understanding where SD-WAN issues commonly occur in a network allows organizations to focus their troubleshooting efforts and implement necessary measures to mitigate these issues. By addressing problems at these specific points, organizations can optimize the performance, reliability, and security of their SD-WAN deployments.
Understanding the SD-WAN Network Design
To truly understand what SD-WAN issues can happen, you need to first understand what SD-WAN networks look like and where the SD-WAN issues can happen in the network.
The image below is a diagram of an SD-WAN network site communicating with a Data Center, Head Office or IaaS.


1. The Underlay:
The Underlay refers to the underlying network infrastructure that supports the SD-WAN deployment. It consists of the physical or virtual network connections, including routers, switches, and transport links, that provide the foundation for data transmission. Issues in the Underlay network can impact the overall performance of the SD-WAN solution. Common problems include network congestion, network overload, link failures, latency, or inadequate bandwidth.
- The Internet
- Internet Local Loop
- Internet Provider’s Edge Router
- ISP Backbone
- ISP Peering Point
2. The Overlay:
The Overlay network is created by the SD-WAN solution and operates on top of the Underlay network. It encapsulates and transports data packets between the WAN edge devices, utilizing the available transport links based on defined policies and traffic conditions. Issues within the Overlay network can affect the routing, QoS, or performance optimization capabilities of the SD-WAN solution. These issues can include misconfigurations, policy conflicts, or suboptimal traffic routing decisions.
- IPsec Tunnel from one site to another
3. The LAN:
The LAN represents the internal network within an organization's premises, connecting devices within a local area. While SD-WAN primarily focuses on optimizing wide area networks, it interacts with the LAN to provide end-to-end connectivity. Issues in the LAN infrastructure, such as network bottlenecks, misconfigured switches, or security vulnerabilities, can impact the overall performance and user experience of the SD-WAN deployment.
- SD-WAN Edge
- Core & Distribution Switches
- Access Switches
How to Identify SD-WAN Issues with SD-WAN Monitoring
Before we dive deeper into the 3 most common SD-WAN issues, it’s important to understand that there are a variety of network problems that can affect your SD-WAN network.
- Bandwidth limitations: While SD-WAN can improve network performance, it relies on the underlying network infrastructure. If the available bandwidth is limited or congested, it can affect the overall performance of the SD-WAN solution.
- Quality of Service (QoS) challenges: SD-WAN utilizes various transport technologies, such as MPLS, broadband, or LTE, to route network traffic based on policies. Ensuring consistent QoS across different transport types can be challenging, and organizations may experience issues with latency, packet loss, or jitter.
- Network compatibility: SD-WAN solutions often integrate with existing network infrastructure, such as firewalls, routers, and switches. Compatibility issues between different vendors or legacy systems can arise, leading to configuration problems or limited functionality.
- Security vulnerabilities: While SD-WAN can enhance network security through features like encryption and segmentation, it also introduces potential vulnerabilities. If not properly configured or managed, SD-WAN deployments can be susceptible to security breaches, unauthorized access, or data leakage.
- Complexity in deployment and management: SD-WAN solutions can be complex to deploy and manage, particularly in large-scale environments. Organizations may face challenges in terms of configuring policies, managing multiple vendors, ensuring interoperability, and maintaining a unified view of the network.
- Application performance issues: SD-WAN relies on intelligent traffic routing to optimize application performance. However, if the SD-WAN solution fails to identify and prioritize critical applications accurately, it may lead to performance issues or suboptimal user experiences.
- Lack of visibility and troubleshooting: Traditional network monitoring and troubleshooting methods may not be fully compatible with SD-WAN deployments. The dynamic nature of SD-WAN can make it difficult to gain comprehensive visibility into network traffic and identify the root causes of performance issues or outages.
- Service provider limitations: If an organization relies on a managed service provider (MSP or MSSP) for SD-WAN implementation, they may face challenges related to service quality, response times, or lack of control over network configurations in the MSP network.
To be able to identify and troubleshoot SD-WAN issues that severely impact the user experience, you need end-to-end SD-WAN visibility.
To do so we recommend a modern decentralized Network Monitoring tool like Obkio Network Performance Monitoring software which continuously monitors end-to-end network performance with synthetic traffic using Network Monitoring Agents.

- 14-day free trial of all premium features
- Deploy in just 10 minutes
- Monitor performance in all key network locations
- Measure real-time network metrics
- Identify and troubleshoot live network problems


P.S. You can also use a very similar setup for monitoring SASE networks.
3 Most Common SD-WAN Issues Affecting Your Network
As we said above, there are a variety of SD-WAN issues that can occur, but some happen more often than others.
As we said above, the majority of SD-WAN issues happen in the last mile, generally in the Local Loop or the customer Edge Router.
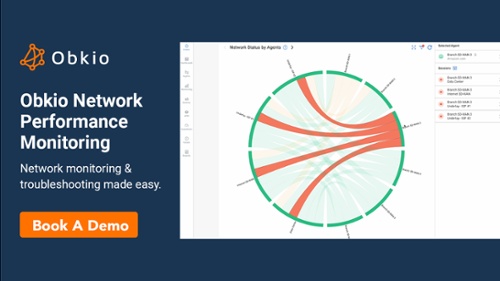
So we’re going to show you the 3 most common SD-WAN issues using concrete examples, and show you what they look like using Obkio’s Network Monitoring Software. We’re going to focus on SD-WAN issues happening in Branches #1, #2, and #3, which you can see in the Chord Diagram below.

With a tool like Obkio, you can identify and visualize SD-WAN issues, and be alerted as soon as they happen.
SD-WAN Issue #1. High CPU Usage on SD-WAN Devices
One common SD-WAN issue is high CPU usage on SD-WAN devices, which can have a significant impact on all network sessions.
When the CPU utilization on an SD-WAN device is high, it indicates that the device's processing capabilities are being strained and the device is struggling to process incoming and outgoing data efficiently. This can lead to delays, packet loss, and degraded performance for all network sessions passing through that device.

I. When Did the SD-WAN Issue Happen?
In the screenshot above, we can see an Obkio Dashboard for a Branch #3 with various Obkio’s performance graphs. The selected view shows performance over the last 8 hours.
Column 1 shows the UDP monitoring session performance from the Branch 3 Monitoring Agent towards the SD-WAN user experience Monitoring Agents.
- The first graph shows the Internet SD-WAN user experience
- The 2 bottom graphs show the experience of the Internet connections (ISP 1 & ISP 2)
After reviewing the information from the dashboard, we can see that:
- There is poor performance caused by high packet loss sequences, affecting all the traffic going through the SD-WAN network
- Both ISP #1 and ISP #2 are being affected
When analyzing the historical data on the dashboard to find a trigger or a pattern, we see that this is an intermittent problem (happens on and off) and doesn’t follow a specific pattern.
II. What is the SD-WAN Issue?
For ISP #1 and ISP #2 to be affected, this means that the network problem is happening on a network segment that is common to both ISPs.
Column 2 shows SNMP Polling (Device Monitoring) on the SD-WAN Edge Equipment and metrics for CPU Usage and Bandwidth Usage.
- Let’s focus on the CPU usage on the Firewall
- At the same time that ISP #1 and ISP #2 are experiencing performance issues, we can see that the CPU usage is at 100%
This is not a local loop issue and you don’t need to call your ISP. Like with the first CPU usage issue, this is a local problem. Significant traffic is being sent to that port, perhaps from a different application.
This could be in the LAN, or directly on the SD-WAN Edge Router.
Problems on Edge Routers are very common, because they are usually security devices with lots of features and software. The software and features are very resource intensive and can affect your CPU usage.
In Column 3, we can see performance for Zoom and Microsoft Teams call quality.
- When ISP #1 and ISP #2 are experiencing performance issues, it also affects Zoom and Teams call quality.
That’s because, if the CPU of the network device doesn’t have the power to treat the packets in real time, you’ll then experience high packet loss.
Packet loss can then affect the performance of network devices, as well as UC applications like Zoom and Microsoft Teams.
III. What Caused the SD-WAN Issue?
Several factors can contribute to this issue:
- Network Traffic Volume: If the volume of network traffic passing through the SD-WAN device exceeds its processing capacity, it can lead to high CPU usage. This situation commonly occurs when there is a sudden surge in network traffic or when the device is handling a larger workload than it was designed to handle.
- Complex Routing and Policy Configurations: SD-WAN devices rely on complex routing algorithms and policy configurations to optimize network traffic. If these configurations become overly complex or contain errors, the device may struggle to efficiently process and route packets, resulting in increased CPU usage.
- Security Processing: SD-WAN devices often incorporate security features, such as encryption, firewalling, or deep packet inspection. The additional processing required for these security functions can significantly increase CPU utilization, especially if there is a high volume of encrypted traffic or complex security policies.
- Firmware or Software Issues: Bugs, glitches, or compatibility issues in the firmware or software running on the SD-WAN device can lead to increased CPU usage. These issues may arise from software updates, configuration changes, or inherent flaws in the device's operating system.
The consequences of high CPU usage on SD-WAN devices affecting all sessions can be severe. It can result in performance degradation, increased latency, packet loss, or even network outages. Users may experience slow application response times, dropped connections, or intermittent network connectivity.
IV. How to Troubleshoot the SD-WAN Issue
In this situation, the SD-WAN problem is happening on a local network device, and not in your ISP’s network. So it’s up to you to troubleshoot.
- Look at the device logs to understand what process started at this time.
- Identify software bugs in your device.
- Look into if a software update was recently done and roll back to an older software version.
- Update your device’s firmware
- Look at Network Device Monitoring to understand if high CPU usage is happenening simultaneously with high bandwidth usage (not in this exemple).
- If high bandwidth usage is the cause, look at the firewall logs to understand if your traffic is legitimate or not.
- Manage priorities in your Firewall to prioritize certain traffic.
- Upgrade to a bigger device.
To troubleshoot high CPU usage on SD-WAN devices, the following actions can be taken:
- Capacity Planning: Evaluate the network traffic load and ensure that the SD-WAN device has sufficient resources to handle the expected throughput. If necessary, consider upgrading the hardware or allocating additional resources to meet the demand.
- Simplify Configurations: Review and optimize routing and policy configurations to eliminate complexity and potential errors. Simplifying configurations can help reduce the processing overhead on the SD-WAN device.
- Offload Processing: Consider offloading resource-intensive tasks, such as encryption or deep packet inspection, to dedicated hardware or specialized appliances. This can alleviate the CPU load on the SD-WAN device and improve overall performance.
- Update Firmware and Software: Keep the SD-WAN device's firmware and software up to date to ensure compatibility, bug fixes, and performance enhancements. Regularly check for updates and apply them as recommended by the device vendor.
After deciding on a resolution, look into the real-time data from Obkio's monitoring tool to see if your chosen course of action solved the issue.
SD-WAN Issue #2. High Bandwidth Usage
The second SD-WAN issue is on the the underlay of ISP #2 caused by high bandwidth usage. This issue occurs when there is an excessive consumption of bandwidth on the network provided by ISP #2.
Congestion and Performance Degradation: When there's high bandwidth usage in an SD-WAN environment, it can lead to congestion on the network links. This WAN or LAN congestion can result in increased latency, packet loss, and overall degraded performance for applications and services running over the SD-WAN.
Quality of Service (QoS) Challenges: SD-WAN relies on QoS policies to prioritize traffic based on its importance and requirements. High bandwidth usage can strain these QoS policies, especially if they are not configured optimally. This can lead to critical applications not receiving the necessary bandwidth, affecting their performance and user experience.
Link Saturation: If the bandwidth usage exceeds the capacity of the SD-WAN links, it can lead to link saturation. This means that the links are fully utilized, leaving no room for additional traffic or causing congestion that affects all traffic passing through those links.

In the screenshot above, we can see an Obkio Dashboard for a Branch #1 with various performance graphs. The selected view shows performance over the last 8 hours.
Column 1 shows the UDP monitoring session performance from the Branch #1 Monitoring Agent towards the SD-WAN user experience Monitoring Agents.
- The first graph shows the Internet SD-WAN user experience
- The 2 bottom graphs show the experience of the Internet connections (ISP 1 & ISP 2)
ISP #1 doesn’t show any performance issues:
- The solid blue line tells us that the latency is stable
- The different shades of blue suggest there is low jitter
- We don't see any yellow or red bars, which means that no packet loss is detected.
ISP #2 shows a clear performance issue caused by high packet loss measurements.
I. When Did the SD-WAN Issue Happen?
We need to focus on the top graph in the first column, which is the user experience.
When ISP #2 started experiencing issues, the users were using that link and also experiencing the issue. At some moment, the SD-WAN service switched from ISP #2 to ISP #1.
The issue stopped from a user standpoint because it switched to ISP #1, but ISP #2 is still experiencing issues although it isn’t being used.
At some point, the issue seems to stop, the SD-WAN service switches back to ISP #2. Then the issue comes back again on ISP #2 and the users start experiencing the issue again.
II. What is the SD-WAN Issue?
Column 2 shows SNMP Polling (Device Monitoring) on the SD-WAN Edge Equipment and metrics for CPU Usage and Bandwidth Usage.
- Let’s focus on the Bandwidth usage on WAN Port #2
- At the same time that ISP #2 is experiencing high packet loss, we can see that the bandwidth usage is over the available 500 mb bandwidth service.
From here we can see that the bandwidth usage is over the limit and determine that the high bandwidth usage is causing the packet loss. Obkio’s tool would have alerted you about the high packet loss with a Smart Notification.
In Column 3, we can see performance for Zoom and Microsoft Teams call quality.
- When ISP #2 is being used and experiences high packet loss, it also affects Zoom and Teams call quality.
This is not a local loop issue and you don’t need to call your ISP. Like with the first CPU usage issue, this is a local problem. Significant traffic is being sent to that port, perhaps from a different application.
What is the cause of high bandwidth usage on your SD-WAN network?
- Bandwidth Consumption: SD-WAN deployments utilize multiple ISPs or transport links to establish connectivity. In this case, ISP #2 is one of the underlay networks used in the SD-WAN infrastructure. When there is a high demand for bandwidth, such as increased data transfer or network-intensive applications, it can saturate the available bandwidth provided by ISP #2.
- Insufficient Bandwidth Allocation: The issue may arise if the bandwidth allocated by ISP #2 is inadequate to handle the actual network traffic requirements. This can occur due to misjudgment in network capacity planning or changes in network usage patterns. As a result, the available bandwidth becomes insufficient to accommodate the increased demand, leading to congestion and performance degradation.
- Competing Traffic: The high bandwidth usage issue can also be caused by competing network traffic on the underlay network of ISP #2. Other users or applications sharing the same network infrastructure may consume a significant portion of the available bandwidth, leaving limited resources for the SD-WAN deployment. This competition for bandwidth can result in decreased performance and throughput for SD-WAN traffic.
- Quality of Service (QoS) Settings: SD-WAN solutions often include QoS mechanisms to prioritize critical applications and traffic types, like QoS for VoIP. However, if the QoS settings are not properly configured or if there are conflicts in traffic prioritization policies, it can contribute to high bandwidth usage and impact the performance of the SD-WAN deployment.
The consequences of high bandwidth usage on the underlay of ISP #2 can include increased latency, packet loss, reduced throughput, and degraded network performance for SD-WAN traffic. This can negatively impact application performance, user experience, and overall productivity.
III. What Caused the SD-WAN Issue?
So what can cause high bandwidth usage in your SD-WAN network? There can be several possible causes for high bandwidth usage on the underlay of ISP #2 in an SD-WAN deployment. Let's look into it more:
- Increased Network Traffic: One of the primary causes of high bandwidth usage is an overall increase in network traffic. This can result from factors such as a growing number of users, increased usage of bandwidth-intensive applications, or higher data transfer volumes. If the network traffic surpasses the available bandwidth capacity, it can lead to congestion and reduced performance.
- Bandwidth-Intensive Applications: Certain applications, such as video streaming, large file transfers, or real-time collaboration tools, consume a significant amount of bandwidth. If these applications are used extensively within the network, they can consume a large portion of the available bandwidth, limiting resources for other SD-WAN traffic.
- Misconfiguration of QoS Policies: Quality of Service (QoS) policies play a crucial role in managing and prioritizing network traffic. If QoS policies are misconfigured or not aligned with the organization's priorities, it can result in improper allocation of bandwidth. Critical applications may not receive the necessary bandwidth, leading to congestion and performance issues.
- Inadequate Capacity Planning: Insufficient capacity planning can also contribute to high bandwidth usage. If the allocated bandwidth from ISP #2 is not appropriately sized to handle the actual network traffic demands, it can quickly reach its limit, causing congestion and degraded performance.
- Competing Traffic from Other Users: If multiple users or applications share the same network infrastructure provided by ISP #2, their traffic can compete for available bandwidth. If other users or applications consume a significant portion of the bandwidth, it leaves limited resources for the SD-WAN deployment, leading to increased congestion and performance degradation.
IV. How to Troubleshoot the SD-WAN Issue
Since the SD-WAN problem is happening on a local network device, your ISP can’t help you here.
- Bandwidth Assessment and Capacity Planning: Evaluate the actual bandwidth requirements of the SD-WAN deployment and ensure that the allocated bandwidth from ISP #2 is sufficient. If necessary, consider upgrading the bandwidth plan with the ISP to meet the increased demand.
- Traffic Prioritization and QoS Configuration: Implement proper traffic prioritization and QoS settings within the SD-WAN solution. Ensure that critical applications and traffic types receive appropriate bandwidth allocation and are prioritized over non-essential or bulk traffic.
- Load Balancing and Traffic Steering: Utilize SD-WAN's traffic steering capabilities to distribute the network traffic across multiple available transport links effectively. This helps in load balancing and optimizes bandwidth utilization.
- Network Monitoring and Optimization: Regularly monitor the network traffic and performance to identify areas of high bandwidth consumption and potential bottlenecks. Analyze the traffic patterns and optimize network configurations accordingly to ensure efficient use of available bandwidth.
You can then use Obkio’s Live View to see the effect of the changes you made on ISP #2 in real-time.
SD-WAN Issue #3. Local Loop Issue
The third common SD-WAN issue involves an ISP Local Loop issue on the underlay network. This issue occurs when there are problems specific to the local loop connectivity provided by the Internet Service Provider (ISP).
The local loop, also known as the last mile, refers to the physical connection between an ISP's central office or point of presence and the customer's premises. It's the final segment of the network that delivers internet connectivity to homes, businesses, or other end-users. Several issues can arise with the ISP Local Loop that impact SD-WAN deployments:
Physical Line Problems: Physical damage to the copper, fiber-optic, or wireless connection used in the local loop can lead to connectivity issues. This includes issues like cable cuts, water damage, or signal interference.
Configuration Errors: Incorrect configuration settings at the ISP's end or the customer's premises can cause connectivity disruptions. This includes issues such as incorrect VLAN settings, IP address conflicts, or misconfigured routing protocols.
Capacity Limitations: In some cases, the local loop may not have sufficient network capacity to handle the required bandwidth for SD-WAN traffic. This can lead to congestion, packet loss, and degraded performance.
Service Outages: ISP-related service outages, maintenance activities, or infrastructure upgrades can result in downtime or intermittent connectivity issues for SD-WAN deployments relying on the local loop.

In the screenshot above, we can see an Obkio Dashboard for a Branch #2 with various performance graphs. The selected view shows performance over the last 8 hours.
Column 1 shows the UDP monitoring session performance from the Branch 2 Monitoring Agent towards the SD-WAN user experience Monitoring Agents.
- The first graph shows the Internet SD-WAN user experience
- The 2 bottom graphs show the experience of the Internet connections (ISP 1 & ISP 2)
ISP #1 doesn’t show any performance issues. The solid blue line tells us that the latency is stable, and the different shades of blue suggest there is low jitter. We don't see any yellow or red bars, which means that no packet loss is detected.
ISP #2 shows a clear performance issue.
Column 2 shows SNMP Polling (Device Monitoring) on the SD-WAN Edge Equipment and metrics for CPU Usage and Bandwidth Usage.
- Unlike in the previous example, there is no high bandwidth usage being shown.
- This is not a bandwidth issue related to a lack of resources from the SD-WAN Edge router.
In Column 3, we can see HTTP performance for Zoom and Microsoft Teams, which is the same as the Network Response Time of the load-balanced session (top left corner).
- When ISP #2 experiences performance issues, it also affects Zoom and Teams call quality.
- The issues on Zoom and Teams happen around the same time as they occur on ISP #2.
I. When Did the SD-WAN Issue Happen?
For more information, we’ll be using Obkio Vision, Obkio’s free Visual Traceroute tool that runs continuously to interpret Traceroute results to identify network problems in your WAN and over the Internet.
By looking at the traceroute below, the issue seems to be introduced right from the 1st hop, and we can see that only ISP #2 is affected.

II. What is the SD-WAN Issue?
The SD-WAN problem is happening on the Local Loop, between the ISP Edge and SD-WAN Edge Equipment.
In this case, the problem is related to your ISP, so they are responsible for solving the problem.
Obkio’s Visual Traceroutes are able to identify problems anywhere in your network (ISP and AWS, ISP and Peering etc.), detect that they are a performance issue, and validate that the issue is not on your end.

How do Local Loop Issues actually affect SD-WAN performance?:
- Local Loop Connectivity: The local loop refers to the physical connection between the customer's premises and the ISP's network infrastructure. It typically involves copper, fiber, or coaxial cables and is responsible for carrying data between the customer's site and the ISP's network. An issue in the local loop can lead to disruptions or degradation of the underlay network connectivity.
- Physical Infrastructure Problems: Issues with the physical infrastructure of the local loop, such as damaged cables, faulty connectors, or degraded signal quality, can result in connectivity problems. These physical issues may be caused by environmental factors, wear and tear, or accidental damage, leading to intermittent or complete loss of connectivity. This could be something like a network brownout or Internet brownout.
- Line Quality and Stability: The quality and stability of the local loop connection can impact the performance and reliability of the underlay network. Issues such as excessive line noise, signal interference, or poor line stability can lead to packet loss, latency, or frequent disconnects. This can adversely affect the performance of the SD-WAN solution and the applications that rely on it.
- Service Provider Maintenance or Outages: ISPs occasionally perform maintenance activities or experience network outages in their infrastructure. These planned or unplanned events can result in temporary service disruptions, network disconnections, or degraded connectivity in the local loop, affecting the underlay network of the SD-WAN deployment.
- Service Level Agreement (SLA) Violations: Internet SLAs between the organization and the ISP typically define the expected performance and reliability of the local loop connection. If the ISP fails to meet the agreed-upon service levels, such as uptime or latency requirements, it can cause issues in the underlay network and impact the overall performance of the SD-WAN solution.
III. What Caused the SD-WAN Issue?
Several possible causes can lead to an ISP Local Loop issue on the underlay network in an SD-WAN deployment. These causes can include:
- Physical Damage: Physical damage to the local loop infrastructure, such as cables, connectors, or distribution points, can occur due to factors like construction work, accidental digging, vandalism, or natural disasters. These physical damages can disrupt the connectivity and cause issues in the underlay network.
- Signal Interference: Interference from external sources, such as electromagnetic radiation or neighboring electrical cables, can introduce noise or disrupt the signal quality in the local loop. This interference can result in degraded connectivity and performance issues.
- Line Degradation: Over time, the quality of the local loop connection may deteriorate due to wear and tear, aging infrastructure, or inadequate maintenance. Corrosion, cable degradation, or improper installation can contribute to line degradation, leading to signal loss, intermittent connectivity, or reduced bandwidth capacity.
- Network Congestion: ISP networks can experience congestion due to heavy traffic or oversubscription in certain areas. When the local loop is congested, it can result in packet loss, increased latency, and reduced overall network performance.
- Service Provider Maintenance: ISPs periodically perform maintenance activities on their network infrastructure, including the local loop. During maintenance windows, the connectivity may be temporarily interrupted or degraded, affecting the underlay network of the SD-WAN deployment.
- Equipment Failure: Hardware or equipment failures within the ISP's network infrastructure, such as network switches, routers, or line cards, can cause disruptions in the local loop connectivity. These failures can result from component malfunctions, power outages, software glitches, or firmware issues.
- External Factors: External factors, such as severe weather conditions, natural disasters, or accidents, can damage the local loop infrastructure and disrupt the underlay network. For example, strong winds, flooding, or earthquakes can cause physical damage or power outages that affect the connectivity.
- Service Level Agreement (SLA) Violations: In some cases, the ISP may fail to meet the agreed-upon service levels defined in the SLA. This could be related to uptime, latency, or other performance metrics. SLA violations can result in poor service quality, interruptions, or inconsistent connectivity in the underlay network.
IV. How to Troubleshoot the SD-WAN Issue
Firstly, you want to make sure that you’re not using ISP #2 while you’re waiting for the issue to be resolved.
Secondly, you need to contact your ISP using the information you’ve acquired from Obkio’s app.
- Open a support ticket with your ISP using the screenshots of Monitoring Sessions, Dashboards or Traceroutes in Vision.
- Use Live Monitoring mode for real-time updates and share results of Live Traceroutes with your ISP using a public link.
- If your ISP wants to analyze your data further, you can create a temporary Read-Only User in your Obkio account for them.
Why Do SD-WAN Issues Happen?
So if SD-WAN networks promise such high levels of performance, why do they experience performance issues at all?
SD-WAN issues can be attributed to a variety of factors in your SD-WAN networks Understanding the reasons behind these issues will help organizations take proactive measures to mitigate them, ensuring a smooth and efficient operation of their SD-WAN networks. Let's get into it:
- Complexity: SD-WAN deployments can be complex, involving multiple components, vendors, and configurations. The complexity of the solution itself can lead to misconfigurations, interoperability issues, or difficulties in managing and troubleshooting the network.
- Inadequate planning and design: Insufficient planning and design can result in SD-WAN deployments that are not tailored to the organization's specific requirements. This can lead to suboptimal performance, security vulnerabilities, or compatibility problems with existing network infrastructure.
- Bandwidth limitations: SD-WAN relies on the underlying network infrastructure to transport data between locations. If the available bandwidth is limited or congested, it can affect the overall performance of the SD-WAN solution, leading to latency, packet loss, or reduced application performance.
- Transport technology challenges: SD-WAN solutions often incorporate multiple transport technologies, such as MPLS, broadband, or LTE, to route network traffic. Ensuring consistent Quality of Service (QoS) across different transport types can be challenging, as each technology has its own characteristics and limitations.
- Security vulnerabilities: SD-WAN introduces new security considerations, such as encryption, authentication, and segmentation. If security measures are not properly implemented, configured, or maintained, SD-WAN deployments can become vulnerable to security breaches or unauthorized access.
- Lack of visibility and monitoring: Traditional network monitoring and troubleshooting methods may not provide adequate visibility into the dynamic nature of SD-WAN networks. Limited visibility can make it challenging to identify and resolve performance issues, outages, or security threats effectively.
- Integration and compatibility issues: SD-WAN solutions often need to integrate with existing network infrastructure, such as firewalls, routers, and switches. Incompatibilities between different vendors or legacy systems can lead to configuration problems, limited functionality, or difficulty in achieving seamless interoperability.
- Lack of expertise and training: SD-WAN is a relatively new technology, and organizations may lack the necessary expertise or training to effectively implement and manage it. Inadequate understanding of SD-WAN principles, best practices, and configuration can result in network issues or inefficient use of the technology.
Understanding these underlying causes of SD-WAN network issues can help organizations proactively address them during the planning, implementation, and ongoing management stages. Working with experienced professionals or service providers and investing in training and knowledge transfer can mitigate these challenges and optimize the performance of SD-WAN networks.
How to Troubleshoot SD-WAN Issues
Once you’ve identified any SD-WAN issues in your network, Obkio’s network monitoring solution will also allow you to collect the data you need to troubleshoot these network problems.
We talk about Obkio’s SD-WAN troubleshooting steps in our article on SD-WAN Troubleshooting, but here is a summary of the steps.
Step 1. Pinpoint SD-WAN Issues
- Analyze live data or network monitoring alerts received from your monitoring solution to look at what network locations are currently experiencing poor performance
- Isolate the issue and focus on the location with the worst performance
Step 2. What the SD-WAN Issue Is & When It Happened
- Look at past historical data
- Isolate when the issue first happened and its pattern
Step 3. Compare the Information & Find A Root Cause to the SD-WAN Issue
- Once you know what happened, look at your historical traceroutes to pinpoint where the issue happened
- Identify if the issue is internal or external (in the ISP network)
Step 4. Implement A Solution to Solve the SD-WAN Issue
- If the issue is on your ISP’s side, open a support ticket with information from Obkio
- If the problem is internal, resolve internally

Learn how to troubleshoot SD-WAN issues using Obkio Network Monitoring software and key SD-WAN troubleshooting steps.
Learn moreDon't Let SD-WAN Issues Hinder Your Network Performance!
Now you’ve just seen some of the most common SD-WAN issues that your network can experience, so you're ready to fight them off!
Remember that SD-WAN issues are inevitable. It’s not about if they happen, it’s about when, how, and where they happen.

To be able to identify and troubleshoot any SD-WAN issues, whether they happen in your network or your ISP’s network, continuously monitor your SD-WAN network using Obkio’s SD-WAN Monitoring tool.
- Monitor your SD-WAN migration
- Continuously monitor SD-WAN performance
- Proactively identify SD-WAN issues anywhere in your network
- Collect the information you need to troubleshoot internally or externally

