


Table of Contents
Table of Contents
SD-WAN networks are more popular than ever. With the increasing use of cloud-based applications, many businesses rely on SD-WAN services to deliver optimal Internet, cloud, and UC performance. But like all networks, SD-WAN can experience network issues that affect user experience and network performance. So keep reading to learn how to troubleshoot SD-WAN networks using Network Monitoring.
This article is part of a series of articles about monitoring and troubleshooting SD-WAN networks before, during, and after migrations. The articles include:
- How to Monitor SD-WAN Migrations
- How to Monitor MPLS to SD-WAN Migrations
- How to Monitor SD-WAN Networks
- SD-WAN Troubleshooting (this article)
- Common SD-WAN Issues
Where SD-WAN Issues Can Happen 
Before getting into troubleshooting SD-WAN, we need to first understand what an SD-WAN network looks like and where SD-WAN problems can happen in a network.

In the image below, we can see a diagram of an SD-WAN network site communicating with either a Data Center, Head Office or IaaS.
Traditional monitoring solutions (availability monitoring, infrastructure monitoring) typically focus on LAN network devices, but don't provide end-to-end performance visibility.
What you need to identify and troubleshoot SD-WAN issues is visibility of the ISP network and the Internet - which SD-WAN networks depend on to ensure good performance.
In an SD-WAN Architecture, SD-WAN issues can come from many different places:
A. The Underlay
- The Internet
- Internet Local Loop
- Internet Provider’s Edge Router
- ISP Backbone
- ISP Peering Point
B. The Overlay
- IPsec Tunnel from one site to another
C. The LAN
- SD-WAN Edge
- Core & Distribution Switches
- Access Switches
What SD-WAN Issues Can Happen
You need end-to-end SD-WAN visibility to identify the most important issues - which are the SD-WAN issues that impact user experience.
Your users shouldn’t be your monitoring system. You should be able to identify issues before they reach end-users.
Some common SD-WAN issues include:
- Defective cables or connectors
- Bandwidth congestion (bottleneck)
- Device misconfigurations
- Device software issues
- High CPU usage
- Physical/ hardware issues
- Human errors
- DNS issues

Many people rely on SD-WAN networks, but they’re still prone to network issues. Learn about the 3 most common SD-WAN issues and how to solve them.
Learn moreMonitor SD-WAN Performance
To be able to identify and troubleshoot SD-WAN issues, you first need to monitor your network to identify performance issues.
The native monitoring features of SD-WAN networks don’t offer the depth needed for monitoring complex SD-WAN networks, and additionally, don’t truly monitor SD-WAN network performance from the user perspective - which is extremely important to understand if your SD-WAN service is performing as promised.
That’s why we recommend a modern tool like Obkio Network Performance Monitoring software. continuously monitors end-to-end network performance with synthetic traffic using Network Monitoring Agents.


A. SD-WAN Network Design
Obkio’s Network Monitoring Agents are a unique software deployed in key network locations to monitor your SD-WAN network locations and Internet performance, measure network metrics (latency, jitter, packet loss), and alert you about SD-WAN issues in your network.
They create Monitoring Sessions and use synthetic UDP traffic to monitor network performance, in a decentralized way, from the source (your computer or your office) up to the destination (another office, datacenter or clouds).
Here’s what the set-up looks like:

B. Deploy Monitoring Agents
To monitor your SD-WAN network, install Network Monitoring Agents in the customer LAN, behind the SD-WAN appliance, to measure SD-WAN network performance like an end-user.
You need:
- 1 Local Agent per network location (data centers, remote offices etc.)
- 3 Public Monitoring Agents to monitor the Internet
Here is what an SD-WAN monitoring set-up can look like on Obkio's Chord Diagram:
 Obkio's Chord Diagram with 8 Branches and 2 ISPs
SD-WAN Troubleshooting Steps
Now that you’ve completed your set up to monitor your SD-WAN performance, we can get started with identifying and troubleshooting SD-WAN issues.
Step 1. Pinpoint SD-WAN Issues
To begin the SD-WAN troubleshooting process, you need to identify SD-WAN issues by looking at what’s going on right now in your network.
Maybe users are complaining about slow application performance or network disconnection, and you need to know where to start. Well, you start with Obkio’s automatic network monitoring alerts and Chord Diagram.
A. Analyze the Chord Diagram
Obkio’s Chord Diagram is there to show you exactly what is happening in your network right now.
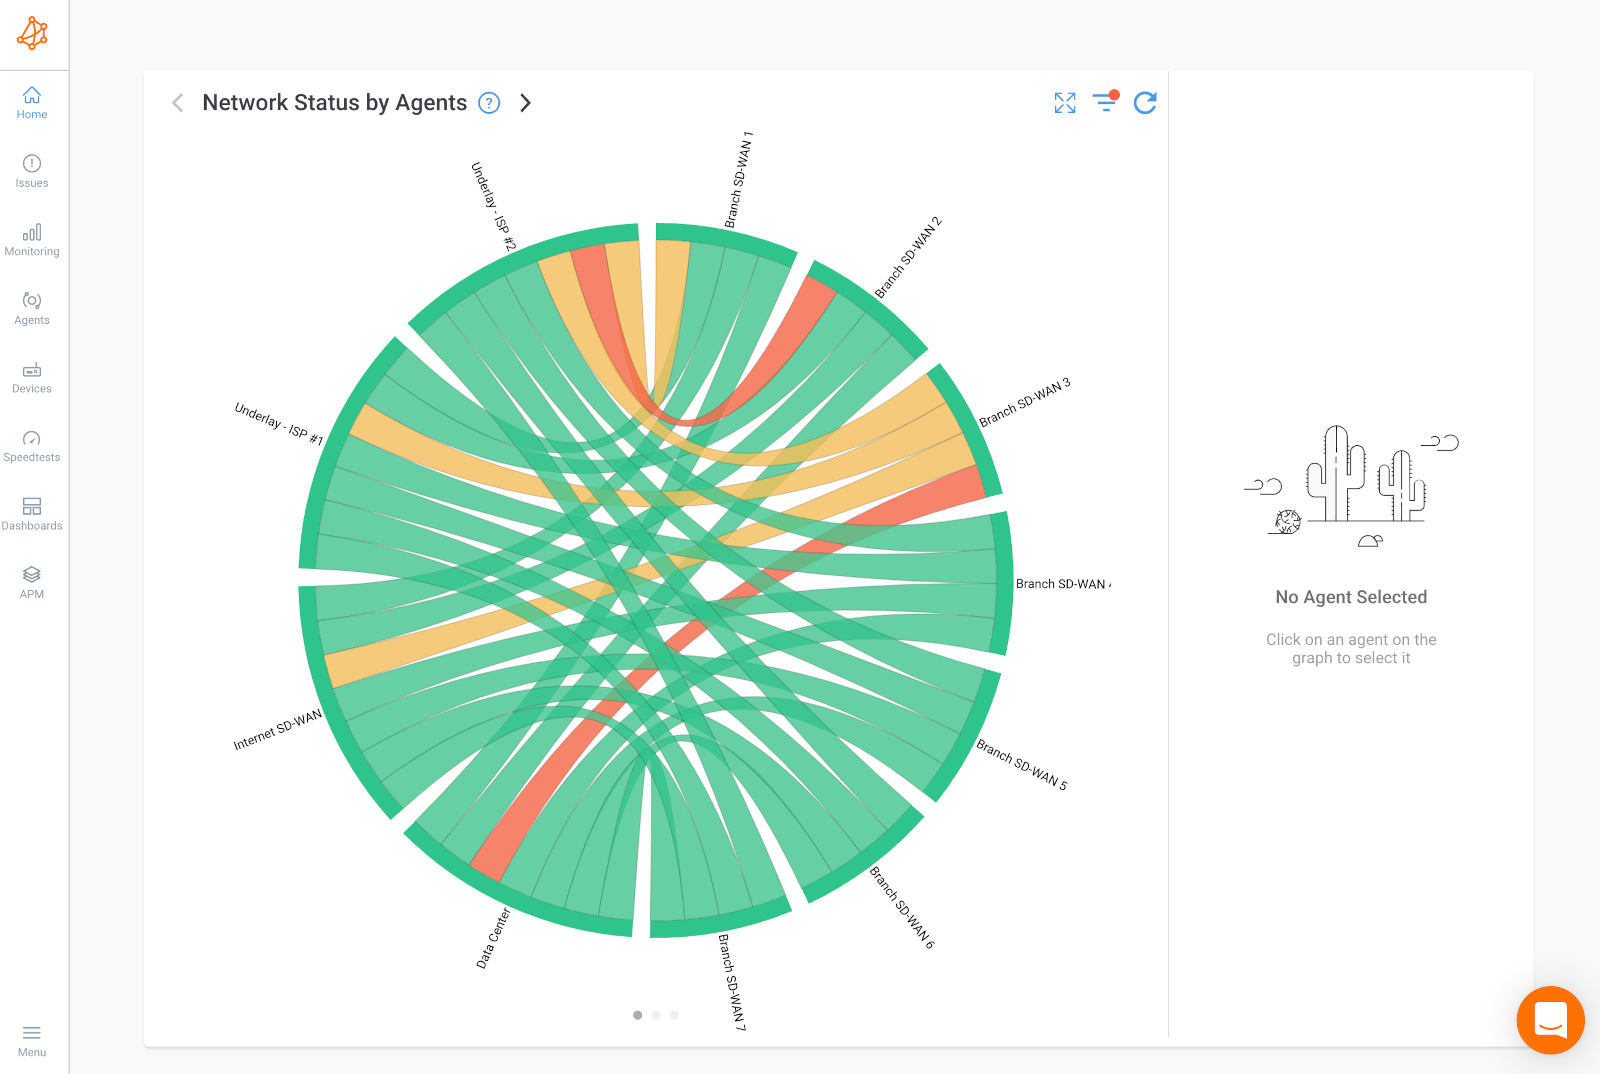
If you look a the screenshot above, you can see:
The names of all the Monitoring Agents: All the Local Agents & Public Monitoring Agents you’ve deployed in your network.
The performance between the Monitoring Agents: Represented by the lines and network sessions.
The severity levels: Which correspond to the severity level of the performance issues, red being the most severe.
B. Isolate the Issue
When identifying SD-WAN issues, you always want to troubleshoot the most severe issues (the red sessions), in the most impacted network locations.
For example: In the screenshot below, we’ve isolated Branch 3 as the worst because all of its sessions are being affected by performance issues.

Step 2. What the Problem Is & When It Happened
At this point, you should switch to the Dashboard View created to view all key network metrics towards that branch on a single page.
With the dashboard, you can compare all the information from the Monitoring Agents to come to the right conclusion about what the exact problem is, when it started, and what the pattern is.
In the screenshot below, you can see the Dashboard for Branch 3 with various performance graphs. You can also change the selected time-frame of the graphs. The selected view shows performance over the last 8 hours.

A. Analyze the Dashboard
Column 1 shows the UDP monitoring session performance from the Branch 3 Monitoring Agent towards the SD-WAN user experience Monitoring Agents.
- The first graph shows the Internet SD-WAN user experience
- The 2 bottom graph under show the experience of the Internet connections (ISP 1 & ISP 2)
Column 2 shows SNMP Polling (Device Monitoring) on the SD-WAN Edge Equipment. Obkio will perform SNMP Polling on the Monitoring Agent and, in the graphs under, show metrics for:
- CPU Usage
- Bandwidth Usage
Column 2 shows SNMP Polling (Device Monitoring) on the SD-WAN Edge Equipment. Obkio will perform SNMP Polling on the Monitoring Agent and, in the graphs under, show metrics for:
- CPU Usage
- Bandwidth Usage
Column 3 shows Zoom performance and Microsoft Teams performance, which Obkio also provides. It shows:
- HTTP Application Performance
- VoIP Quality
B. Identify the Exact Problem
After reviewing all this information, we can see that:
- There is poor performance affecting all the traffic
- Both ISP 1 and ISP 2 are being affected
How can this happen? Well, for ISP 1 & 2 to be affected, this means that the network problem is happening on a network segment that is common to both ISPs.
Perhaps in the LAN, or directly on the SD-WAN Edge Router.
This is due to high CPU usage which leads to high packet loss. This is a very common issue which means that the device does not have enough available resources to manage the throughput.
C. When Did the Problem Happen
Analyze the historical data on the dashboard to find a trigger, a pattern or a deviation from your baseline to identify:
- When the problem first happened
- Is the problem continuous or intermittent?
- Is the problem flapping?
In the example above, we do have a pattern. The issue is an intermittent network problem (happens on and off) and doesn’t follow a specific pattern but the high CPU usage is very clear.
Step 3. Compare the Information & Find A Root Cause
Next, you need to compare the information you received with Obkio’s Visual Traceroute tool to find a root.
To do this, we’ll be using Obkio Vision, Obkio’s free Visual Traceroute tool that runs continuously to interpret Traceroute results to identify network problems in your WAN and over the Internet.
 Obkio Vision Quality Matrix
Note: If the network problem is happening on your end, you don’t need to do this step. It’ll just further confirm that conclusion.
By using Traceroutes, the Network Map, and the Quality Matrix you’ll be able to identify if:
A. The problem is happening specifically towards a specific location over the Internet. So only one specific site is being affected.
 Obkio Vision Network Map
B. The problem is on your ISP’s side and you need to open a service ticket with as much information as you can collect.
 Obkio Vision Traceroutes
Step 4. Implement A Solution
Now you know what the problem is, where and when it happened, and who is responsible for solving it, you need to do something.
A. If the problem is on your ISP’s side
Contact your ISP to get technical support using the screenshots of Monitoring Sessions, Dashboards or Traceroutes in Vision.
Use Live Monitoring mode for real-time updates and share results of Live Traceroutes with your ISP using a public link.
If your ISP wants to analyze your data further, you can create a temporary Read-Only User in your Obkio account for them.

Learn how to use Obkio Vision’s Visual Traceroute tool to troubleshoot network problems with traceroutes in your LAN, WAN, and everything in between.
Learn moreB. If the problem is on your end
If you find CPU or Bandwidth issues, this likely means that the problem is on your end and you need to do something. Here are a few suggestions:
Look into what traffic is being used. Understand if the traffic is legitimate or not by looking at the firewall logs. Illegitimate traffic might be a security breach (data exfiltration), or mass data backup happening during business hours instead of during the night.
Manage priorities in your Firewall to prioritize certain traffic in order to reduce the impact on affected applications during periods of congestion.
Upgrade your Internet connection bandwidth with your ISP if you’re just running out of bandwidth.
Look into your device to understand why it’s missing resources and causing high CPU usage. There may be a software problem, your device may need a firmware update, the last update may be bugged, or the device may just not have enough resources available and needs to be upgraded to a bigger device.
Expand the SD-WAN Troubleshooting Setup
Once you’ve collected the data you need to troubleshoot your SD-WAN network, you can really understand if your SD-WAN service is performing as promised.
But remember, performance issues can always come back.
That’s why it’s important to keep monitoring and troubleshooting SD-WAN performance so you can proactively solve SD-WAN issues before they affect user experience. Not after.
Install Monitoring Agents in all your network locations, and keep Obkio as your permanent SD-WAN monitoring tool!

