Table of Contents
Table of Contents
Are you ready to fight for your network's performance and reliability?
Transitioning to SD-WAN technology can be challenging without proper network visibility. It's time to take the blindfold off and gain control over your network with SD-WAN monitoring. Don't let a lack of visibility hold you back from reaching your goals.
With SD-WAN monitoring, you can track your network's progress, identify areas for improvement, and ensure it meets your expectations.
Keep reading to learn how SD-WAN monitoring can help your business thrive in the digital age. Get ready to conquer your network challenges like a true fighter!
Are you ready to take on the challenge of SD-WAN technology? It's time to step up to the plate and show your network who's boss.
With tools for Fortinet SD-WAN monitoring, you can gain full visibility into your network's performance, just like tracking your progress during a workout. You can optimize your network's capabilities and troubleshoot any issues that arise, ensuring maximum efficiency and uptime.
So, are you ready to take your network to the next level? It's time to lace up your sneakers and get to work to start monitoring your Fortinet SD-WAN.
Here are some things that an SD-WAN monitoring tool can do:
- Monitor end-to-end network performance: SD-WAN monitoring tools can provide real-time visibility into the performance of the entire SD-WAN network, from end to end.
- Identify performance issues: These tools can identify and alert you to any performance issues that may be impacting your network, such as high bandwidth usage, high CPU usage, or issues with the Internet connection local loop.
- Troubleshoot network problems: SD-WAN monitoring tools can help you troubleshoot network problems by providing detailed information about the source of the issue, where it is occurring in the network, and who is responsible for resolving it.
- Monitor user experience: These tools can monitor user experience by tracking metrics such as latency, packet loss, and jitter, ensuring that your users have the best possible experience with your SD-WAN network.
- Provide analytics and reporting: SD-WAN monitoring tools can provide detailed analytics and reporting on network performance, allowing you to identify trends and make data-driven decisions about how to optimize your network.
- Facilitate vendor management: These tools can help you manage your SD-WAN vendors by monitoring their performance and ensuring that they are meeting the promises they made about their service.
- Improve network security: SD-WAN monitoring tools can help you identify and address security issues in your network, such as DNS attacks or other forms of cyber threats.
Keep reading to learn more about how monitoring your Fortinet SD-WAN network can help your business thrive in the digital age.
Ready to take your network monitoring to the next level? Try Obkio's SD-WAN monitoring solution today and gain valuable insights into the performance of your network.

Don't let network challenges hold you back - sign up for Obkio's SD-WAN monitoring solution now.
- 14-day free trial of all premium features
- Deploy in just 10 minutes
- Monitor performance in all key network locations
- Measure real-time network metrics
- Identify and troubleshoot live network problems

Migrating to Fortinet SD-WAN technology promises improved network performance and reliability. However, many businesses still struggle with network visibility and performance issues.
In the world of SD-WAN technology, many businesses lack visibility over their networks. But just like in a fight, you can’t win if you can’t see your opponent.
SD-WAN monitoring is critical to ensure that you can identify any issues that arise and take the necessary steps to resolve them. With SD-WAN monitoring, you can:
- Ensure the success of your SD-WAN migration: Implement SD-WAN monitoring before your migration to identify problems that may hinder the migration before and after.
- See what Service Providers can’t: Catch performance issues yourself that vendors and Service Providers can’t see.
- Measure the SD-WAN promise: Monitor your SD-WAN network to ensure that your vendor upholds the promises they made for your SD-WAN performance.
- Identify all SD-WAN performance issues: Proactively identify and resolve high bandwidth and CPU usage issues that can impact user experience.
- Go further than SD-WAN native monitoring features: Get 360-degree visibility and monitor from the user's point-of-view to determine whether the SD-WAN service is delivering on its promised performance.
- Facilitate SD-WAN troubleshooting: Use the right tools to troubleshoot issues with MPLS or Internet Connections, SD-WAN Edge devices, IPSec Tunnels, and Firewall as a Service (FWaaS).
- Decrease the ping-pong with Service Providers: Have the right visibility to provide Service Providers with the necessary information to escalate your support case and resolve any issues.
After discussing the benefits of SD-WAN network monitoring, it's time to address some of the common issues that businesses may face with their Fortinet SD-WAN networks.
Similar to how even the fittest fighters face challenges, Fortinet SD-WAN networks are not immune to issues that can impact user experience. In the next section, we'll explore these issues and how SD-WAN monitoring can help mitigate them to keep your network in peak performance!

Keeping your Fortinet SD-WAN network healthy requires proactive monitoring to identify and troubleshoot common SD-WAN issues that may arise.
Here are some common challenges that may affect your Fortinet SD-WAN network:
- High CPU Usage: When your Fortinet SD-WAN network's CPU Usage is exceeded, it's like running a marathon without proper training. Network performance can suffer, causing issues such as latency, packet loss, and poor user experience that can impact critical business applications.
- High Bandwidth Usage: Similar to how an overworked muscle can become fatigued, high Bandwidth usage can impact all network sessions and cause slower performance. This issue typically happens when a device lacks the resources to handle the throughput.
- Local Loop Issues: Just like how muscle strain can be challenging to diagnose and resolve, local loop issues such as cabling problems or faulty equipment can result in intermittent connectivity, slow data transfer rates, or even complete network outages.
- DNS Issues: Incorrect or outdated DNS records can lead to slow or intermittent connectivity, like feeling sluggish during your workout. DNS attacks like DNS spoofing or cache poisoning can also create significant security issues on your Fortinet SD-WAN network.
- Defective Cables or Connectors: Similar to how a broken piece of equipment can impede your workout progress, defective cables or connectors can cause a range of issues on your Fortinet SD-WAN network, from intermittent connectivity to complete network outages.
By utilizing tools to monitor Fortinet SD-WAN Network and addressing these common issues proactively, you can ensure optimal network performance and reliability, just like sticking to your fitness routine.
Don't wait for issues to occur, be prepared to tackle them head-on to monitor your Fortinet SD-WAN network and keep your network in tip-top shape!
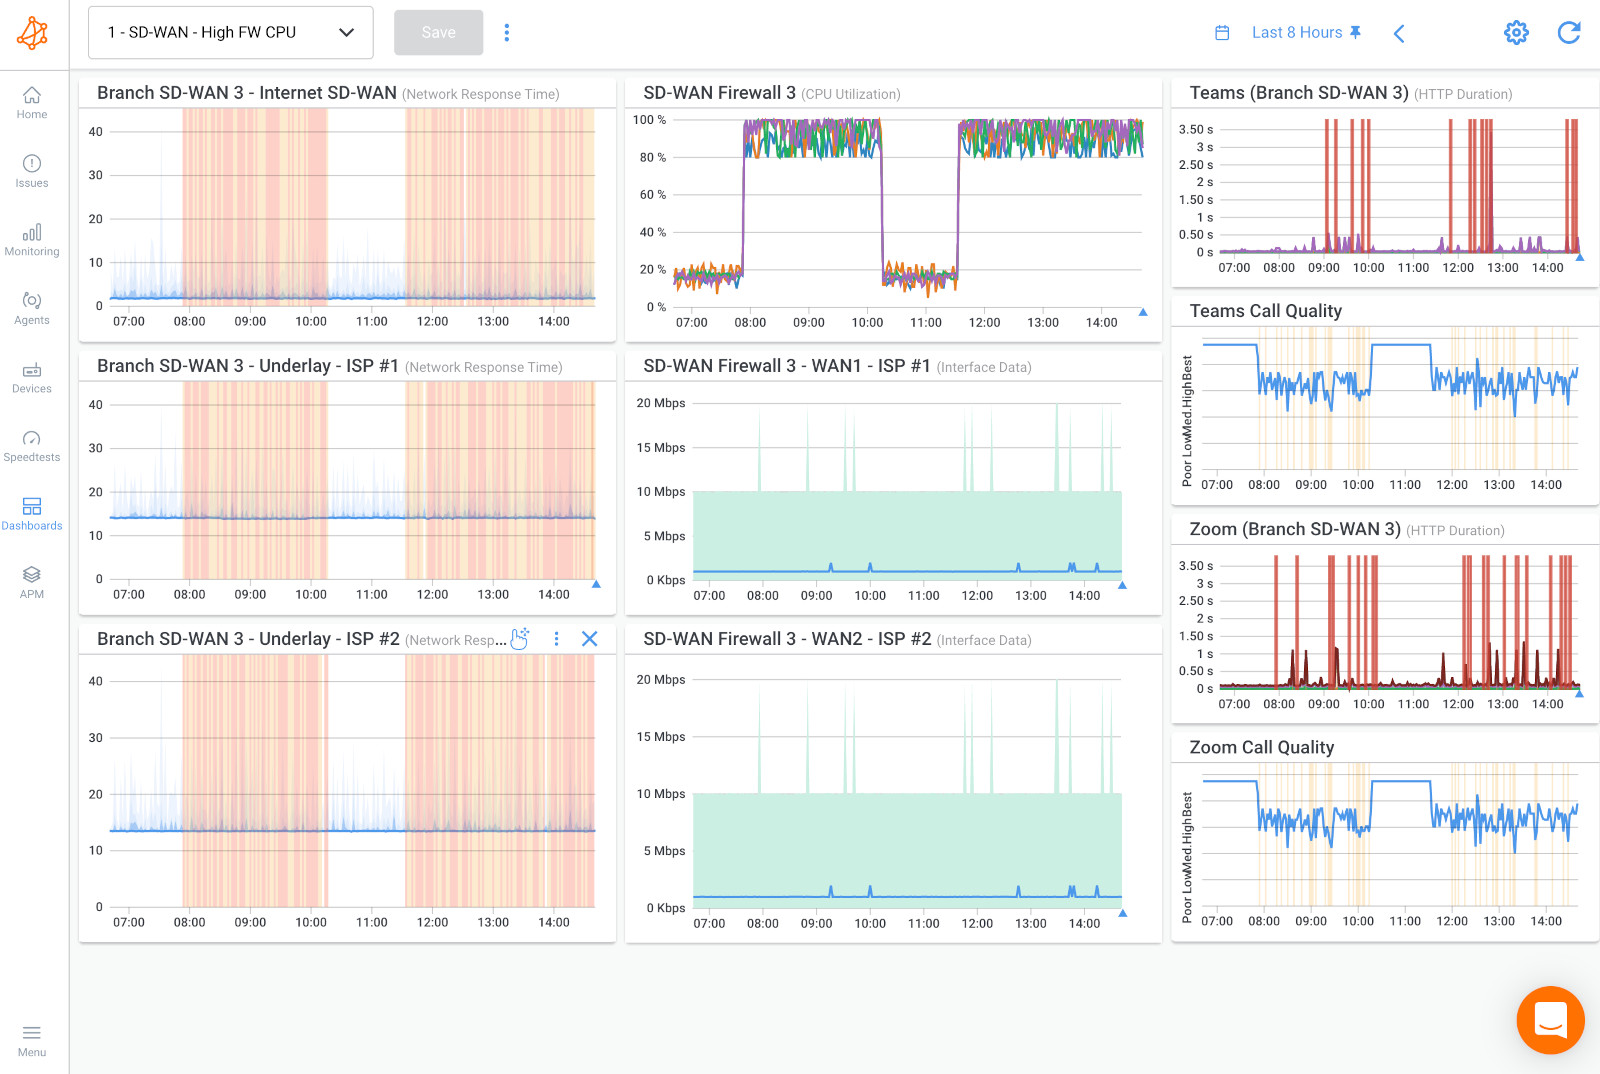 Obkio dashboard showing high CPU usage on SD-WAN Devices affecting all sessions
Great! You now understand the importance of SD-WAN Network monitoring and the performance issues you need to avoid during migration. But how do you actually implement a tool to monitor Fortinet SD-WAN Network? Don't worry, we've got you covered.
In the following section, we'll walk you through the steps of implementing Obkio to monitor your Fortinet SD-WAN and ensure maximum network performance and reliability. From selecting the right monitoring tools to setting up policies and alerts, we'll cover everything you need to know to get started with SD-WAN monitoring.
So, get ready to take control of your network's performance and achieve maximum efficiency and uptime with Fortinet SD-WAN monitoring!
Step 1. Traditional Monitoring Won't Cut It: Why Your Business Needs End-to-End SD-WAN Performance Monitoring
If you're relying solely on traditional monitoring solutions that focus on your devices, or even SD-WAN native monitoring features, you're missing out on crucial insights into your network's performance.
To truly optimize your Fortinet SD-WAN network, you need a solution that provides end-to-end performance monitoring capabilities.
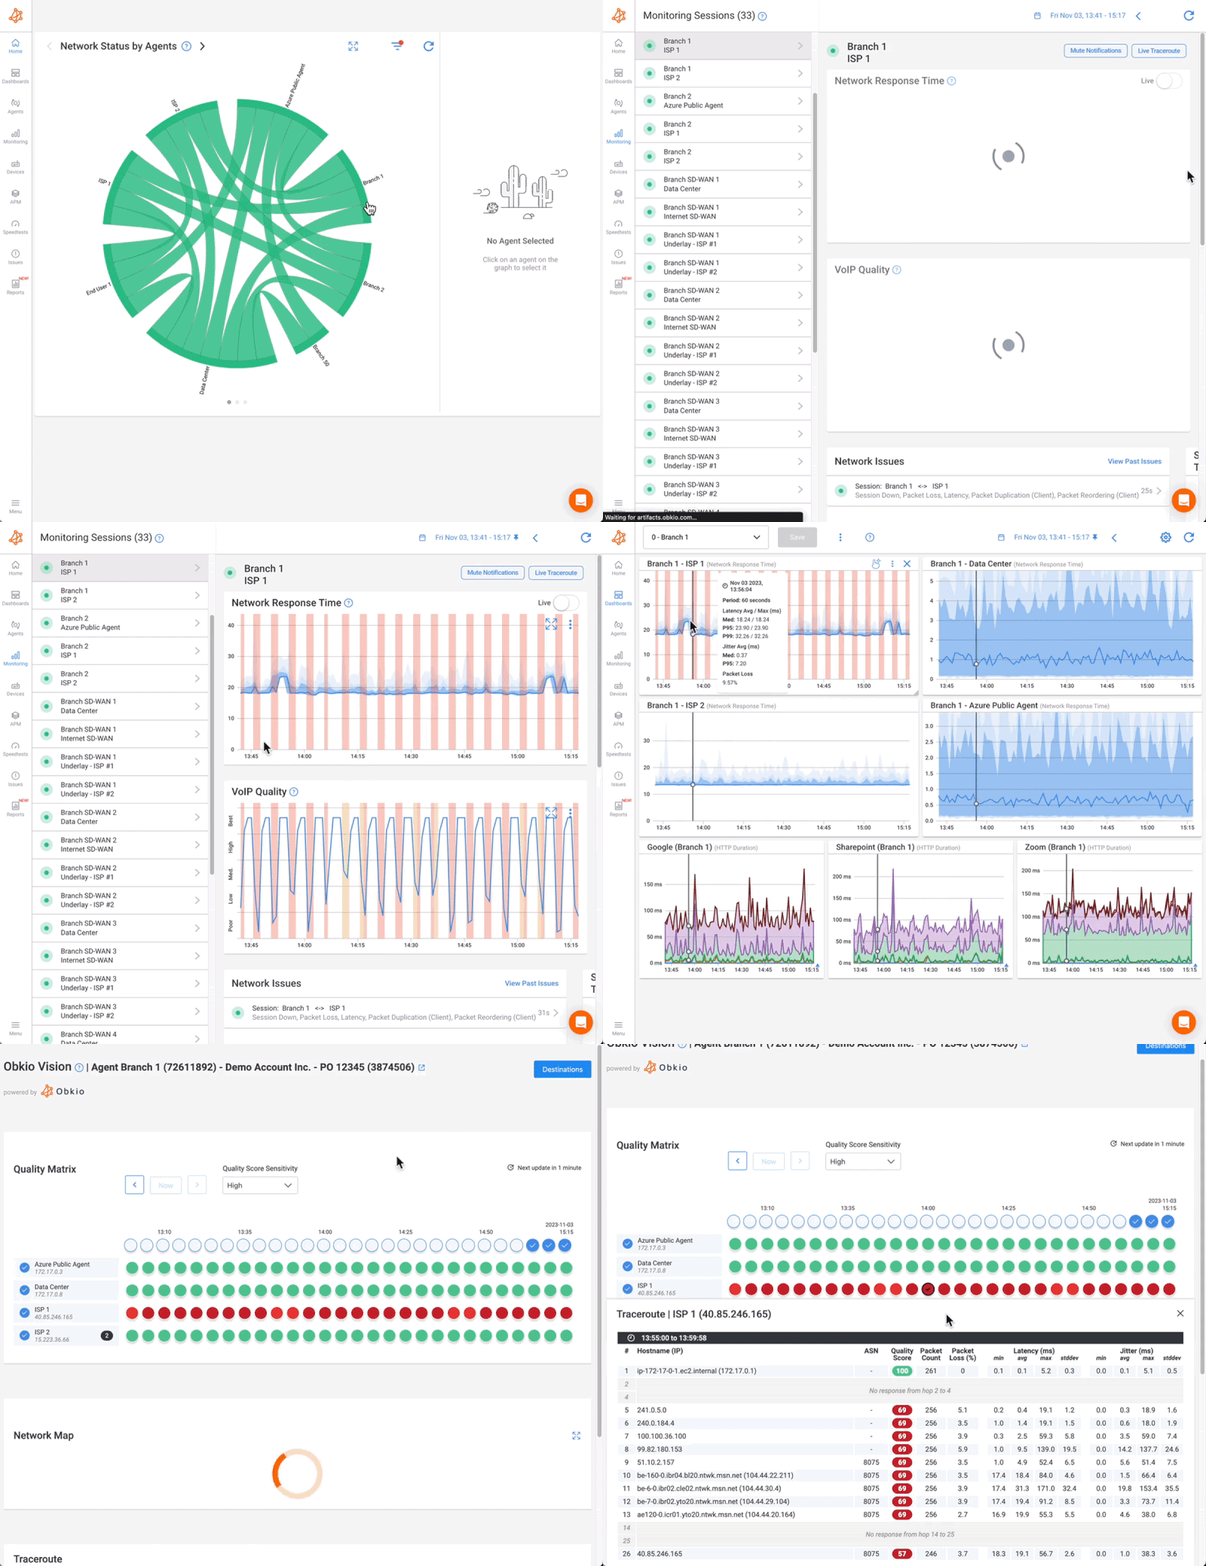
That's where agent-based solutions like Obkio Network Performance Monitoring software come in. With dedicated SD-WAN monitoring capabilities, you can gain a deep understanding of your network's performance, including:
- Whether your Fortinet SD-WAN service is performing as promised
- If there are any problems affecting your Fortinet SD-WAN network and what those issues are
- Where those problems occurred (in your local network or with your Service Provider)
- Who is responsible for troubleshooting the issue and fixing
Ready to take control of your SD-WAN network's performance?

Step 2. Why Deploying a Monitoring Solution Before A Fortinet SD-WAN Migration is Crucial for Network Performance
Deploying a monitoring solution before migrating to Fortinet SD-WAN is critical for comparing network performance before and after the migration. This allows you to track any changes in performance and identify any issues that may arise during or after the migration process.
At Obkio, we monitor network performance using synthetic UDP traffic from Monitoring Agents deployed in key network locations.
To monitor a Fortinet SD-WAN migration, we recommend deploying Monitoring Agents in your local network and between network locations, such as remote offices and your company's headquarters, data centers, or clouds.
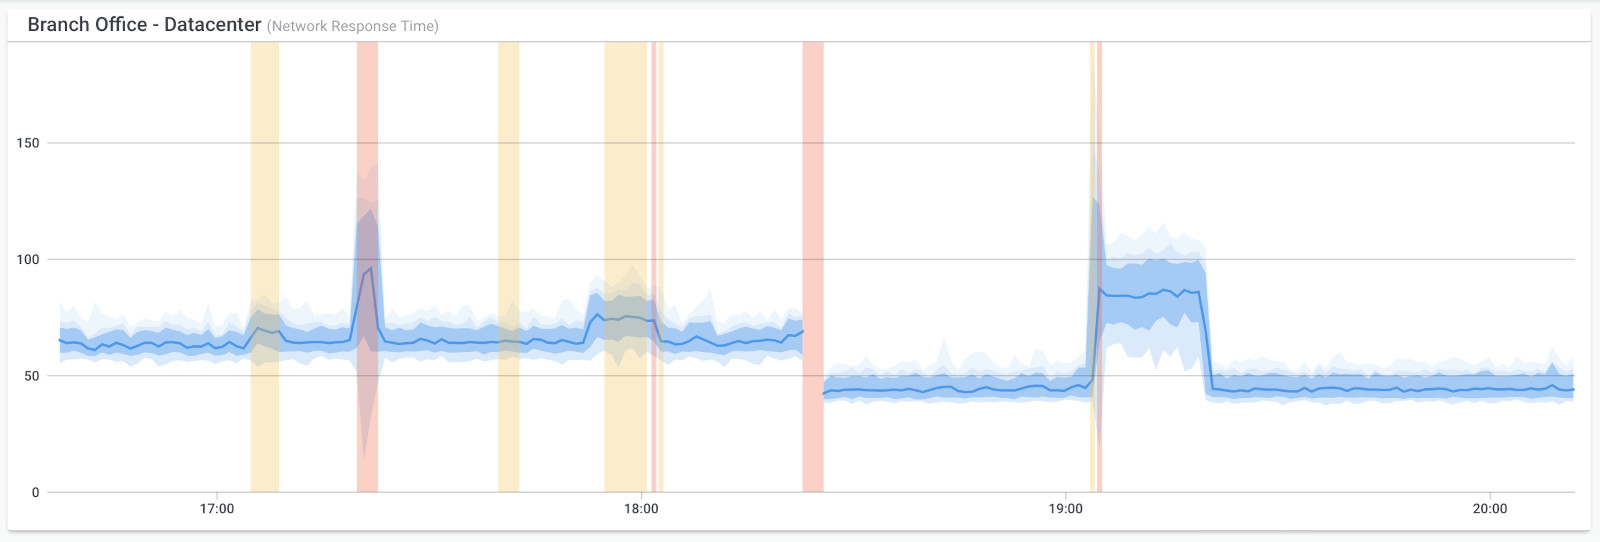
In the example above, a branch office migrated from a dedicated low-bandwidth MPLS connection to an SD-WAN service with two broadband connections. The migration occurred in the middle of the graph (around 18:20).
A few minutes later, around 19:00, the SD-WAN service switched from the primary ISP to the secondary ISP due to high packet loss for about 15 minutes. The graph shows just a little bit of packet loss during the failover because it took a few seconds for the SD-WAN appliance to failover.
Don't leave your Fortinet SD-WAN migration to chance. Deploy a monitoring solution before your migration to ensure maximum network performance and reliability. Contact Obkio today to learn more about our solutions and how we can help you optimize your Fortinet SD-WAN network.
After migrating to your new Fortinet SD-WAN service, network testing is crucial to ensure optimal network performance. But to set up SD-WAN monitoring, you need to understand the design of your network to adapt it to your monitoring setup.
Your SD-WAN network architecture consists of various components that can cause performance issues, including the Underlay, Overlay, LAN and Last mile.
Additionally, Firewall as a Service (FWaaS) can create additional communication paths that may require opening support tickets with your Service Provider.
It's essential to have a comprehensive understanding of your Fortinet SD-WAN network's anatomy to identify potential performance issues and deploy an effective monitoring solution that covers all network components.
The image below displays a Fortinet SD-WAN network site communicating with a Data Center, Head Office, or IaaS.
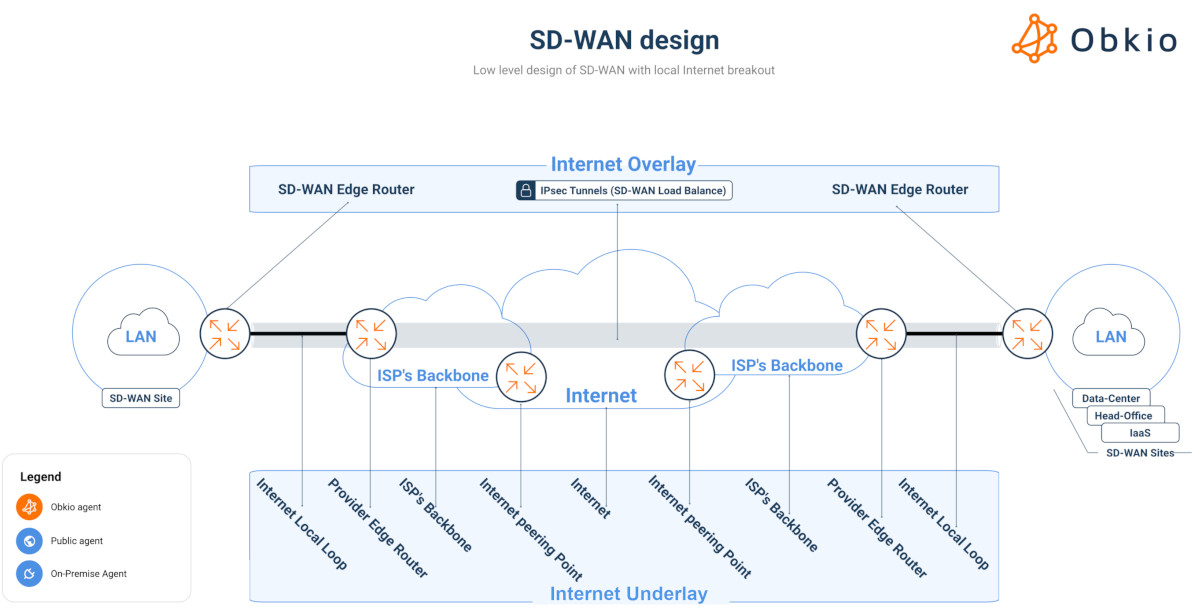
In an SD-WAN Architecture, SD-WAN issues can come from many different places:
The Underlay
- The Internet
- Internet Local Loop
- Internet Provider’s Edge Router
- ISP Backbone
- ISP Peering Point
- Internet VPN IPSec between the site and ZScaler (Firewall As A Service)
The Overlay
- IPsec Tunnel from one site to another
- The LAN
- SD-WAN Edge
- Core & Distribution Switches
- Access Switches
The Last Mile
- 80% of companies using SD-WAN experience performance issues on the last mile of the network. The last mile generally has the lowest speeds, the least route diversity and the most single points of failure.
Firewall As A Service (FWaaS)
- If your business also has Firewall As A Service (FWaaS), you’ll need to open a support ticket with your Service Provider if the problem is located on their side.
To fully deploy your SD-WAN monitoring solution, it is essential to install Network Monitoring Agents in the customer LAN, behind the Fortinet SD-WAN appliance. This allows for end-user perspective monitoring, providing a comprehensive view of the network's performance.
By monitoring network performance from the end-user perspective, you can ensure that critical business applications are performing optimally and identify any issues that may affect user experience.
With Network Monitoring Agents in place, you can proactively identify and troubleshoot performance issues, improving overall network efficiency and uptime.
This is the setup we recommend:
- 1 Local Agent per network location (data centers, remote offices etc.)
- 3 Public Monitoring Agents to monitor the Internet
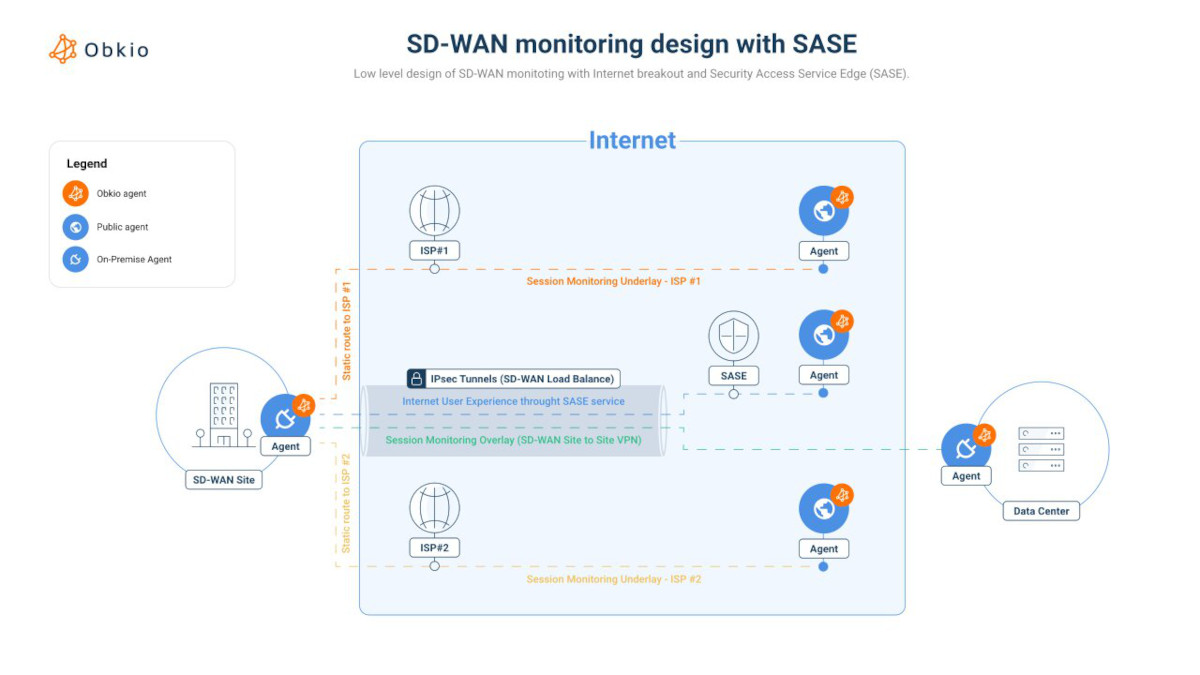
With this setup, you’ll also have visibility of:
- ISP #1 connection
- ISP #2 connection
- The End-User (load balanced between the connection using the SD-WAN algorithm)
- The SASE Service
Once the Monitoring Agents are deployed, they start creating Monitoring Sessions that use synthetic UDP traffic to monitor each network path. This allows the Agents to measure network metrics, such as latency, jitter, and packet loss, and identify any issues that may arise.
If the Agents detect any performance issues, they will raise network monitoring alerts to notify network administrators, who can then take action to address the problem.
With SD-WAN monitoring tools, businesses can proactively identify and resolve network issues before they become a major problem, ensuring maximum network uptime and efficiency.
In order to effectively monitor the performance of your SD-WAN network, it's important to track both end-user perspective and underlay connections. This will allow you to compare actual performance against the SLA or promises made by your SD-WAN vendors.
To achieve this, you can set up three monitoring sessions between a local Monitoring Agent behind the SD-WAN appliance and three remote Monitoring Agents located in the same area, such as a cloud, data center, or head office.
With this monitoring setup, businesses can gain valuable insights into the performance of their SD-WAN network. By configuring three monitoring sessions between a local Monitoring Agent behind the SD-WAN appliance and three remote Monitoring Agents located at the same location (such as a cloud, data center, or head office), network administrators can monitor performance from multiple perspectives.
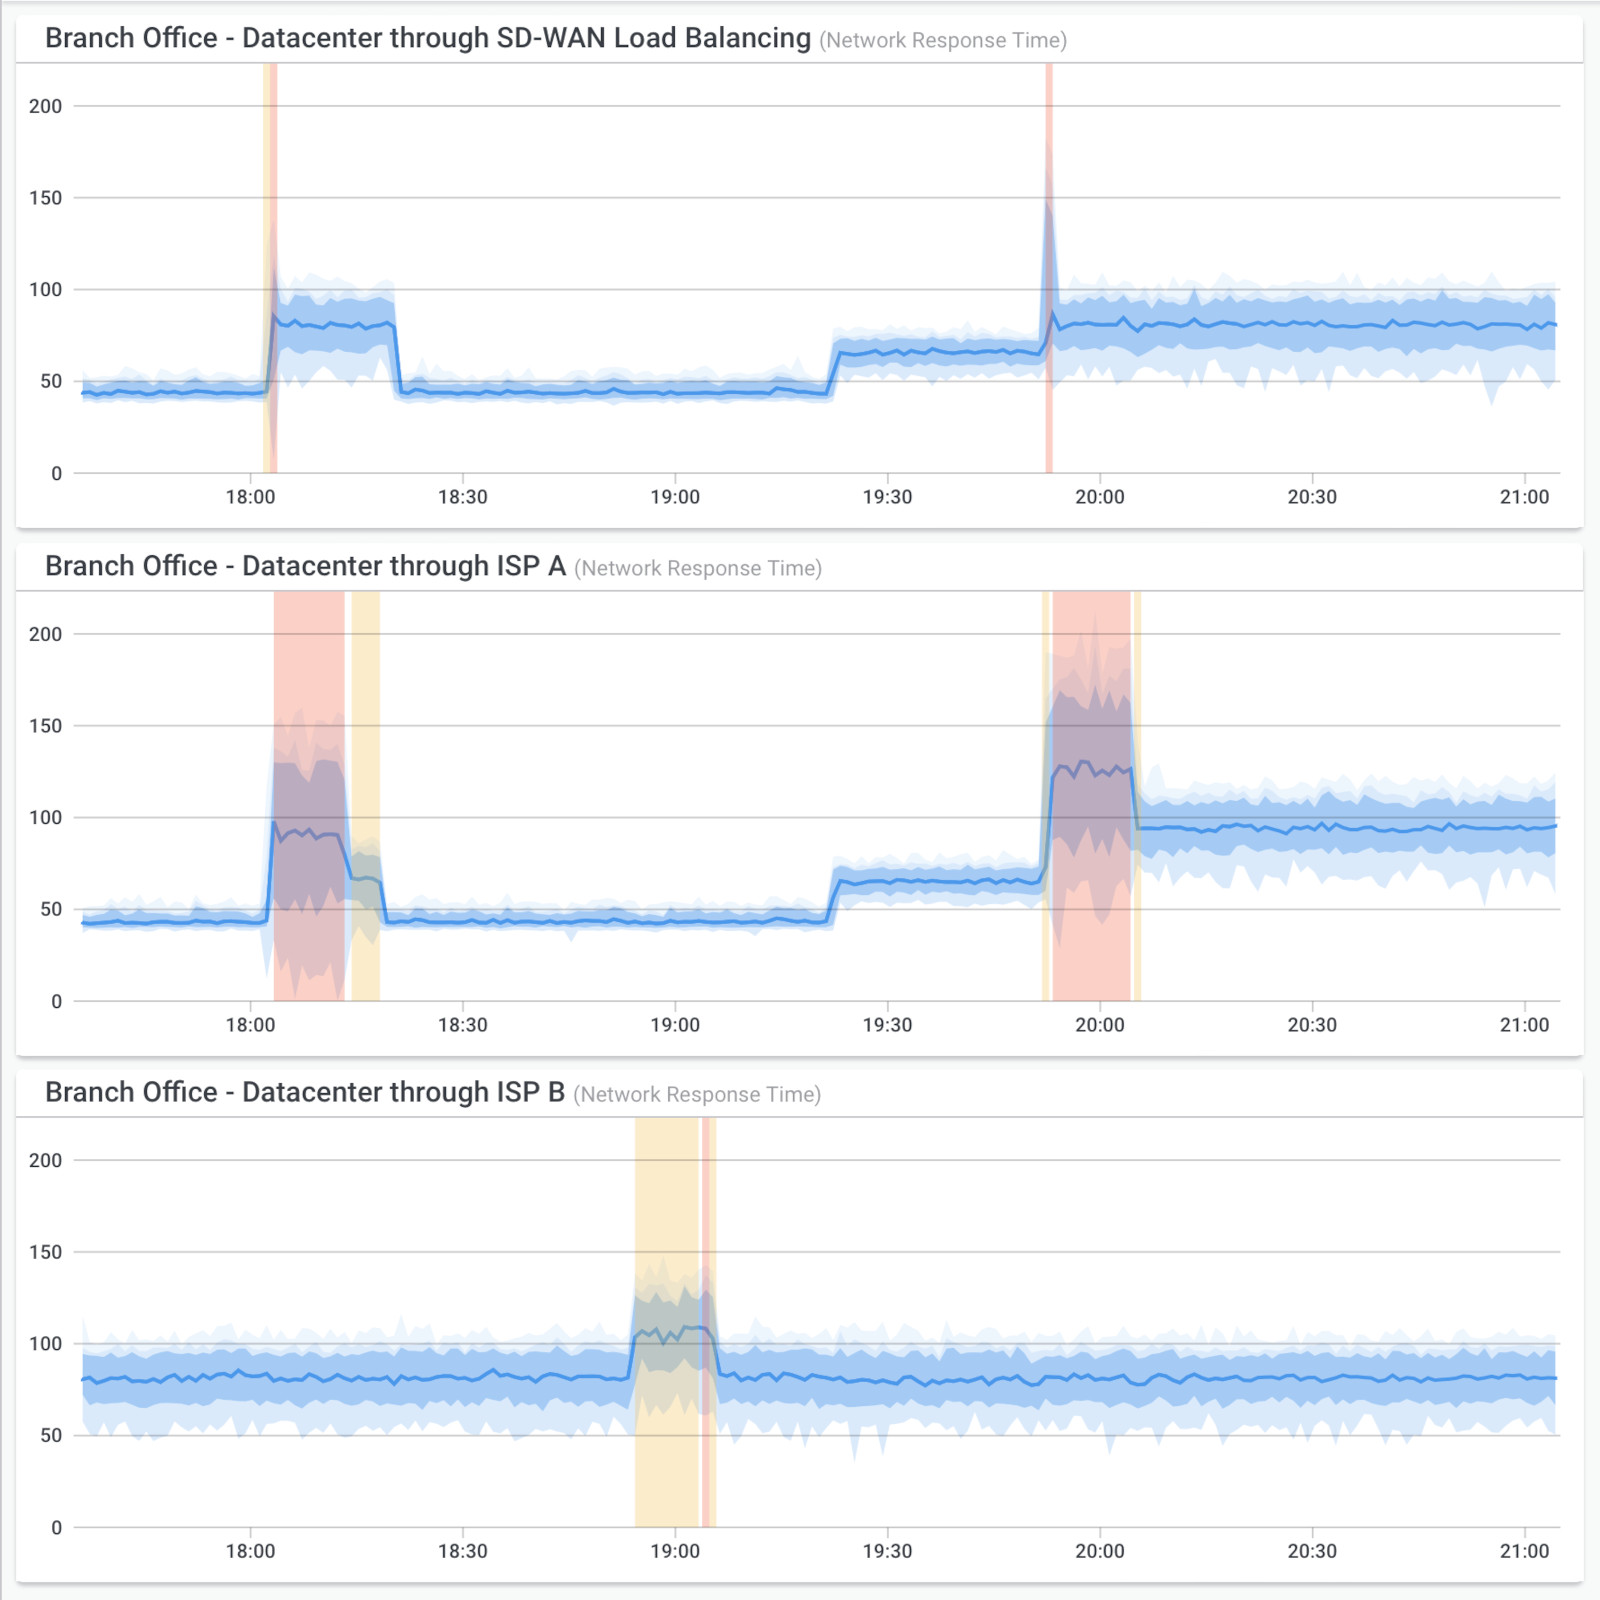 The top graph in the monitoring sessions represents the performance as seen by the end-user, load balanced between the connections using the SD-WAN algorithm. The middle graph shows the performance of the ISP A connection, while the bottom graph shows the performance of the ISP B connection.
By monitoring network performance from multiple perspectives, businesses can identify performance issues and troubleshoot them more effectively. This allows network administrators to take proactive measures to ensure that the network is operating optimally, improving overall network efficiency and uptime.
This type of setup is commonly used by businesses that rely on Fortinet SD-WAN technologies. By monitoring both the end-user perspective and individual ISP connections, they can accurately measure actual network performance and detect any issues that may arise.
Step 6. Identifying Fortinet SD-WAN Performance Issues with Obkio's Comprehensive Monitoring Solution
With Obkio's SD-WAN monitoring solution in place, your business can now have continuous visibility into your network's performance. The solution will start measuring network metrics and detecting performance issues, allowing you to take proactive steps to address these issues.
If your users are experiencing slow application performance or disconnections, Obkio's solution can help you quickly detect these issues. The automatic alerts and Chord Diagram provide a real-time view of your network's performance, allowing you to identify the root cause of any issues and take the necessary steps to resolve them.
By continuously monitoring your network performance, you can ensure maximum uptime and efficiency for your business-critical applications. Obkio's SD-WAN monitoring solution empowers businesses to unlock their Fortinet network's full potential and optimize their network performance.
The Chord Diagram provided by Obkio's SD-WAN monitoring solution offers a clear and detailed visualization of the current state of your network. It shows the names of all the deployed Monitoring Agents, both local and public, and their corresponding connections with each other.
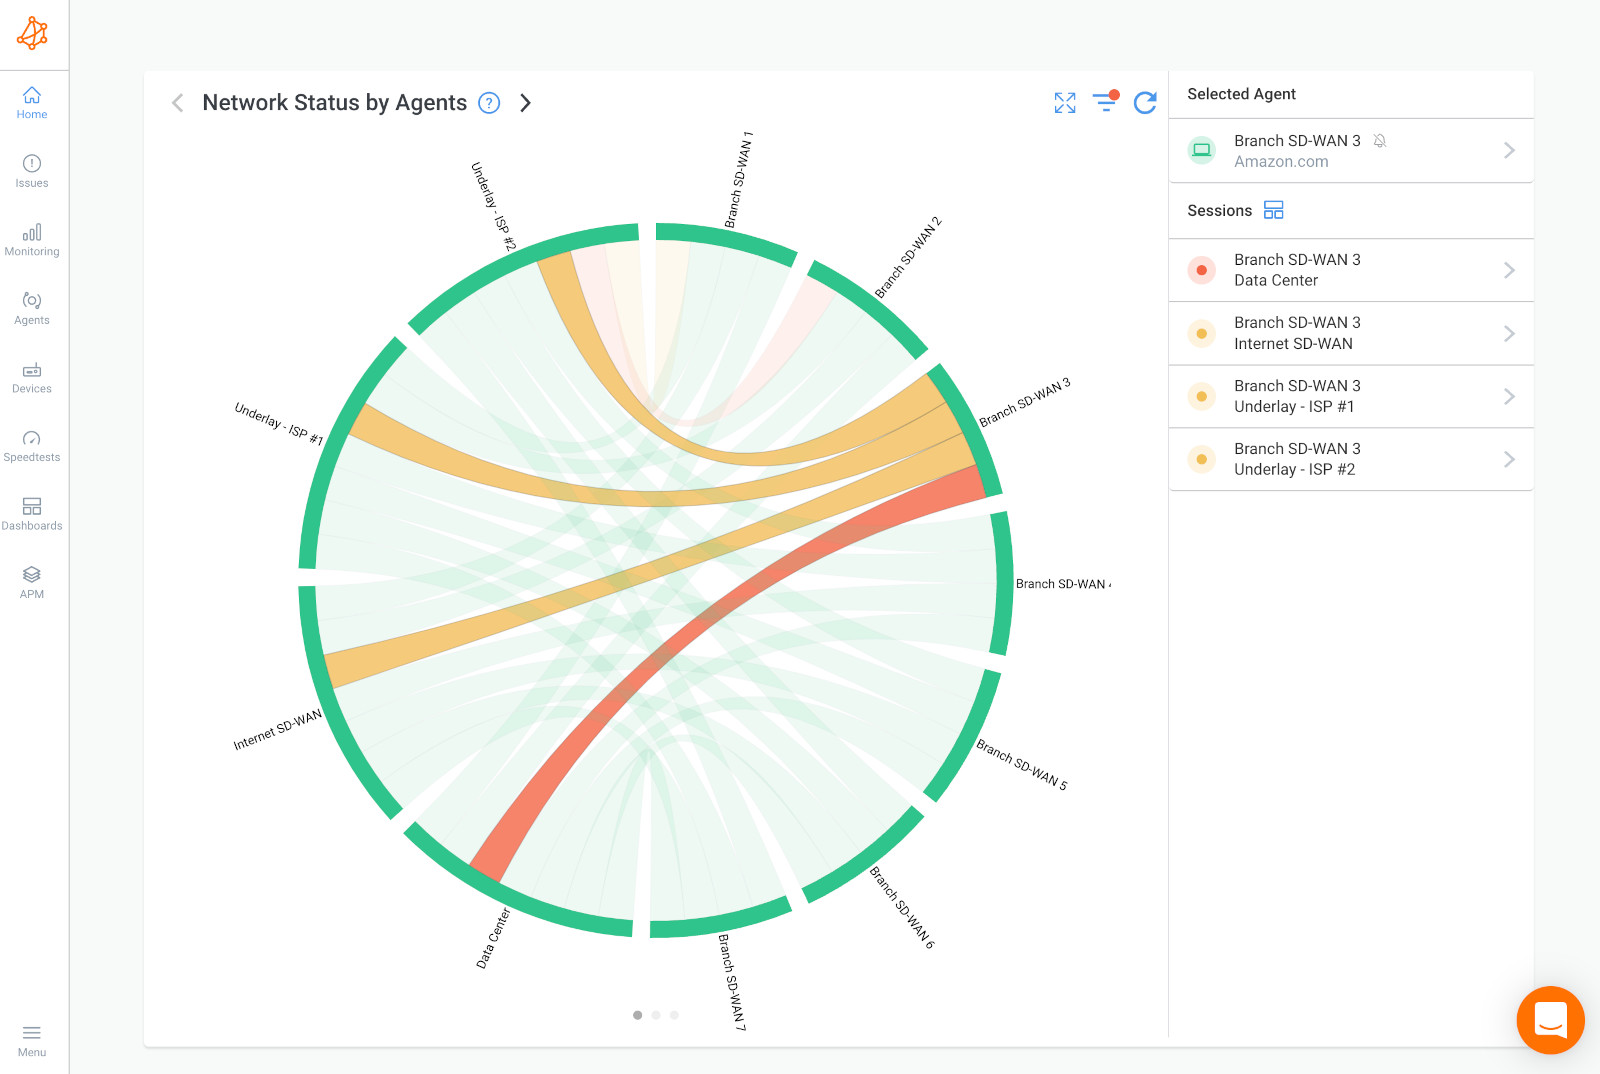
The lines between the Monitoring Agents represent the network sessions and the performance metrics between them. By analyzing the Chord Diagram, you can easily identify performance issues or bottlenecks that may be affecting your Fortinet network.
In addition, the severity levels of the performance issues are also represented by the color of the lines. The red color indicates the most severe issues, while other colors indicate less severe problems.
Overall, the Chord Diagram provides a comprehensive view of your network's performance and can help you quickly pinpoint and resolve any issues that may arise.
It is important to prioritize the troubleshooting of the most severe issues affecting your SD-WAN network, which are typically represented by red network sessions. These issues should be addressed first in the most impacted network locations.
For instance, in the below screenshot, Branch 3 is identified as the most affected location as all of its network sessions are experiencing performance issues.

Switch to Dashboard View to Identify and Troubleshoot Network Issues
To gain more insight into the exact nature and pattern of performance issues, switch to the Dashboard View, which displays all key network metrics for a specific branch on a single page. This allows you to compare information from all deployed Monitoring Agents and identify the root cause of issues.
In the screenshot below, you can see a sample Dashboard for Branch 3, which features various performance graphs that can be customized to display information for different time frames.
The selected view shows performance metrics over the last 8 hours.

Now that we have discussed the importance of monitoring SD-WAN performance from multiple perspectives, let's take a closer look at the Dashboard View provided by Obkio's SD-WAN monitoring solution.
In this view, network administrators can access a wealth of information about the performance of their SD-WAN network, including graphs for UDP monitoring session performance, SNMP polling on the SD-WAN Edge Equipment, and application performance metrics.
- Column 1 displays the UDP monitoring session performance from the Branch 3 Monitoring Agent towards the SD-WAN user experience Monitoring Agents. The first graph depicts the Internet SD-WAN user experience, while the 2 bottom graphs show the experience of the Internet connections (ISP 1 & ISP 2).
- Column 2 represents SNMP Polling (Device Monitoring) on the SD-WAN Edge Equipment. Obkio performs SNMP monitoring on the Monitoring Agent and presents metrics for CPU Usage and Bandwidth Usage in the graphs below.
- Column 3 displays performance metrics for Zoom and Microsoft Teams, which are also provided by Obkio. It presents HTTP Application Performance and VoIP Quality metrics.
Now that we have identified that there is poor performance affecting all the traffic and both ISPs are being affected, the next step is to find the cause.
Upon analyzing the information above, it is apparent that there is a significant performance issue that is impacting all traffic, affecting both ISP 1 and ISP 2.
This occurrence suggests that the network problem is happening on a network segment that is common to both ISPs, potentially occurring in the LAN or directly on the SD-WAN Edge Router.
The cause of this issue is likely high CPU usage, resulting in high packet loss. This is a common problem that arises when the device does not have enough available resources to manage the throughput.
Using the historical data available on the dashboard, you can analyze the network performance to identify triggers, patterns, or deviations from the baseline. This analysis can help you determine when the problem first occurred, whether it is continuous or intermittent, and whether it is flapping.
By examining the screenshot above, you can see a pattern indicating an intermittent network problem that occurs intermittently and does not follow a specific pattern.
However, the high CPU usage is evident and requires attention.
With SD-WAN monitoring, you have the power to uncover the root cause of any network issues.
In addition to monitoring and analyzing network performance, you can use Obkio Vision, a free visual Traceroute tool that continually runs to identify any problems in your WAN and over the Internet.
This tool is invaluable in pinpointing the exact location and cause of any issues affecting your network.
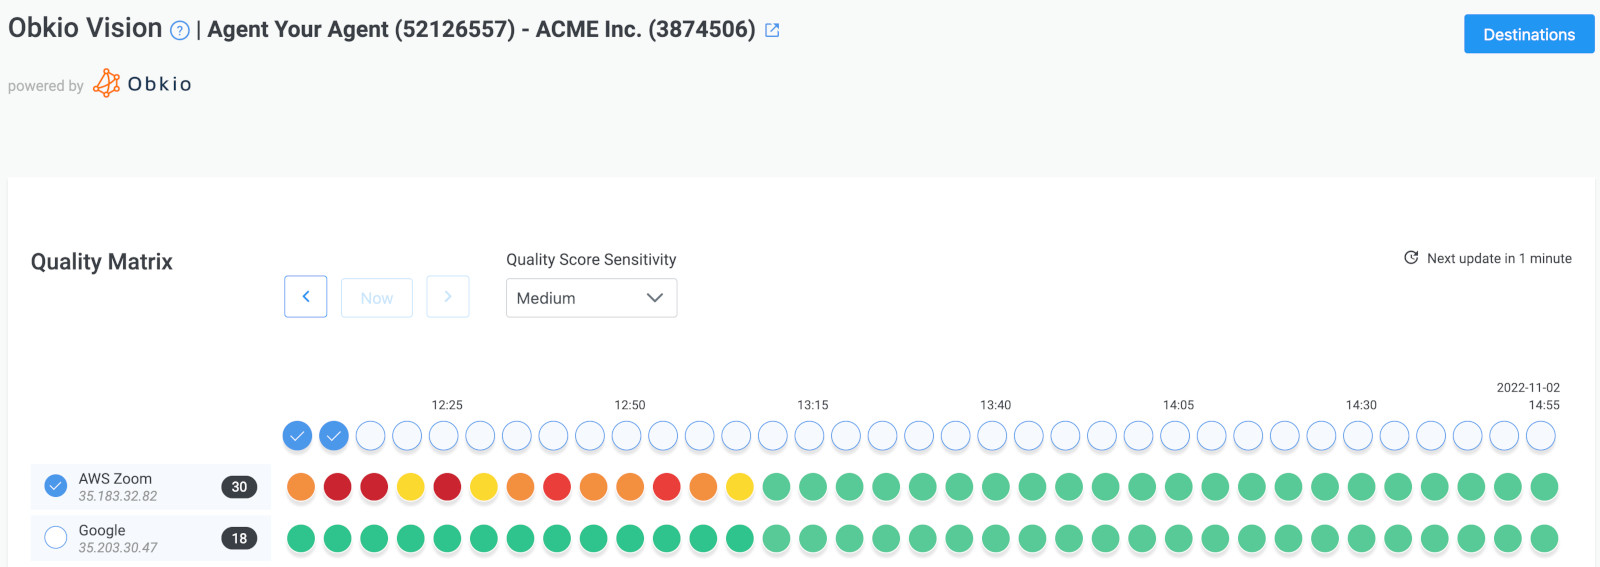 Obkio Vision Quality Matrix
Note: If you have determined that the network problem is happening on your end, this step may not be necessary as it will only confirm that conclusion.
Using Traceroutes, the Network Map, and the Quality Matrix, you can identify if the problem is occurring towards a specific location over the Internet, meaning that only one particular site is being affected.
 Obkio Vision Network Map
You may need to open a support case with your ISP as the issue is on their side.
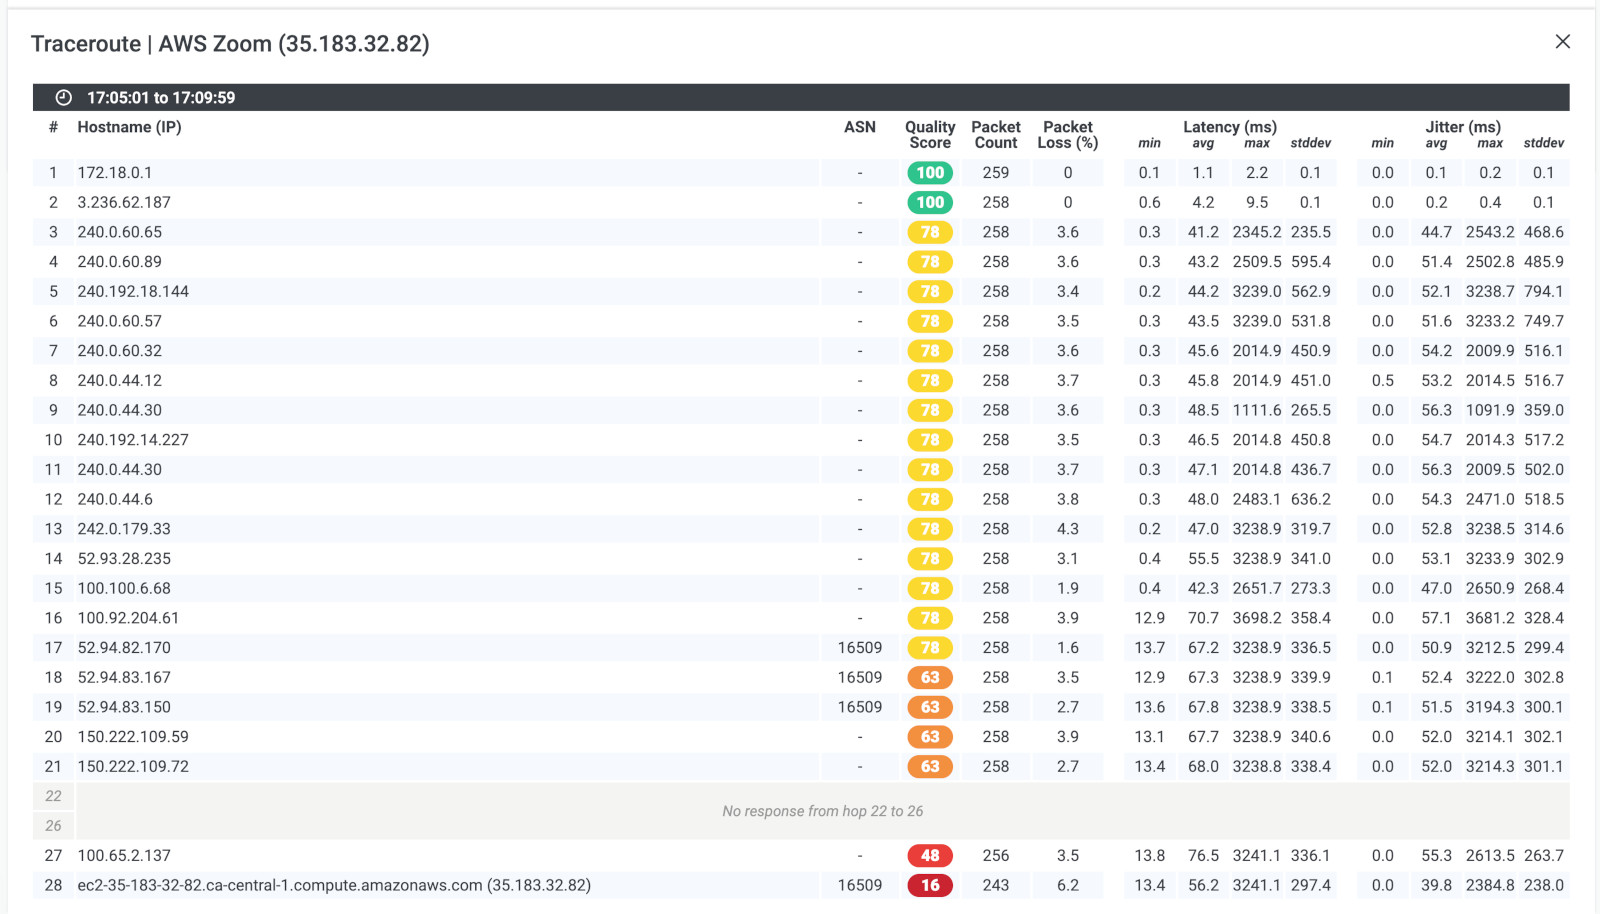 Obkio Vision Traceroutes
Armed with the insights gained from SD-WAN monitoring, you now have the information you need to take the necessary steps to resolve the issue and restore optimal network performance.
In case the issue lies within your ISP's network, take the following steps:
- Contact your ISP's technical support and provide them with the screenshots of the Monitoring Sessions, Dashboards, or Traceroutes obtained from Obkio Vision.
- Utilize Live Monitoring mode to receive real-time updates and share Live Traceroute results with your ISP by providing them with a public link.
- If your ISP requires further analysis of your data, create a temporary Read-Only User account in your Obkio account for them to access.
If the issue is within your company's network, there are a few steps you can take to troubleshoot the problem:
- If you're experiencing CPU or bandwidth issues, consider upgrading your Internet connection bandwidth with your ISP to ensure adequate resources.
- Analyze your network devices to determine the root cause of high CPU usage or lack of resources. Outdated firmware, software issues, or limited device resources may be contributing to the problem. In some cases, upgrading to a larger device may be necessary to address the issue effectively.
- Examine firewall logs or in your Fortianalyzer to determine if the network traffic is legitimate. Illegitimate traffic may indicate a security breach, such as data exfiltration or unauthorized access, or could be due to large data backups occurring during business hours instead of during off-peak hours.
- Prioritize traffic in your firewall to mitigate the impact of congestion on critical applications. Prioritizing certain traffic can reduce the impact of congestion on affected applications and ensure that critical applications continue to function as expected.
Alright, warriors of the tech world, you're now equipped with the tools to conquer any network challenge that comes your way! Don't let your network become a chaotic jungle - stay on top of it with the right monitoring practices.
Keep a proactive mindset, monitor your network continuously, and be prepared to tackle any issues that may arise.

With the power of SD-WAN monitoring at your fingertips, you can take your business to new heights.
So go forth, fight for your Fortinet network's optimal performance, and may the packets be in your favor!


 Obkio Blog


