






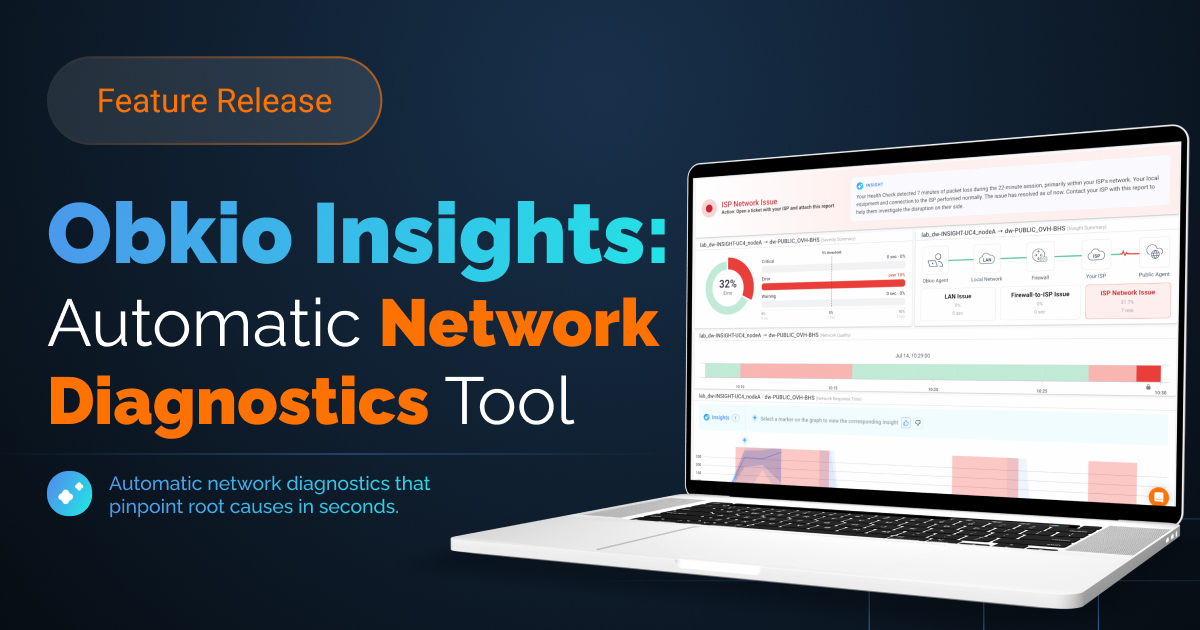


Obkio Insights
- What are Obkio Insights
- Which root causes can be detected
- How to configure Insights
What you are going to learn:
What are Obkio Insights? 
When a Network Event such as packet loss, high latency or jitter is detected on a Network Monitoring Session, Obkio Insights automatically analyzes the data collected around the event to identify the most likely root cause. The analysis correlates Traceroutes, Network Device metrics (CPU, memory and bandwidth) and Monitoring Agent system data.
The result is an Insight: a plain-language explanation of what caused the issue, displayed directly on the network issue, so you know right away if the problem is on your local network, your ISP or one of your devices.
Root Causes Detected
Local Network (LAN) Issue: The degradation starts inside the local network, at the source or the destination of the monitoring session.
ISP Local Loop Issue: The issue is located on the local loop, between your site and your ISP.
ISP Network Issue: The issue is located inside the ISP's network, beyond the local loop.
High Bandwidth Usage: The Internet connection is saturated. Detected by comparing the traffic on the Internet-facing interface with the configured maximum speeds.
High CPU Usage: A network device on the path (ex: firewall) has a CPU spike compared to its baseline.
High Memory Usage: A network device on the path is running low on memory.
When no root cause can be determined, the network issue is displayed as usual, without an Insight.
Insights in the App
Insights are displayed in the Insights panel of the App, along with the network issues. For each Insight:
- The root cause is displayed on the issue with the affected monitoring session.
- Click
See what led to this conclusionto review the evidence behind the analysis, such as the traceroute comparison or the device metrics. - Click the dashboard button to generate a dashboard pre-populated with the relevant widgets (network response time graph, traceroutes, device metrics and interfaces).
Insights are also displayed as markers on the network monitoring session graphs, aligned with the moment the event occurred.
Configuration
Insights based on traceroute analysis (LAN and ISP issues) work out of the box, without any configuration.
To enable device-related Insights (High Bandwidth, CPU and Memory), some context about your network is required:
- Monitor your firewalls and routers with Network Device Monitoring.
- Pair each Monitoring Agent with the network device it is behind, in the Insights configuration page.
- Configure the Internet-facing interface of the device with its maximum download and upload speeds, in the device
Insight Configpage. This allows the analysis to detect when the Internet connection is saturated.
Feedback
Each Insight can be rated with a thumbs up or thumbs down, with an optional comment. The feedback is reviewed by the Obkio team and is used to continuously improve the accuracy of the analysis.
Availability
Obkio Insights availability depends on your subscription plan. Contact Obkio's support team for more details.