











 Obkio Blog


 Subscribe
Table of Contents
Table of Contents
Today, we're launching Obkio Insights, our biggest feature yet, and the one we've been building toward for 8 years.
Insights is now generally available to every Obkio user, on every plan. Since the beta launch, we've expanded root cause coverage and shipped refinements based on real-world feedback from customers running Insights in production. It's ready for every network we monitor.
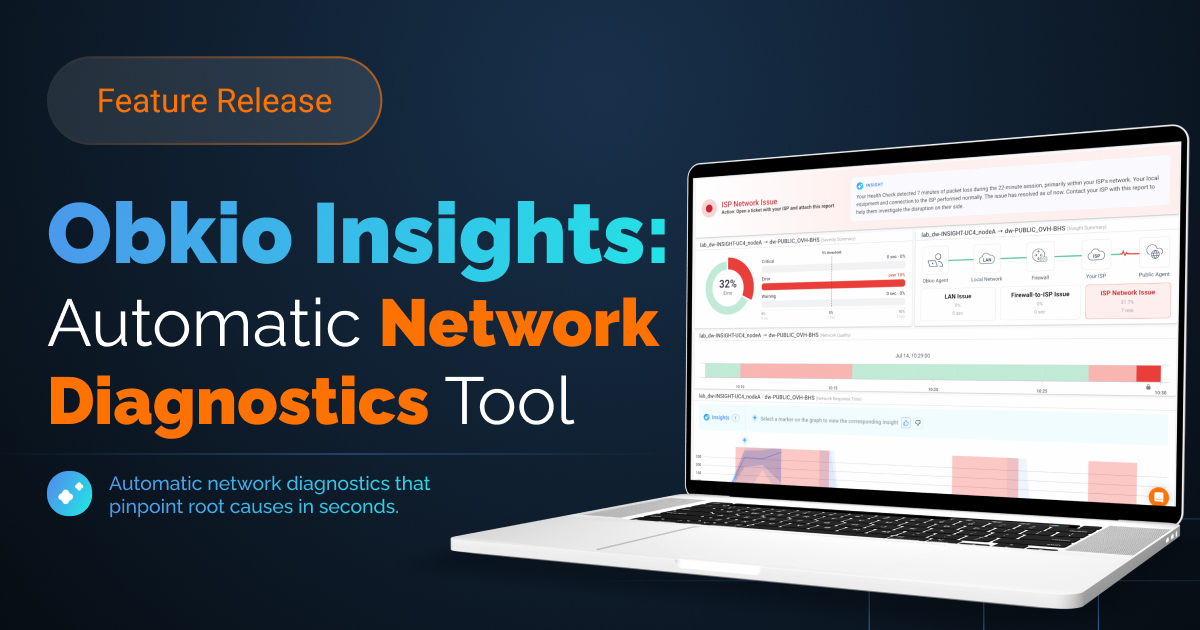
Obkio Insights is an automatic network diagnostics engine that correlates all your monitoring data to identify the root cause of network issues in seconds. IT pros no longer need to troubleshoot the cause and source of network issues manually. Obkio Insights now gives you an automatic network diagnosis delivered the moment a performance problem is detected.
8 Years of Building Toward Automatic Network Diagnostics 
When we founded Obkio, we had one ultimate goal: build a network monitoring tool that didn’t just detect issues, but diagnosed them automatically. To get there, we knew we had to build the right foundation first.
Over the past 8 years, we built that foundation layer by layer: Network Performance Monitoring, SNMP Device Monitoring, Visual Traceroutes, and Application Performance Monitoring. Each feature was meaningful on its own. But together, they were always building toward a single intelligent layer that could correlate all of that data and automatically tell you why a network issue is happening, where it’s coming from, and who needs to fix it.
Obkio Insights is that layer. And it changes how IT teams troubleshoot networks.
The Problem: Manual Network Troubleshooting Is Broken
Network troubleshooting is one of the most time-consuming, frustrating tasks in IT. When a network performance issue hits, diagnosing the root cause requires manually correlating data across multiple sources: network performance metrics, device health, routing paths, and application behaviour. That process is slow even for seasoned network engineers, and overwhelming for anyone who isn't a dedicated network specialist.
Most network monitoring tools send an alert and leave the investigation to you. This leads to hours of manual network diagnosis, data scattered across tools, and no clear answer about what actually caused the issue.
Obkio Insights was built to solve exactly that. By the time the alert reaches you, the network diagnosis is already done.
What Is Obkio Insights?
Obkio Insights is an automatic network diagnostics feature built directly into Obkio's network monitoring platform. It uses a multi-source correlation engine, built on our founders' 25 years of networking expertise, to automatically analyze NPM, SNMP Device Monitoring, and Visual Traceroute data simultaneously, the moment a network issue is detected.
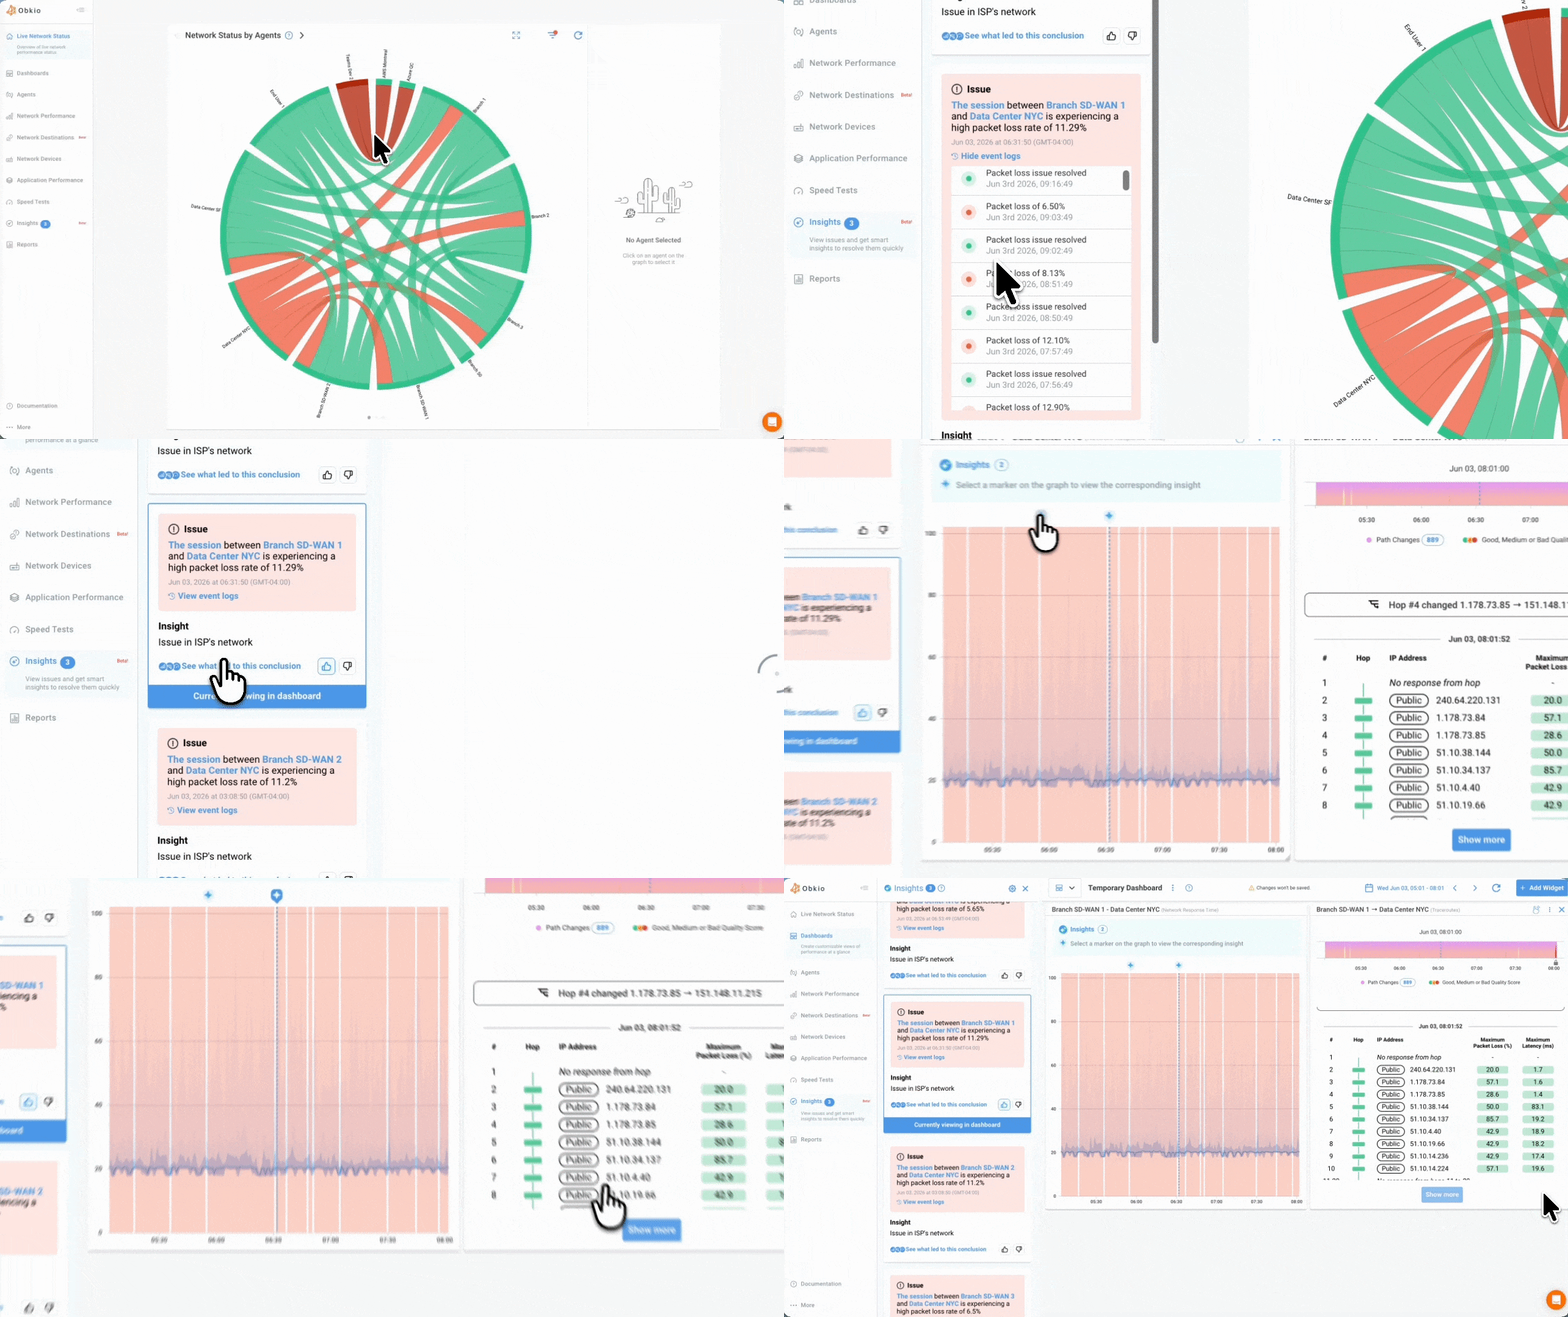
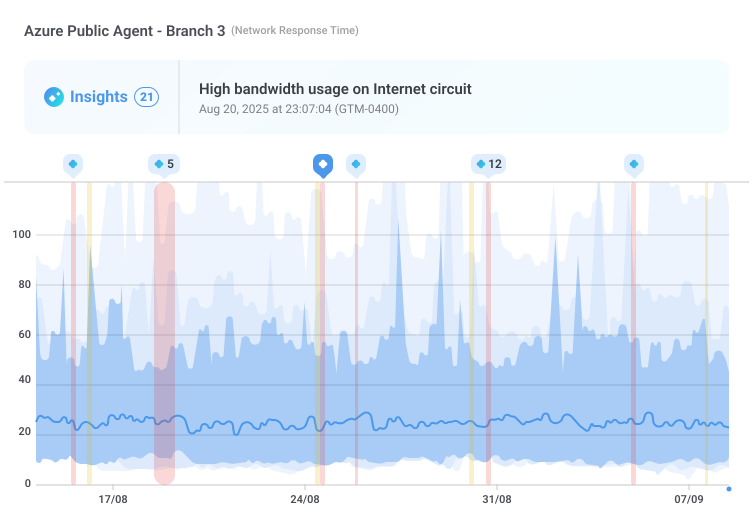
As a result, users now receive a probable root cause identified in seconds, displayed directly on the issue, with full diagnostic evidence available in one click. Every Insight is listed in the Insights tab, and also appears as a marker directly on your network monitoring graphs, right at the moment the event occurred. For now, Insights is available on monitoring sessions between a local Agent and the Public Monitoring Agent (i.e., Internet-facing monitoring). Support for other session types is planned as Insights' coverage expands.
Available on Every Obkio Plan, From Free to Enterprise
Obkio Insights is included on every Obkio plan, from Free to Enterprise. If you're monitoring your network with Obkio, Insights' automatic diagnostics are already included.
How Obkio Insights: Automatic Network Diagnostics Works
Insights' automatic network diagnostics engine activates the moment Obkio's Network Performance Monitoring detects a performance issue, like packet loss or a latency spike. It immediately runs through the following diagnostic process:
Step 1. Check for False Positives:
Insights verifies whether the Monitoring Agent had all the resources needed to run its tests. If not, it's flagged as a user-side issue immediately.
Step 2. Analyze SNMP Device Performance:
Insights examines CPU, memory, and bandwidth usage on network devices. to detect congestion or resource constraints, identifying the specific device responsible if one is found.
Step 3. Correlate With Traceroutes:
Insights cross-references traceroute data from the same time period to identify latency, packet loss, or jitter between IP addresses and surfaces the affected network path hops.
Step 4. Deliver an Automatic Diagnosis:
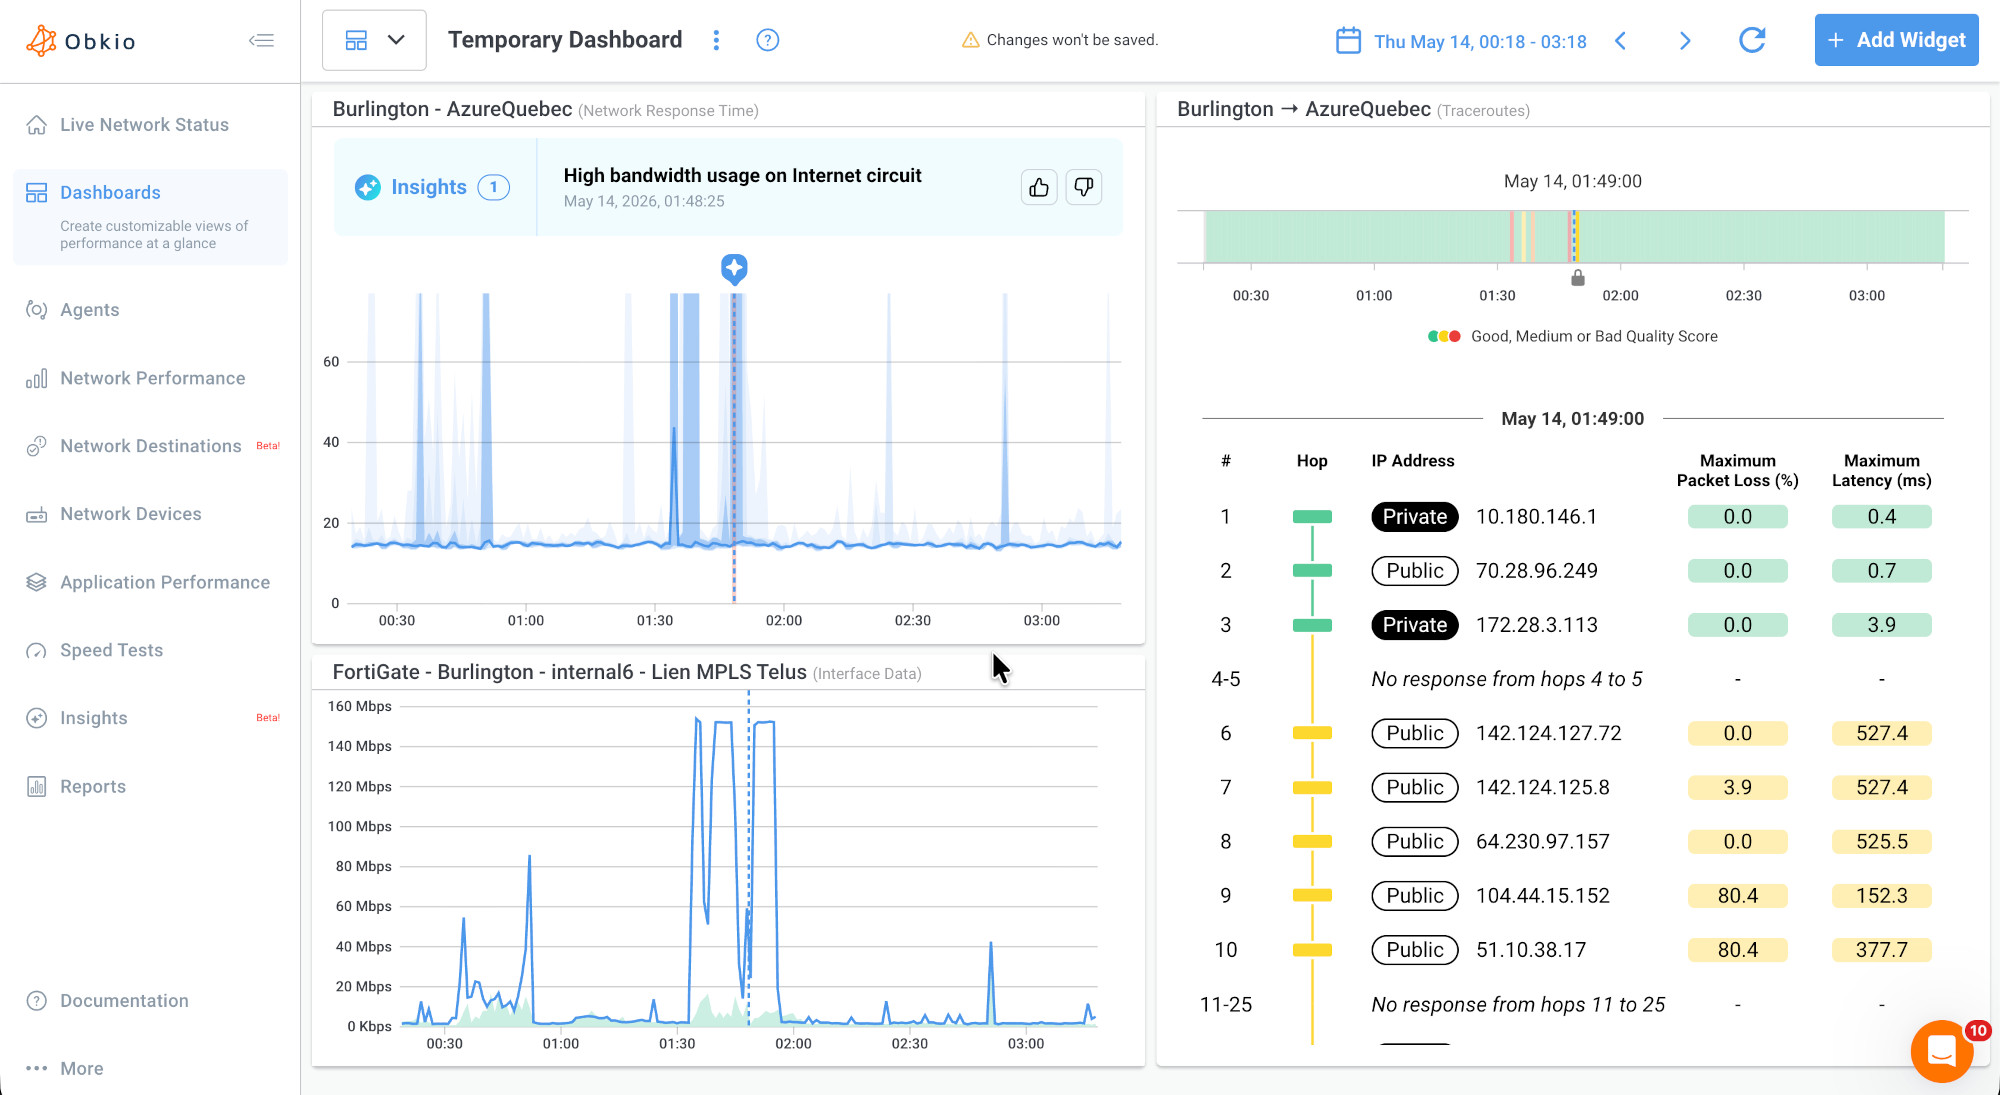
A probable root cause is displayed directly on the issue. Users click. Users click "See what led to this conclusion" to open the automatic diagnostic dashboard, where all correlated data is displayed, and root cause sources are highlighted.

A note on issue severity: Obkio issues fall into four states, each with a fixed client-facing title and recommended action:
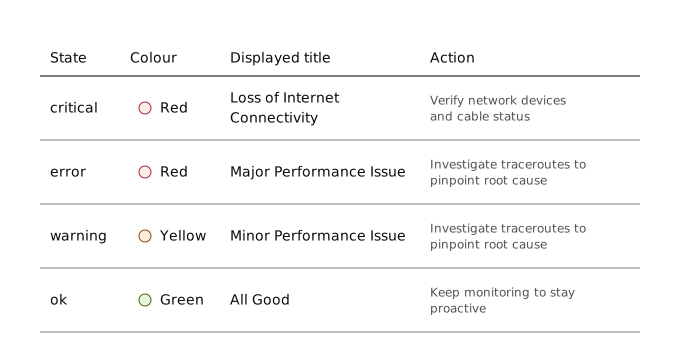
At launch, Insights only produces a diagnosis at the error / "Major Performance Issue" level. It does not yet run on critical / "Loss of Internet Connectivity" or warning / "Minor Performance Issue". Support for those is on the roadmap and will roll out in a future update.
How to Use Obkio Insights
Insights relies on SNMP Device Monitoring data to detect performance slowdowns, firewall-related problems, and port saturation.
Traceroute-based diagnoses, like LAN and ISP issues, work out of the box with no setup.
To also get diagnoses on device-related issues, link at least one Agent to a Device in your account. This pairing tells Insights which device's SNMP data to correlate with a given Agent's sessions.
Step 1. Open Insights Configuration: In the "Insights" tab, click the settings icon to open the Insights Configuration window.
Step 2. Pair an Agent with a Device: Select an Agent (e.g., a branch office Agent) and the Device you want to link it to (e.g., that branch's firewall or router).
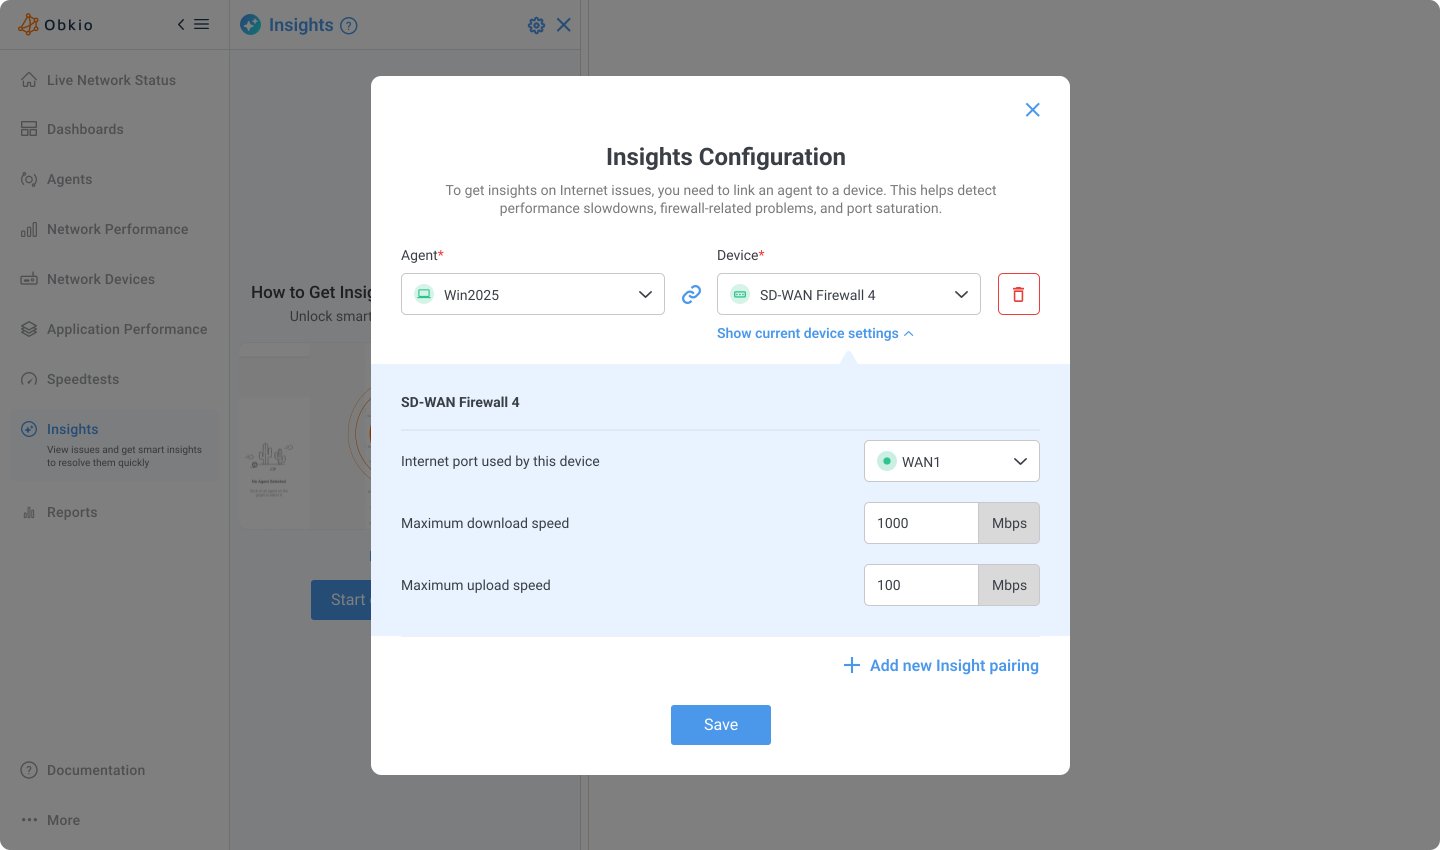
Step 3. Set the device's interface speeds: Click "Show current device settings" to expand the device's configuration, select the Internet port used by the device, and enter its maximum download and upload speeds. This allows Insights to detect when the connection is saturated.
Step 4. Add additional pairings: Click "Add new Insight pairing" to link as many Agent-Device combinations as your network requires.
Step 5. Save your configuration: Click "Done." Insights will begin correlating data from the paired devices the next time a performance issue is detected on that Agent.
Since Insights depends on SNMP Device Monitoring, we've also simplified how devices are added to Obkio, so pairing an Agent with a Device takes just a few clicks.
View the Documentation about Insights
Core Features of Obkio Insights
Insights presents its findings clearly, making network diagnosis accessible to IT generalists and non-network specialists. Users receive a clear probable root cause, like "High memory usage on firewall" without needing to interpret raw data themselves.
In addition, Obkio Insights offers many features that make it the simplest and most accessible network diagnostics tool on the market.
Automatic Network Root Cause Analysis
Insights' correlation engine automatically identifies the root cause of network performance issues the moment they're detected, eliminating the need for manual investigation. It analyzes all available monitoring data from the time of the issue and delivers a clear, plain-language diagnosis.
Multi-Source Network Data Correlation
Insights correlates data across three key sources simultaneously: Network Performance Monitoring (NPM), SNMP Device Monitoring, and Visual Traceroutes. By analyzing all layers of the network together, Insights produces a complete and accurate network diagnosis that no single data source could provide on its own.
Automatic Diagnostic Dashboards
Every diagnosis comes with a one-click, automatically generated diagnostic dashboard that displays all the correlated network data from the issue's timeframe. Root cause data sources are highlighted directly in the dashboard, so your team can follow Insights' reasoning step by step and see exactly what triggered the diagnosis.
New Widgets Releasing Alongside Insights
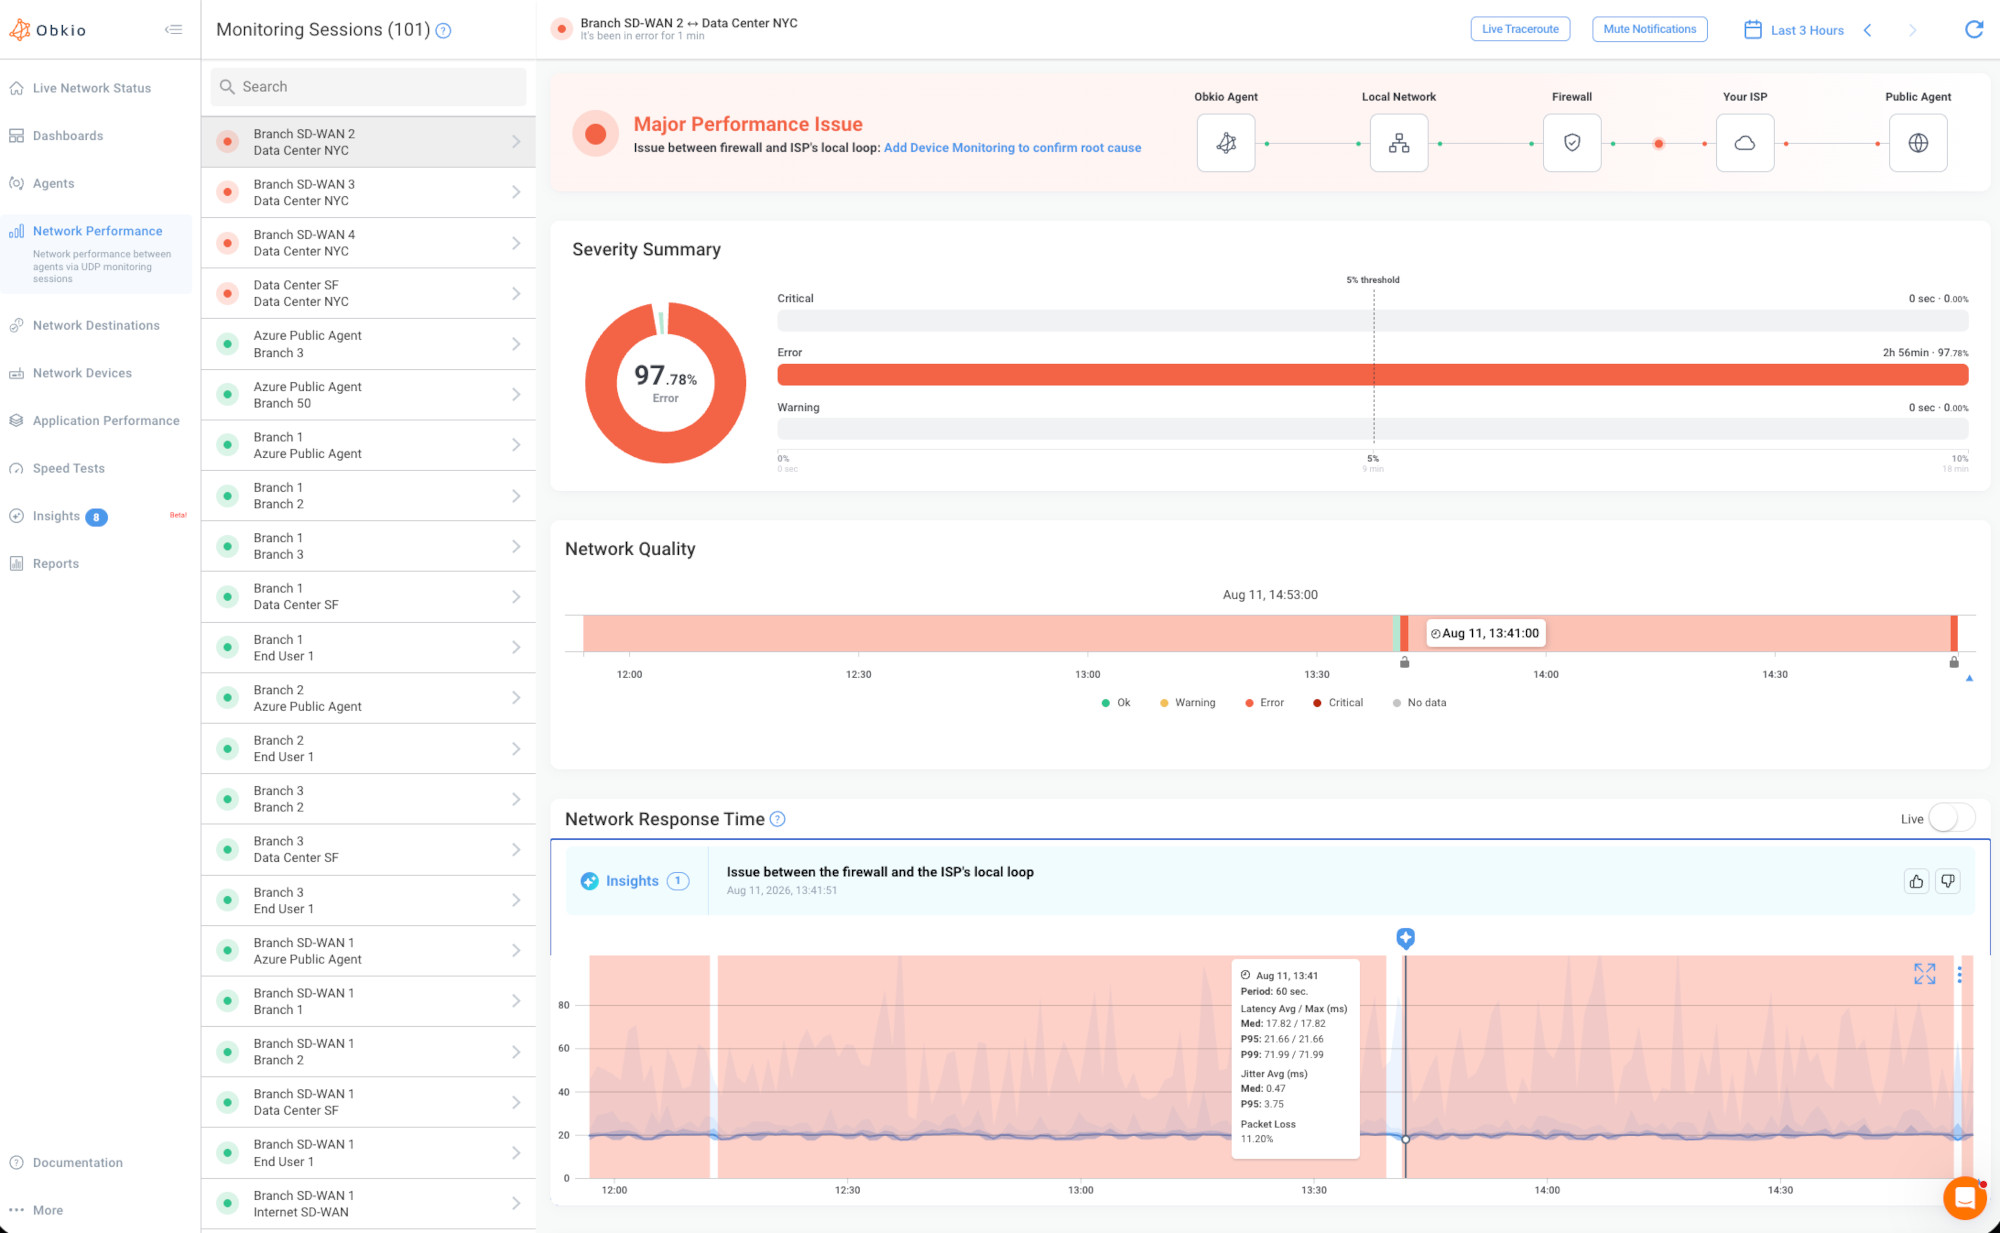
To find them, go to the Network Performance tab and click on any monitoring session. The Network Quality Timeline and Severity Summary are based on session alerts, so they appear by default on every session.
The Status Overview is tied directly to Insights, so it only appears when there's an active Insight for that session.
These widgets can also be added to Dashboards. They're built to give you a clearer overall understanding of your network's status, and a straightforward diagnostic of your most serious issues: when they happened, where, and why.
1. Status Overview
The Status Overview maps the full network path, from agent to LAN to firewall to ISP to public agent, and visually highlights the specific segment that Obkio Insights identified as the root cause, so the diagnosis is easy to follow at a glance. Because it's built directly on top of an Insight, this widget only appears when there's an active Insight for that session, and Insights currently only run on sessions between a local Agent and the Public Agent (i.e., Internet-facing monitoring).
Alongside this, Insights generates an AI-written summary explaining what happened and what to do next. Rather than interpreting charts and metrics yourself, you get a clear explanation, for example, identifying intermittent network issues detected over a session, where the problem occurred, whether it has since resolved, and what to check if it recurs. It's the fastest way to understand your network's status without reading a single graph. As with any AI-generated text, treat it as a helpful starting point rather than the final word, it can occasionally get a detail wrong.

2. Severity Summary
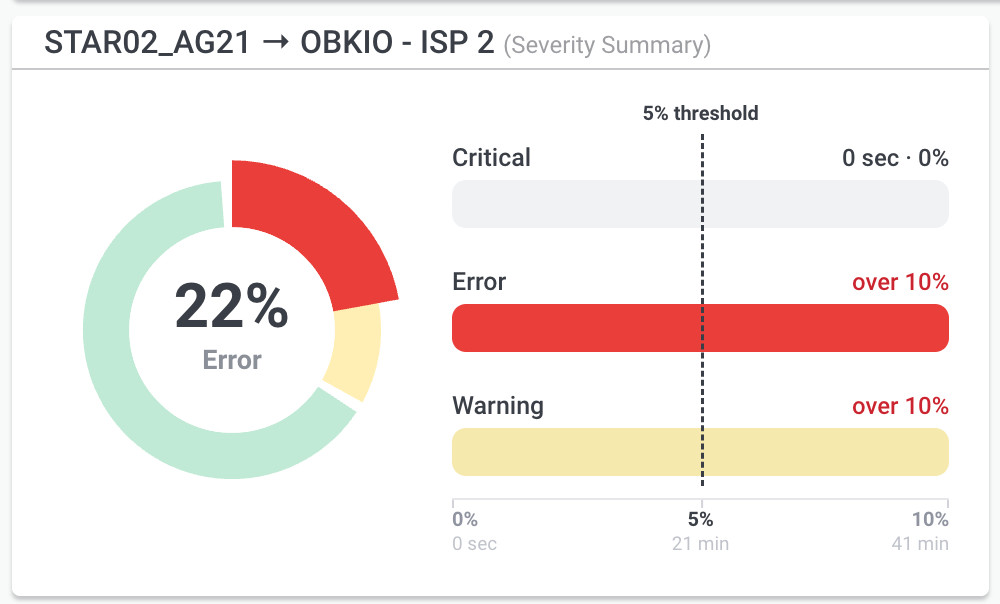
The Severity Summary breaks down exactly how much time an issue spent in Warning, Error, and Critical states against your configured thresholds, so teams can gauge how serious a problem was before they even open Insights' diagnosis.
3. Network Quality Timeline
The Network Quality Timeline displays network health over a selected time range as a colour-coded timeline, making it easy to see exactly when an issue occurred, then jump straight to Insights' diagnosis for that period.

Together, these widgets and Insights' automatic diagnostics engine are designed to work as one: faster detection, clearer severity, and an immediate answer for what to do next.
What Network Issues Obkio Insights Diagnoses Today
Today, Obkio Insights automatically identifies seven distinct root-cause labels. How many of those seven a given customer sees, three or six, depends on whether they've configured Device Monitoring.
Without Device Monitoring: 3 Cases
With traceroute data alone and no device configuration, Insights narrows every issue down to one of three outcomes:
- Issue on LAN network → “Check your Local Network”
- Issue between the firewall and the ISP's local loop → “Add Device Monitoring to confirm root cause”
- Issue in ISP's network → “Open ticket with ISP and share this report”
With Device Monitoring: 6 Cases
Once at least one Agent is paired with a Device, case #2 above disappears, and the engine splits it into four more specific diagnoses, because it can now rule the firewall in or out directly:
- Issue on LAN network → “Check your Local Network”
- High bandwidth usage on firewall → “Investigate source IPs”
- High CPU usage on firewall → “Investigate CPU process usage”
- High memory usage on firewall → “Investigate Memory process usage”
- Issue on ISP's local loop → “Open ticket with ISP and share this report”
- Issue in ISP's network → “Open ticket with ISP and share this report”
Why this matters: the suggested action for case #2, without Device Monitoring, is literally "Add Device Monitoring to confirm root cause." The engine tells you exactly what data it's missing to get more precise. Give it that data, and one vague diagnosis becomes four precise ones. It's the strongest reason to pair your devices, and it's an onboarding argument, not just a technical footnote.
Who Is Obkio Insights For?
Obkio Insights was built for every IT team, regardless of size, budget, or level of network expertise.
- IT Generalists no longer need to be network specialists to diagnose a network issue. Insights delivers clear answers, whether the problem is internal, external, or with a specific device, so any IT team member can act immediately or escalate with confidence.
- Network Engineers can skip the manual correlation work that used to take hours. The full diagnostic evidence is always available when they need to dig deeper, challenge an ISP, or validate a root cause.
- MSPs can empower every technician to diagnose issues that previously required senior network expertise, and use Insights' data-backed findings to eliminate the blame game with clients and open support tickets with proof, not assumptions.
- IT Managers and Leadership can use Insights' diagnostic reports to hold service providers accountable, justify infrastructure investments, and demonstrate the real business impact of network performance issues on productivity and operations.
What’s Coming Next for Obkio Insights
Obkio Insights launches with automatic network diagnostics focused on Internet connectivity use cases. Over the coming months, we'll be expanding Insights' diagnostic coverage to include:
- VPN network troubleshooting and diagnostics
- SD-WAN performance diagnostics
- Microsoft Teams and unified communications diagnostics
- Real User Monitoring (RUM) diagnostics, to correlate real end-user experience data with network performance
- Additional web applications and network architectures, prioritized based on customer needs
Obkio Insights was the ultimate goal we set 8 years ago. Now that we've reached it, it becomes the new foundation. We're not stopping here.
From Network Monitoring to Network Diagnostics
Obkio was built on network monitoring: detecting issues, tracking performance, and alerting your team when something goes wrong. But monitoring alone has always had a ceiling. It tells you something is wrong. It doesn’t tell you why.
Obkio Insights is what breaks through that ceiling. By automatically correlating data across all monitoring sources and delivering a root cause the moment an issue is detected, Insights transforms Obkio from a network monitoring tool into a network diagnostics platform. One that doesn’t just surface problems, but tells you exactly what caused them and where to act.
This is what makes Obkio a network observability platform, not just a tool that watches your network, but one that understands it.
Get Started With Automatic Network Diagnostics
Obkio Insights is available to every Obkio customer automatically, no request or setup needed. The "Issues" tab in the Obkio app has been replaced with a new "Insights" tab, where you'll find every automatic diagnosis as soon as it's generated, along with the option to see what led to each conclusion.

We'd still love your feedback. Every diagnosis in the Insights tab includes a thumbs up or thumbs down, so you can tell us directly whether the conclusion was helpful. It's the fastest way to help us keep improving Insights' accuracy over time.


