









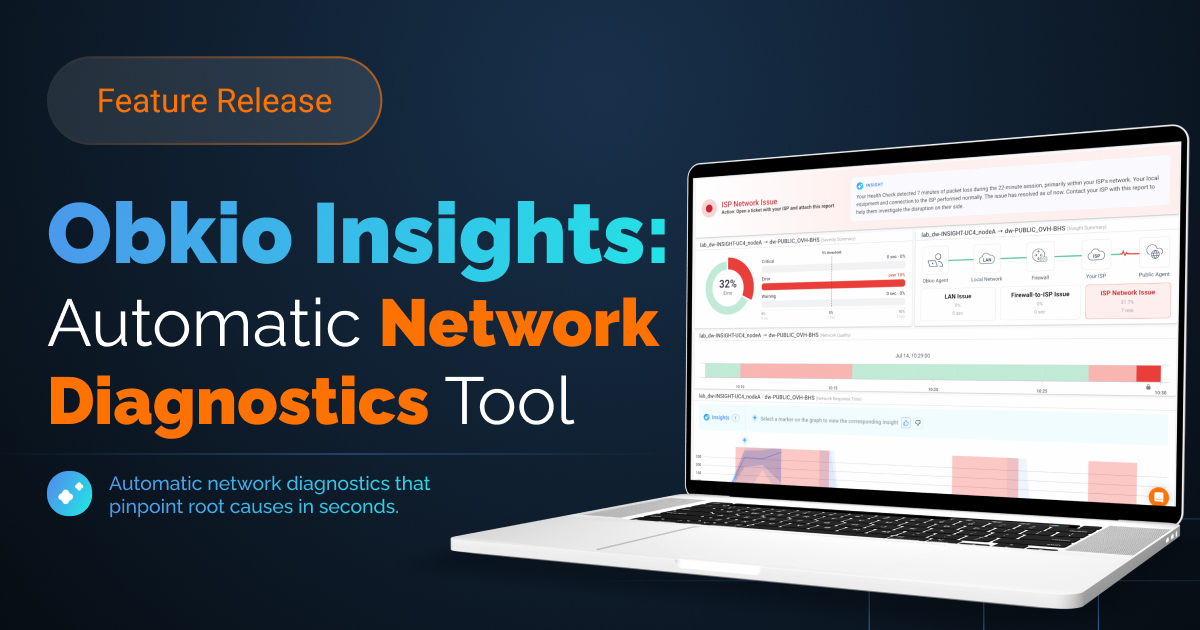


 Obkio Blog


 Subscribe
Table of Contents
Table of Contents
Obkio is making improvements to its network performance monitoring and observability solution, aimed at helping users of every expertise level interpret their data more efficiently. That work isn't just about telling users something is wrong. It's about diagnosing the issue for them. And a big part of that is telling them where the issue is happening, so they know exactly where to direct their troubleshooting effort instead of guessing.
The Status Overview widget solves this. Its job is simple: tell you what's wrong with your network and where, without making you dig through graphs first. It's the widget that turns raw performance data into an actual answer.
Here's what it does, how it works, and where you'll find it.
What Is the Status Overview Widget? 
Obkio’s Status Overview widget doesn't just tell you something is wrong. It shows you where. The widget surfaces the single most important network issue diagnosed across all your monitored sessions during a given period, along with exactly where in the network path it's happening.
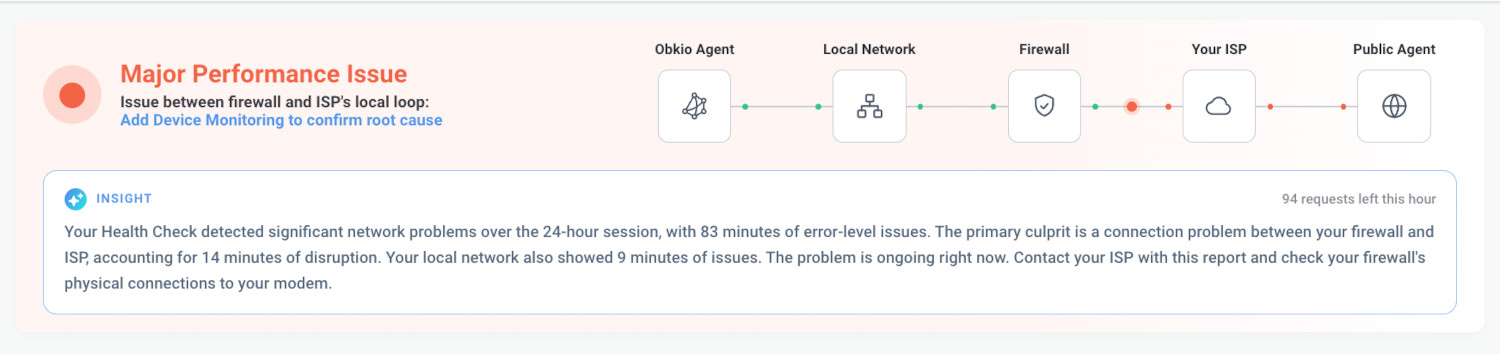
The Insight shown comes from Obkio's Insights engine, which already runs in the background analyzing your sessions. Insights identifies seven distinct root-cause labels in total. How many show up for a given session, three or six, depends on whether Device Monitoring is configured:
- Without Device Monitoring: Issue on LAN network, Issue between the firewall and the ISP's local loop, Issue in ISP's network.
- With Device Monitoring: Issue on LAN network, High bandwidth usage on firewall, High CPU usage on firewall, High memory usage on firewall, Issue on ISP's local loop, Issue in ISP's network.
At launch, Insights only diagnoses issues at the Error severity level. Each diagnosed Insight has a name, a severity level, and an occurrence count for how often it showed up during the period.
The Status Overview widget is directly tied to Insights, so it only appears on a monitoring session when there's an active Insight to show. No Insight, no widget. It'll show up as soon as one is detected, but it won't sit there with a "nothing wrong" state in the meantime. Right now, Insights (and therefore this widget) are only available on monitoring sessions between a local Agent and the Public Agent (i.e., Internet-facing sessions).
How the Status Overview Widget Works
The widget picks the most impactful Insight from the period, based on how often it occurred, and displays it as a single status card: a severity indicator, the Insight name, and a recommended next step.
"Most impactful" means the Insight with the highest occurrence count across all your sessions. If two insights are tied on occurrence count, the one with the higher severity is shown.
The card leads with a severity headline, paired with a coloured status icon. The specific Insight is named, for example, "Issue in ISP's network" or "Issue on ISP's local loop," along with a suggested action, like opening a ticket with your ISP and sharing the report.
Seeing Where the Problem Is Located In Your Network
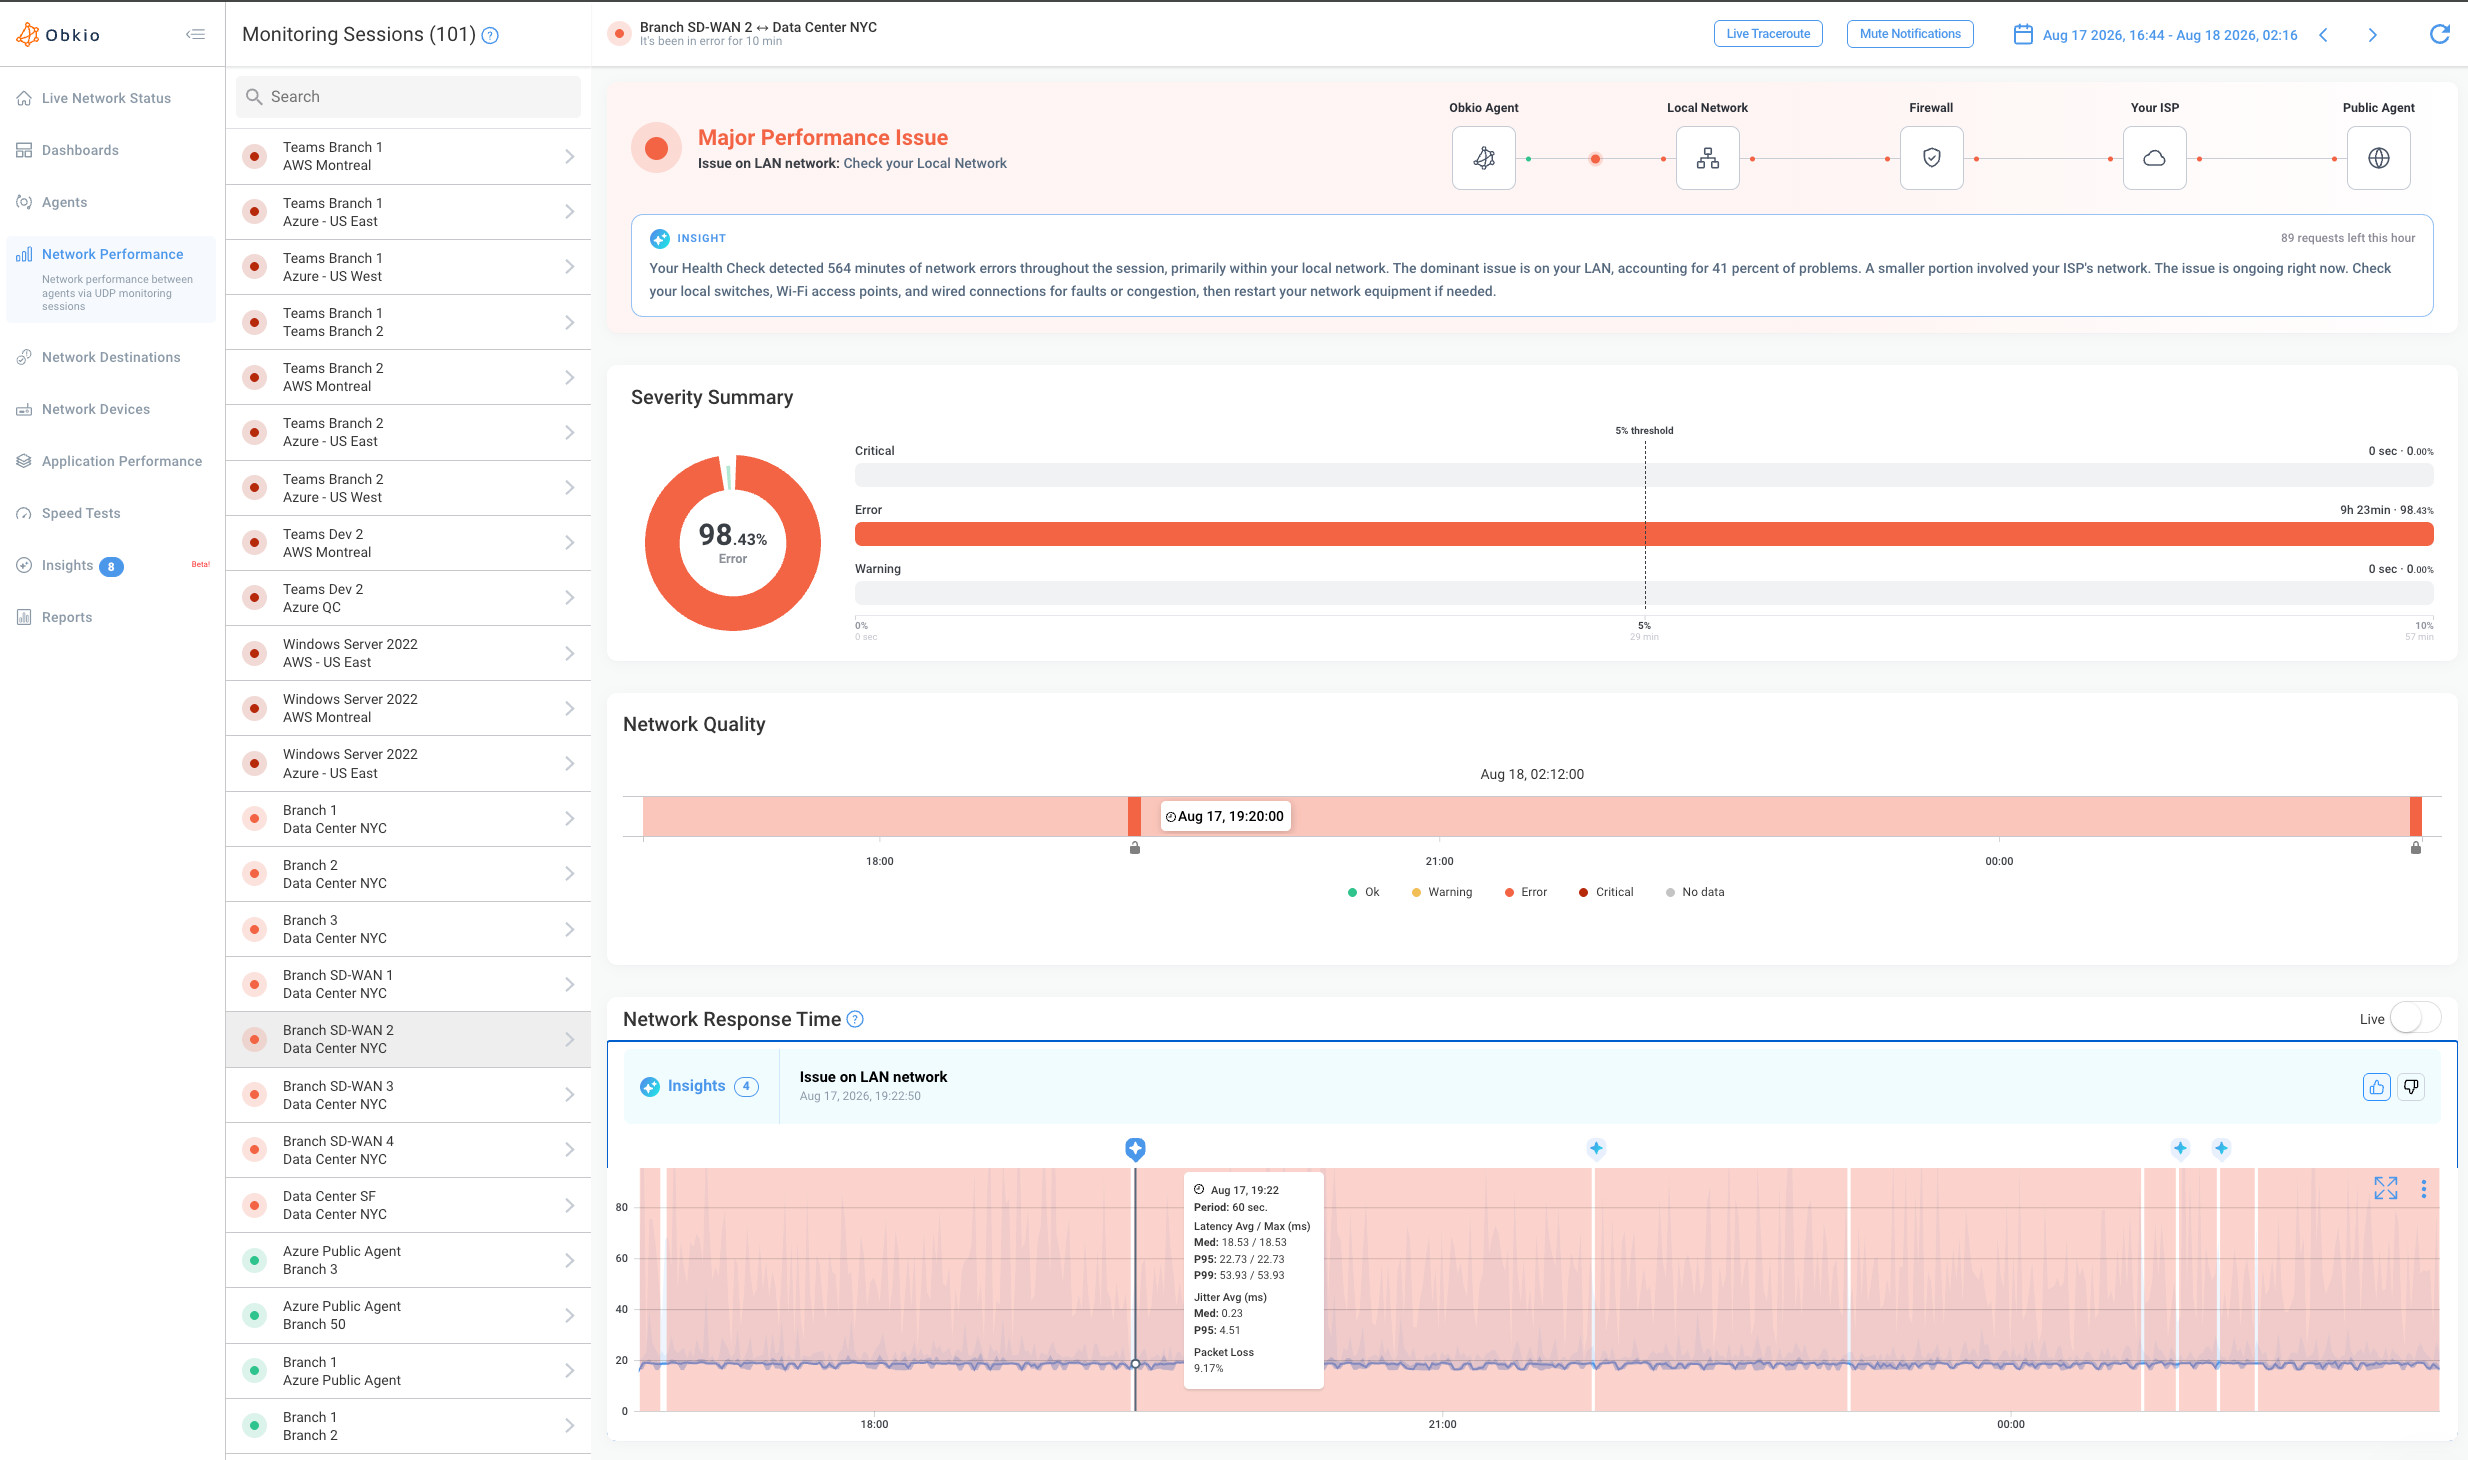
The status card itself already shows the full network path as a chain of segments, with the exact segment (either in your LAN or WAN) responsible for the issue that was flagged.
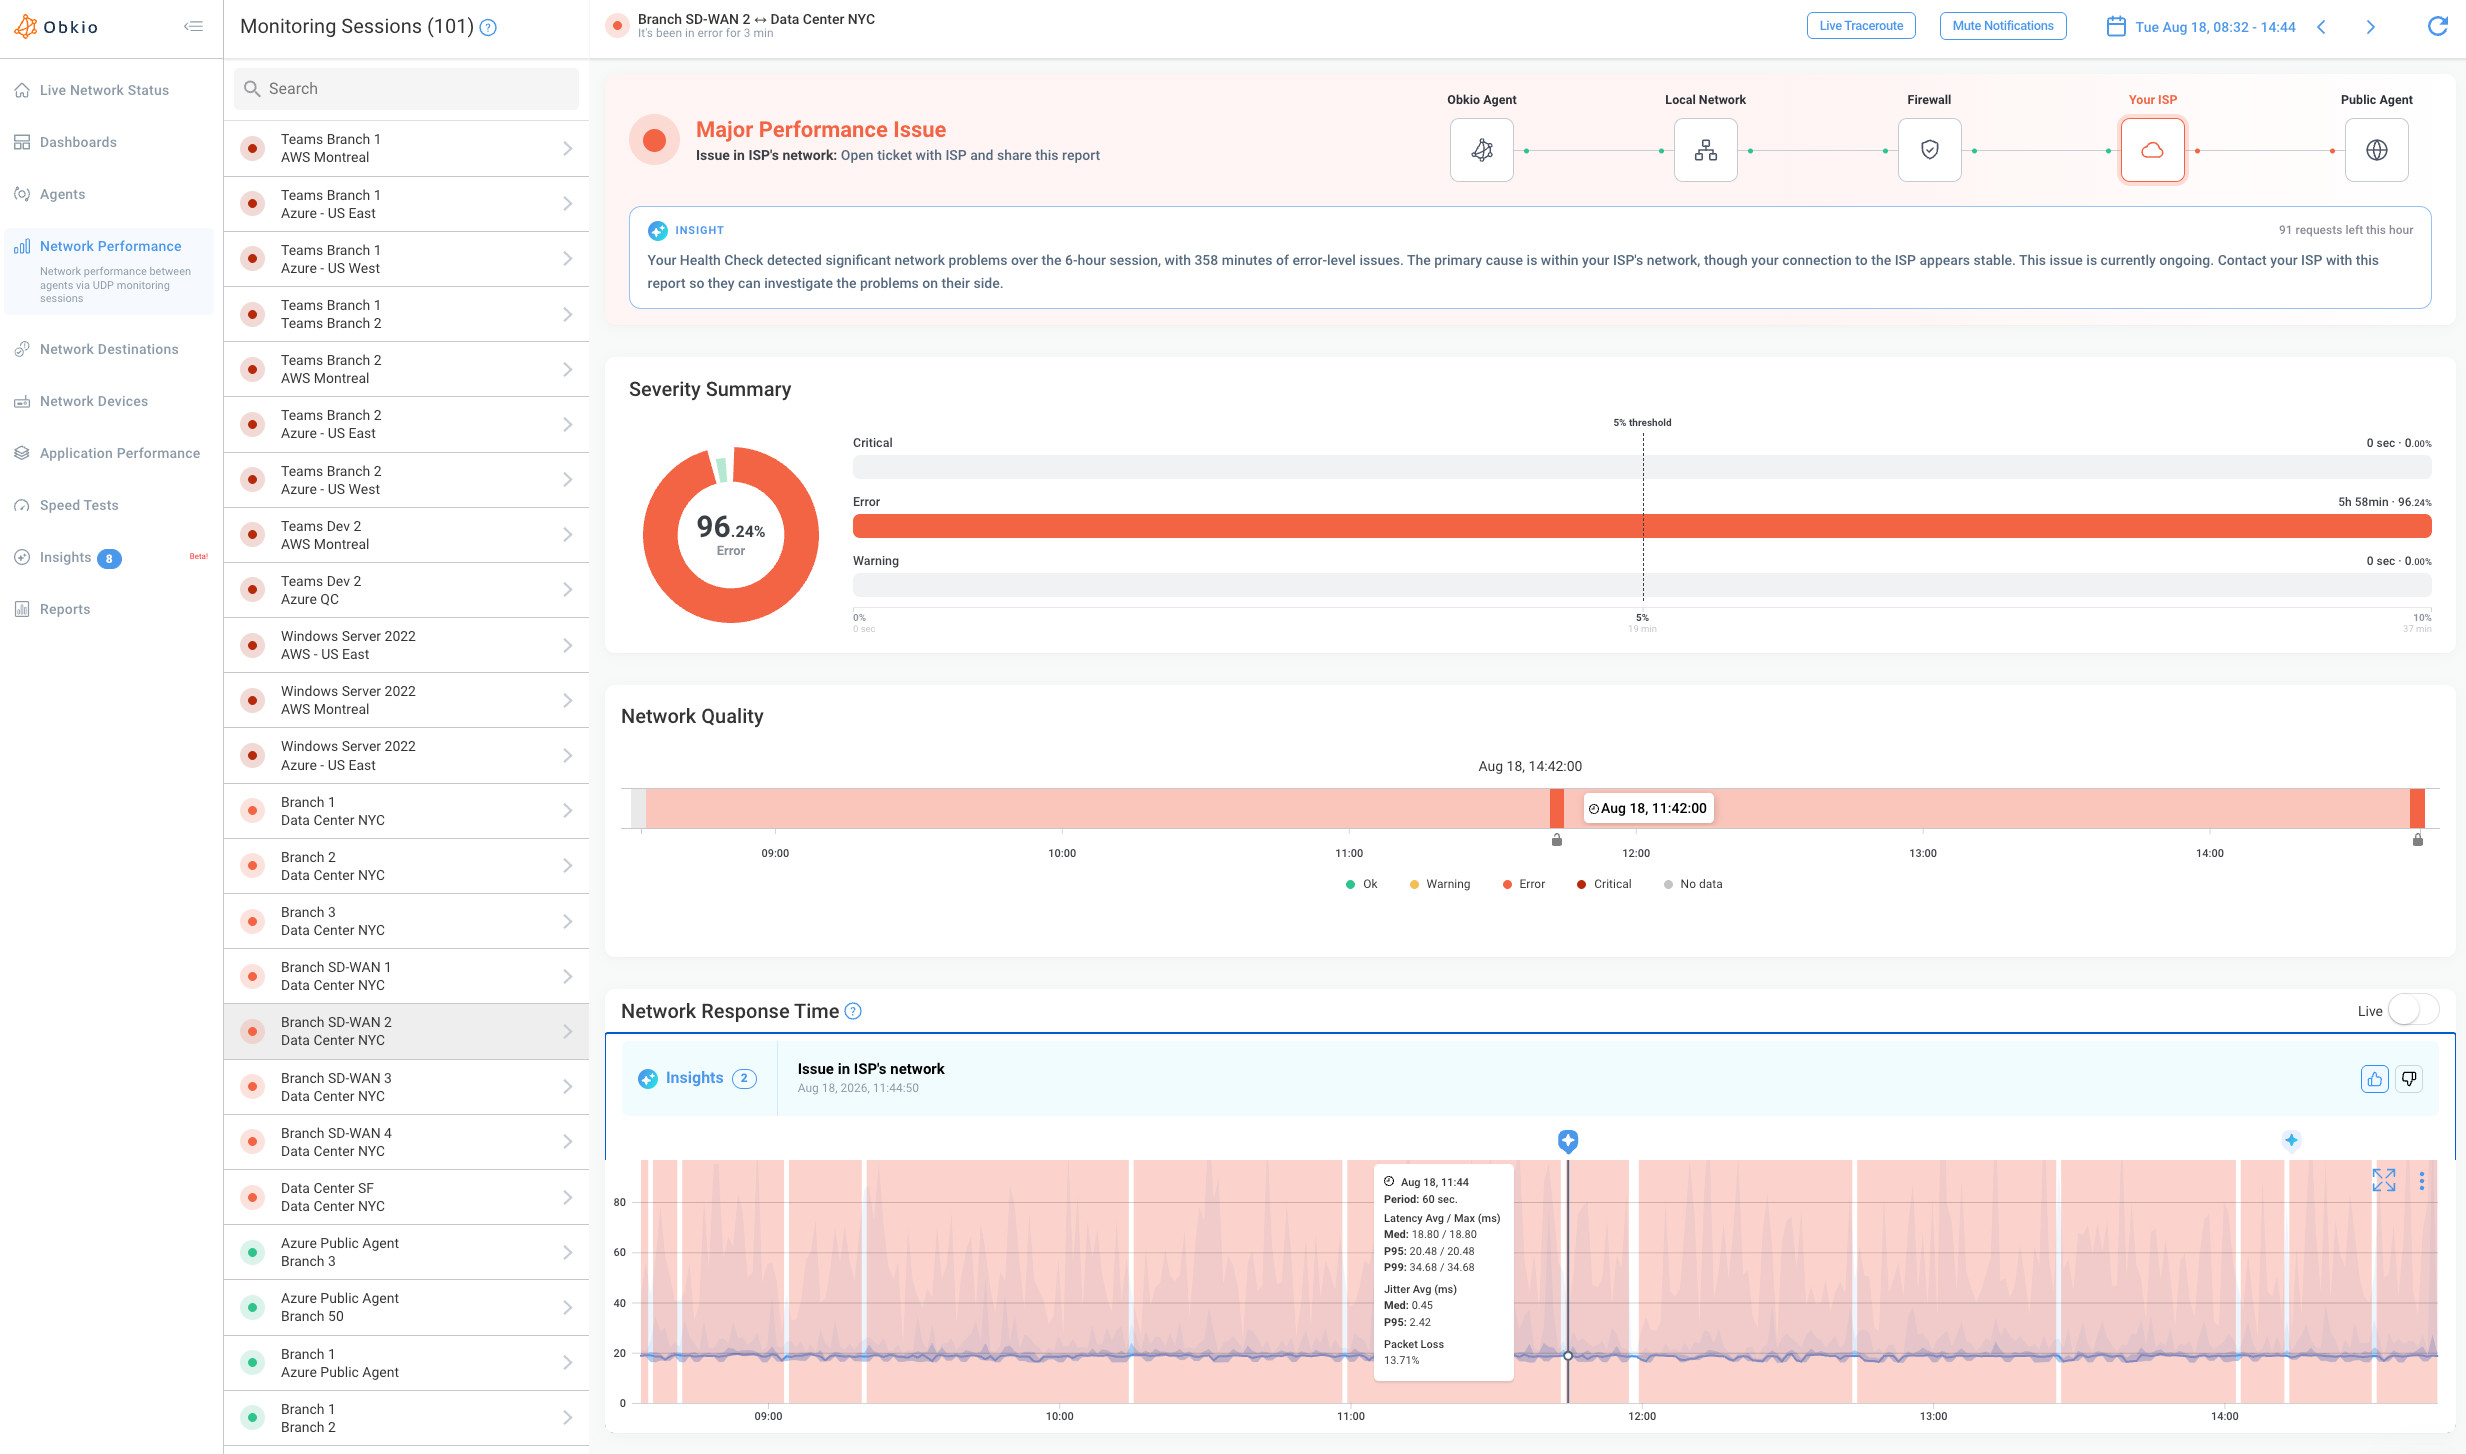
This is where Obkio's root cause logic becomes visible. The path is broken into five segments:
- Your Obkio Agent on one end
- Your Local Network
- Your Firewall
- Your ISP
- Obkio Public Agent on the other end
Each segment appears as its own node in a horizontal diagram, connected by dots that turn red to mark where the problem was localized. When the issue is tied to a specific segment, like your ISP's network, that node is also outlined to call it out directly. When the issue sits between two segments instead, like a problem on your ISP's local loop, the red marker appears on the connecting point between those two nodes rather than on either node itself.
Obkio pinpoints the responsible segment by cross-referencing synthetic traffic generated from Obkio’s Monitoring Agents with traceroute data, the same logic behind Obkio's Internet Path Issue Location. Underneath the path diagram, a table breaks down event counts by location, showing how much time and how many events were tied to a LAN issue, a firewall-to-ISP issue, or an ISP network issue.
What the AI Overview Tells You
Below the path diagram, an Insight box gives you an AI-written summary generated automatically from the same data driving the path diagram above it.
It explains how long the problem has persisted, whether it's isolated to one segment or showing up in more than one, and what's likely responsible. It closes with a suggested next step, like checking local hardware first before escalating to your ISP.
That turns the path diagram from a "here's where" into a "here's where, here's why, and here's what to do about it." For someone who isn't deep in network troubleshooting day to day, it's the difference between staring at a red dot and knowing what to actually go check.
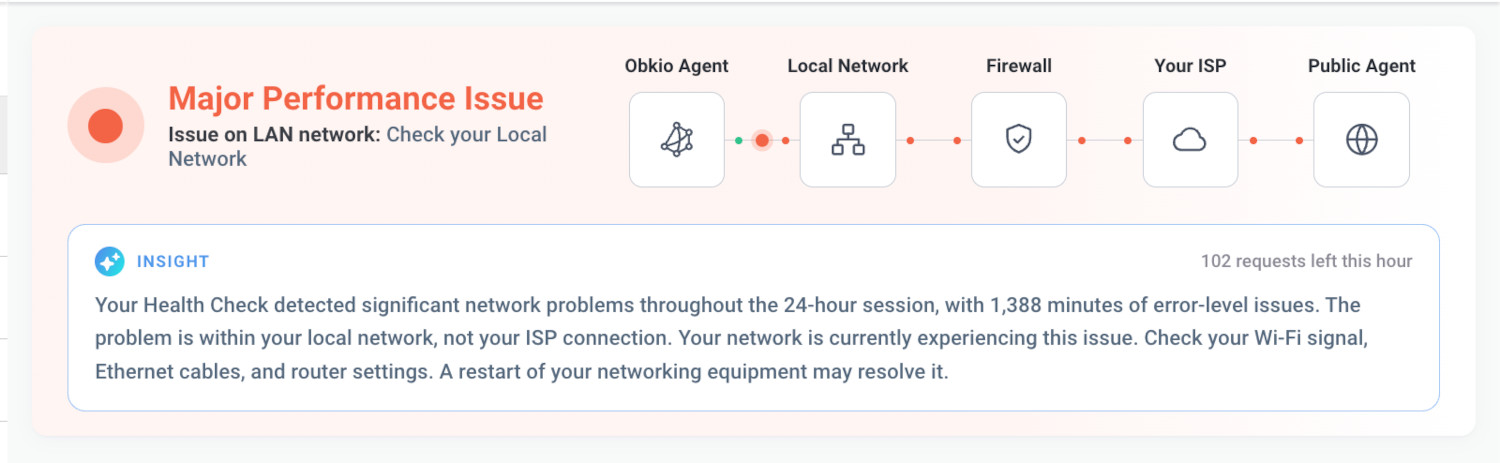
This text is AI-generated, so treat it as a helpful starting point rather than the final word. It can occasionally get a detail wrong. To keep it running efficiently, each Agent is limited to two AI-generated overviews per hour; once that limit's hit, the text won't refresh again until the hour resets. This limit only affects the summary text. Insight detection and the path diagram aren't affected.
How to Use Obkio’s Status Overview
On sessions with an active Insight
Go to the Network Performance tab and select any monitoring session between a local Agent and the Public Agent. If there's an active Insight for that session, the Status Overview widget is already there. Unlike Severity Summary and Network Quality Timeline, this one only appears when Insights has something to report.
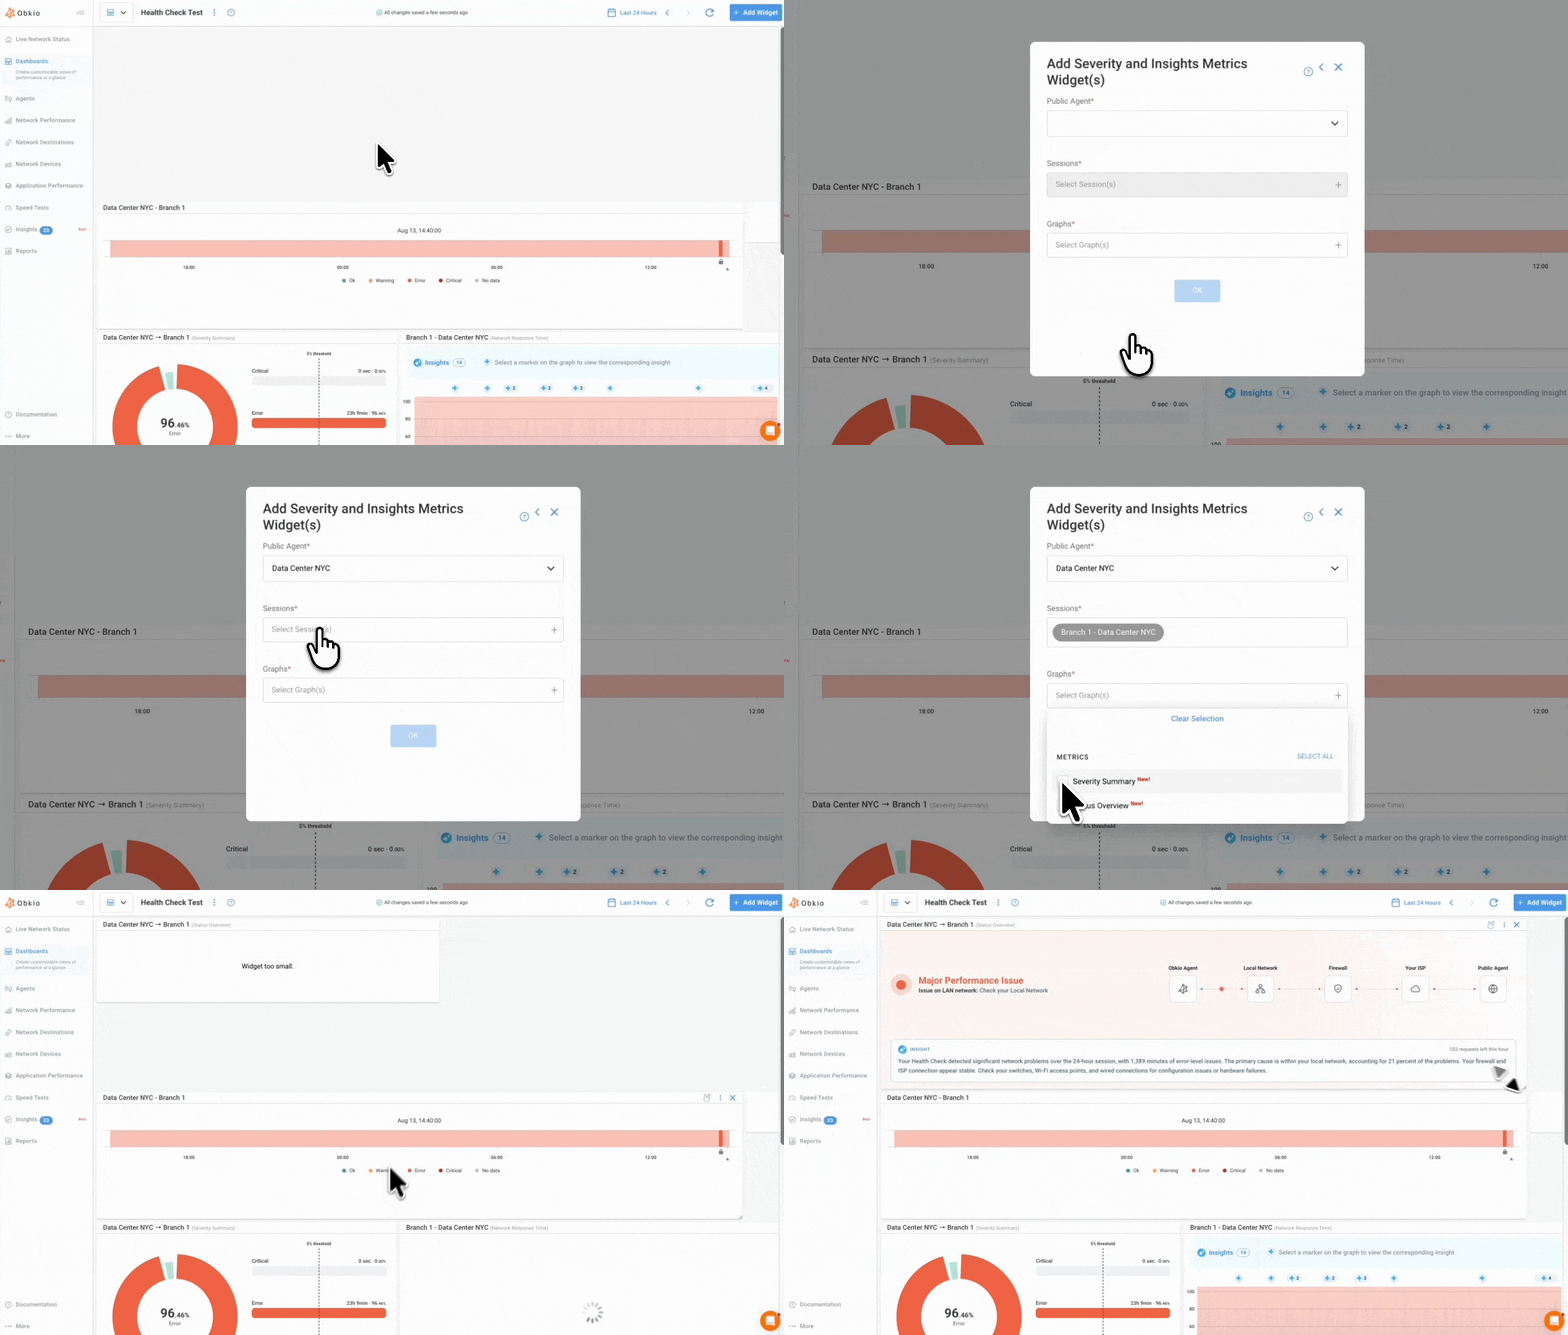
Added to a dashboard
- Select
Add Widget - Choose
Status Overview - Pick the Agent and monitoring session you want it to display
Why This Matters for Network Troubleshooting
Diagnosing a network issue usually means correlating multiple data sources: latency graphs, traceroute hops, device metrics, and alert history, then figuring out which segment of the path is actually responsible. Obkio's Insights engine already does that correlation in the background.
The Status Overview widget just puts the answer where you'll see it first, with a clear path to the evidence behind it if you need to dig deeper, and a written explanation so you're not left interpreting a diagram on your own.
For IT teams managing networks they can't monitor full time, that's the difference between spending twenty minutes confirming a suspicion and getting a straight answer the moment you open the Obkio app.
This widget is a direct output of Obkio Insights, Obkio's automatic network diagnostics engine. Instead of manually testing each hop in your network path to isolate an issue, Insights runs that diagnosis automatically and surfaces the result here. Turning what used to be hours of investigation into a single view.
Start free with Obkio and add the Status Overview widget to your dashboard.
We'd love your feedback and hope this improvement helps you understand the issues happening in your networks and where they happen.


