









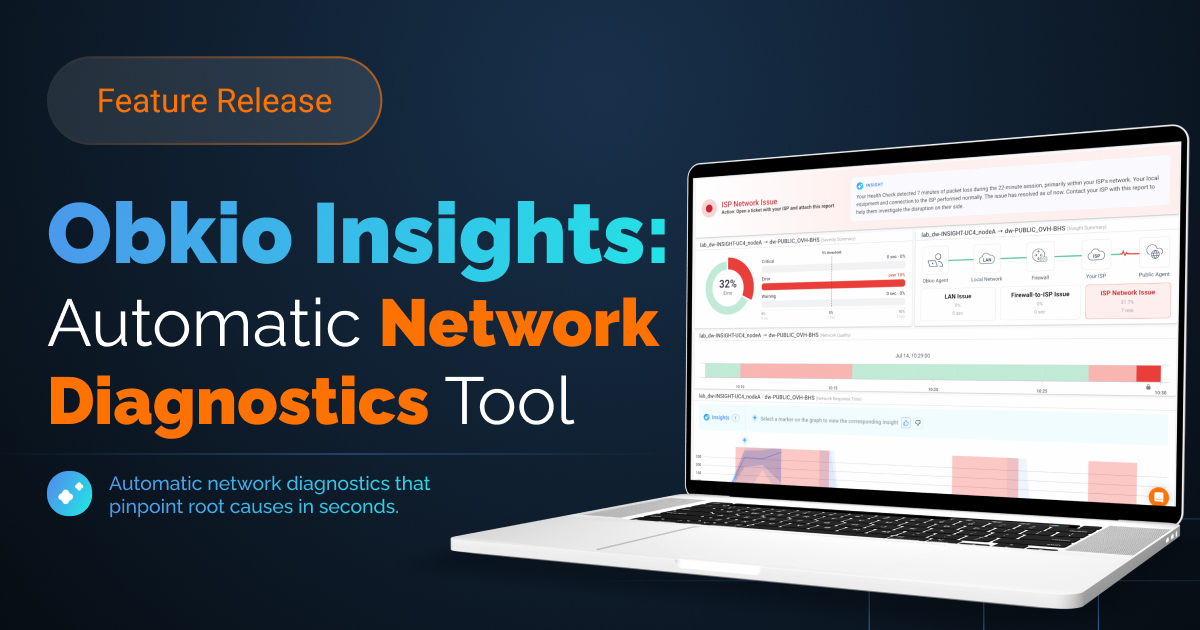


Obkio Insights: Automatic Network Diagnostics Tool
Stop troubleshooting manually. Start diagnosing automatically. Obkio Insights correlates all your monitoring data to pinpoint the root cause of network issues in seconds.


4.96 Average Rating (169 Reviews)





Introducing Obkio Insights:
Automatic Network Diagnostics
The network diagnostics tool, 8 years in the making.
For most IT teams, network troubleshooting is one of the most time-consuming, frustrating parts of the job.
When a network performance issue hits, diagnosing the root cause is a manual process that can be slow, complex, and overwhelming for anyone who isn't a dedicated network specialist. Alerts pile up. Data lives in silos. And by the time you've pieced everything together, the issue has already impacted your users.
Network monitoring tells you something is wrong. Obkio Insights tells you why.
Obkio Insights changes that. It's an automatic network diagnostics engine built directly into Obkio's network monitoring platform. The moment a network issue is detected, Insights goes to work; correlating data across your entire network to automatically diagnose the problem, identify the root cause, and tell you exactly who is responsible for fixing it. All in seconds.
What Is Obkio Insights?
Obkio Insights is an automatic network diagnostics engine that uses multi-source data correlation to identify the root cause of network issues automatically, the moment they're detected.
Built on our founders' 25 years of networking and troubleshooting expertise, and 8 years of foundational feature development at Obkio, Insights consolidates NPM, SNMP Device Monitoring, and Visual Traceroute performance data into one intelligent network diagnostic layer that works for you in the background.
When a network event, like packet loss, high latency, or jitter, is detected on a monitoring session, Insights doesn't just notify you, it automatically analyzes the surrounding data to identify the most likely root cause. The result is an Insight: a plain-language explanation of what caused the issue, displayed directly on the issue.
Insights based on traceroute analysis (LAN and ISP issues) work out of the box, with no configuration required. Device-related Insights (bandwidth, CPU, and memory) require SNMP Device Monitoring to be set up first, so Insights has the device data it needs to correlate against.

The Widgets That Bring Insights to Life
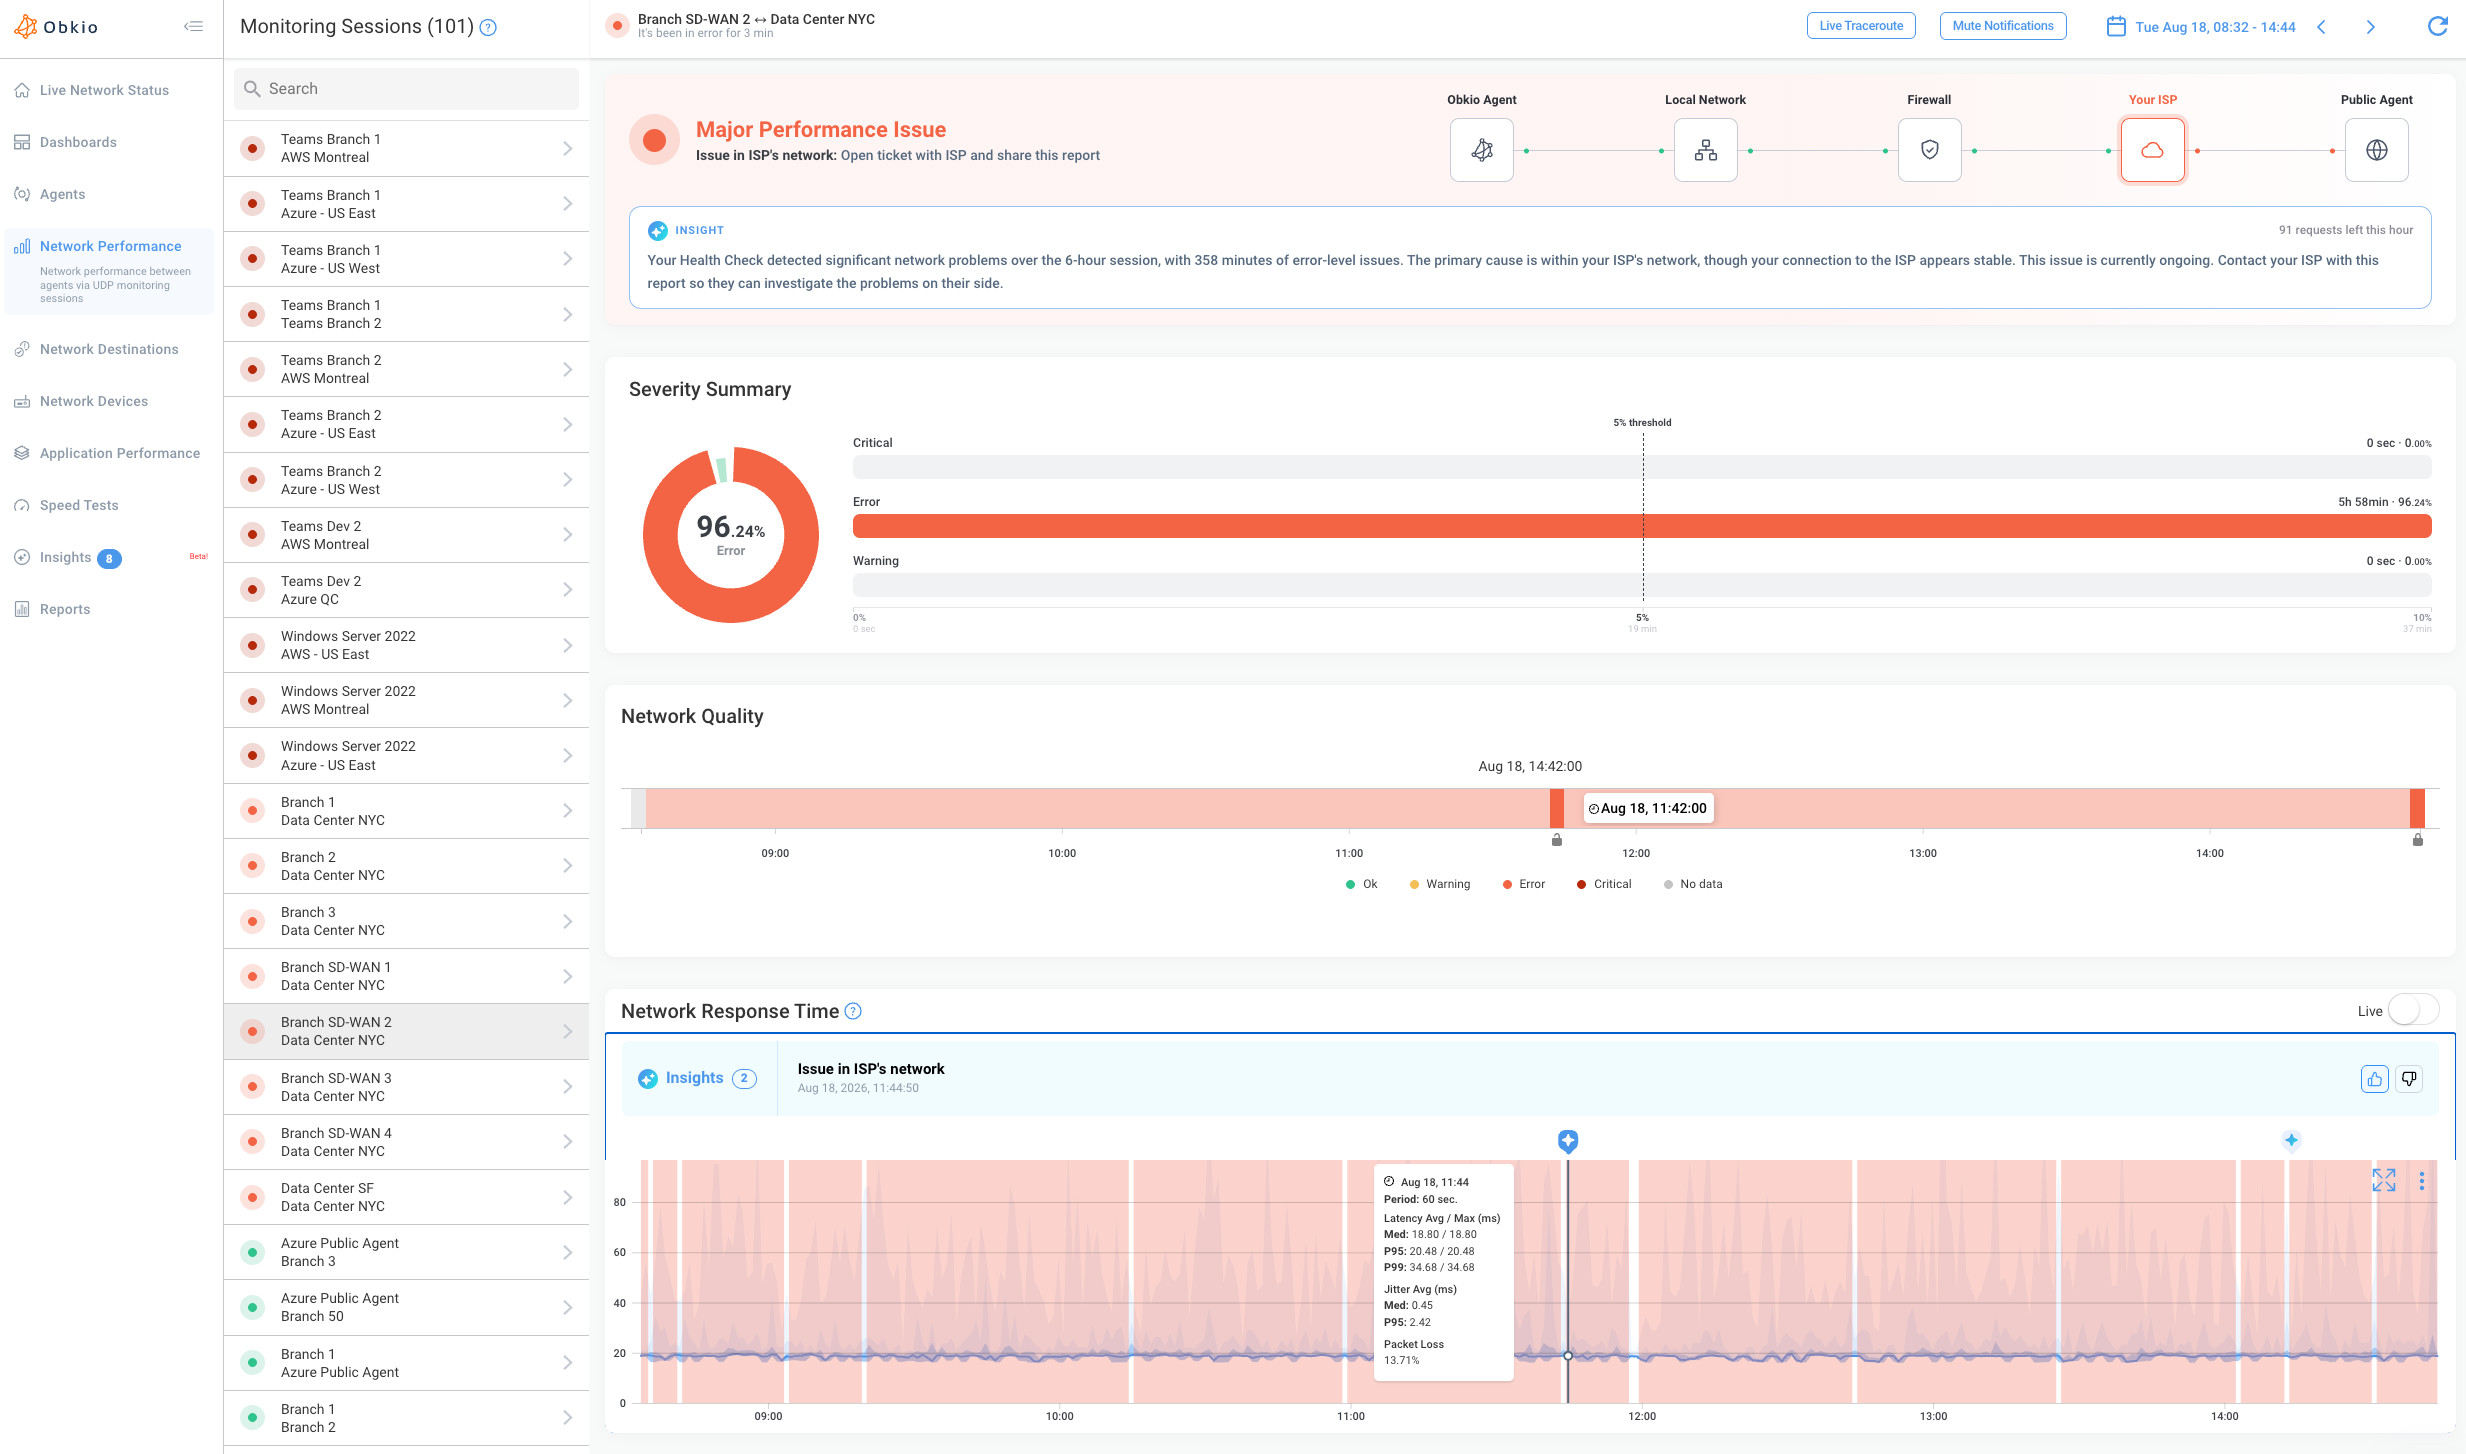
Status Overview surfaces the diagnosis itself; Severity Summary and Network Quality Timeline give you the surrounding context, on every session.
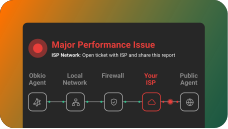
Status Overview
Maps the full network path and highlights the exact segment responsible for the most impactful issue detected.
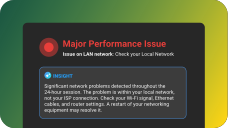
AI-Generated Summary
Automatically generated summary describing where the issue is occurring, the cause, and what steps you need to take.
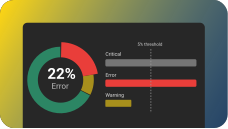
Severity Summary
Breaks down how much time a session spent in Warning, Error, and Critical states so you can gauge how serious an issue is.
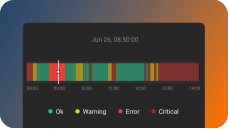
Network Quality Timeline
A colour-coded timeline of network health over a selected time range to easily spot when an issue occurred and jump to the diagnosis.
Network Monitoring vs. Network Diagnostics
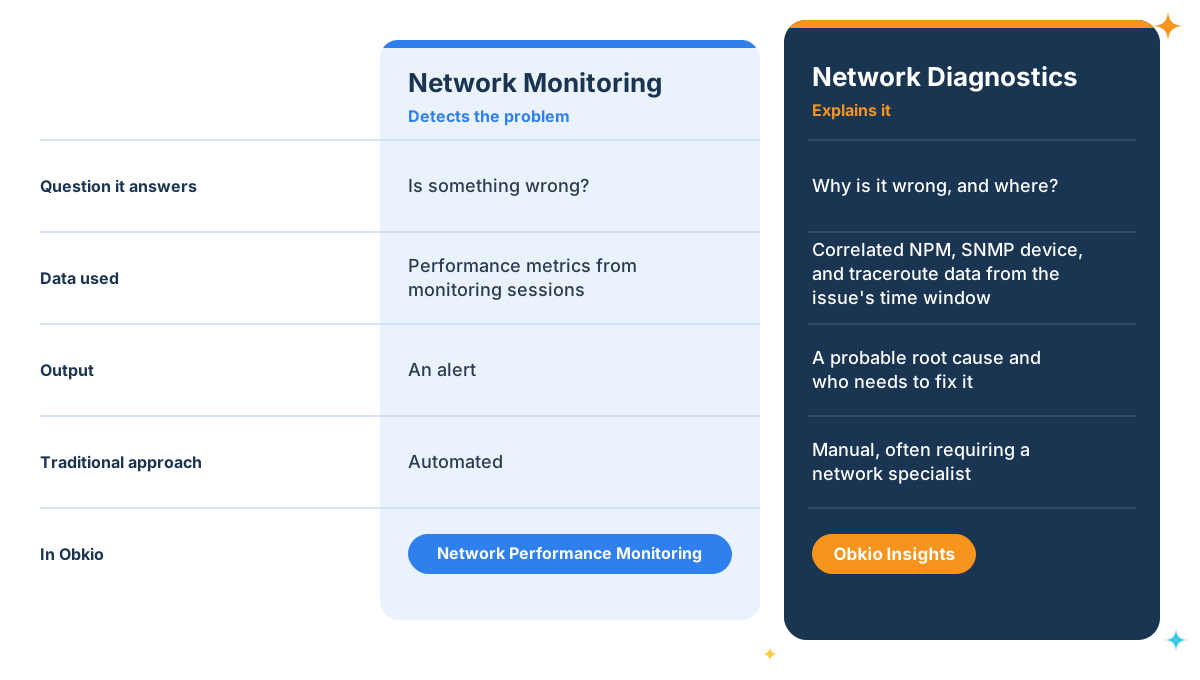
Monitoring detects the problem. Diagnostics explains it.
Network monitoring and network diagnostics are two separate steps in resolving a performance issue. Network monitoring continuously measures metrics like packet loss, latency, and jitter, and alerts you when performance degrades. Network diagnostics is the next step: determining why performance degraded, where in the network the cause sits, and who is responsible for fixing it.
Traditionally, monitoring is automated and diagnostics is manual. After an alert, someone has to pull device metrics, review traceroutes, and correlate everything against the time of the issue to find the cause. Obkio Insights automates that second step, so the diagnosis is already waiting when you open the issue.
Why IT Teams Need Automatic Network Diagnostics
Network troubleshooting is broken. Most IT professionals aren't dedicated network specialists; they're managing a long list of competing priorities, and when a network performance issue hits, troubleshooting is just one more thing on the list.
The problem isn't that IT teams don't care about network diagnosis. It's that the manual troubleshooting process requires correlating data across multiple sources, interpreting complex outputs, and connecting the dots between network performance, device health, routing paths, and application behaviour. That's time-consuming even for experts, and intimidating for everyone else.
Traditional network monitoring tools send alerts. But an alert without a diagnosis is just noise.
Obkio Insights was built to solve exactly that. It automates the network diagnostic process, the same correlation a senior network engineer would perform manually, and completes it in seconds.
Key Benefits of Automatic Network Diagnostics with Obkio Insights
Less time troubleshooting. More time fixing what matters.

Automatically Understand the Root Cause
Stop spending hours manually correlating network data. Insights automatically identifies the root cause of network issues in seconds, the moment a performance problem is detected.
Get Network Diagnostics From Many Sources
Insights correlates NPM, SNMP Device Monitoring, and Visual Traceroute data simultaneously. Every layer of your network is analyzed together for a complete and accurate network diagnosis.

Network Troubleshooting for Non-Experts
IT pros who aren't network specialists can now diagnose network issues with confidence, pinpointing whether the problem is internal, external, or with a specific device, and knowing exactly who needs to fix it.

Capture Diagnostic Data at the Time of the Issue
Insights captures and correlates diagnostic data automatically at the time of the issue. No more scrambling to recreate the conditions of a network problem after the fact.

One-Click Network Diagnostic Dashboards
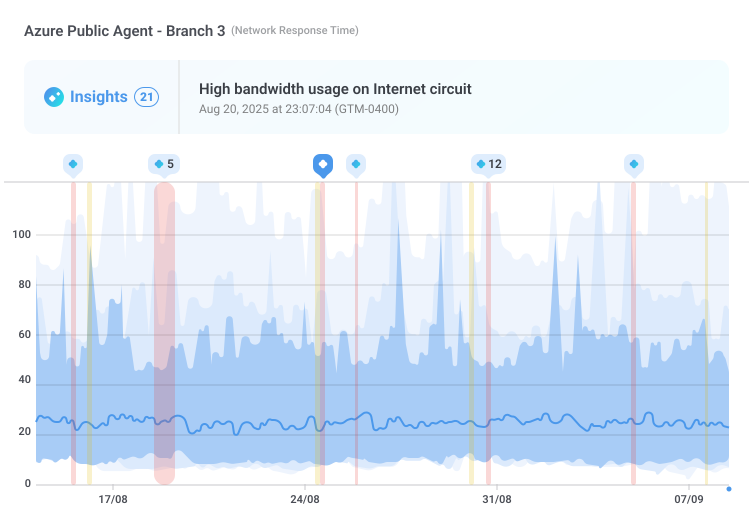
Every diagnosis comes with a generated dashboard showing correlated data and highlighted root cause sources. Insights also appear as markers on your network graphs, right at the moment the event occurred.
How Obkio's Automatic Network Diagnostics Works
Automated network troubleshooting from day one, with traceroute-based Insights working out of the box.

A Network Issue Is Detected
Obkio's Network Performance Monitoring feature detects a network performance issue and triggers an alert.

Automatic Network Diagnosis Begins
The correlation engine immediately analyzes all monitoring data from the same time window.

Get a Diagnosis, Not Just an Alert
A probable root cause is automatically identified, generating an Insight in the Insights tab or right on your network graphs.

Drill Into the Diagnostic Evidence With One Click
Open an automatically generated dashboard showing all the correlated data behind the diagnosis.



Detect Network Issues in Seconds With Network Performance Monitoring Features
Everything starts from Obkio's core Network Performance Monitoring feature. Obkio continuously monitors your network in real-time, measuring key metrics like packet loss, latency, jitter, and bandwidth across all your monitoring sessions.
The moment a session detects a network performance issue, like a spike in packet loss or a sudden jump in latency, an alert is triggered and Insights' automatic network diagnostic engine immediately goes to work.
No manual action needed. Insights is always running in the background, ready to diagnose the moment something goes wrong.
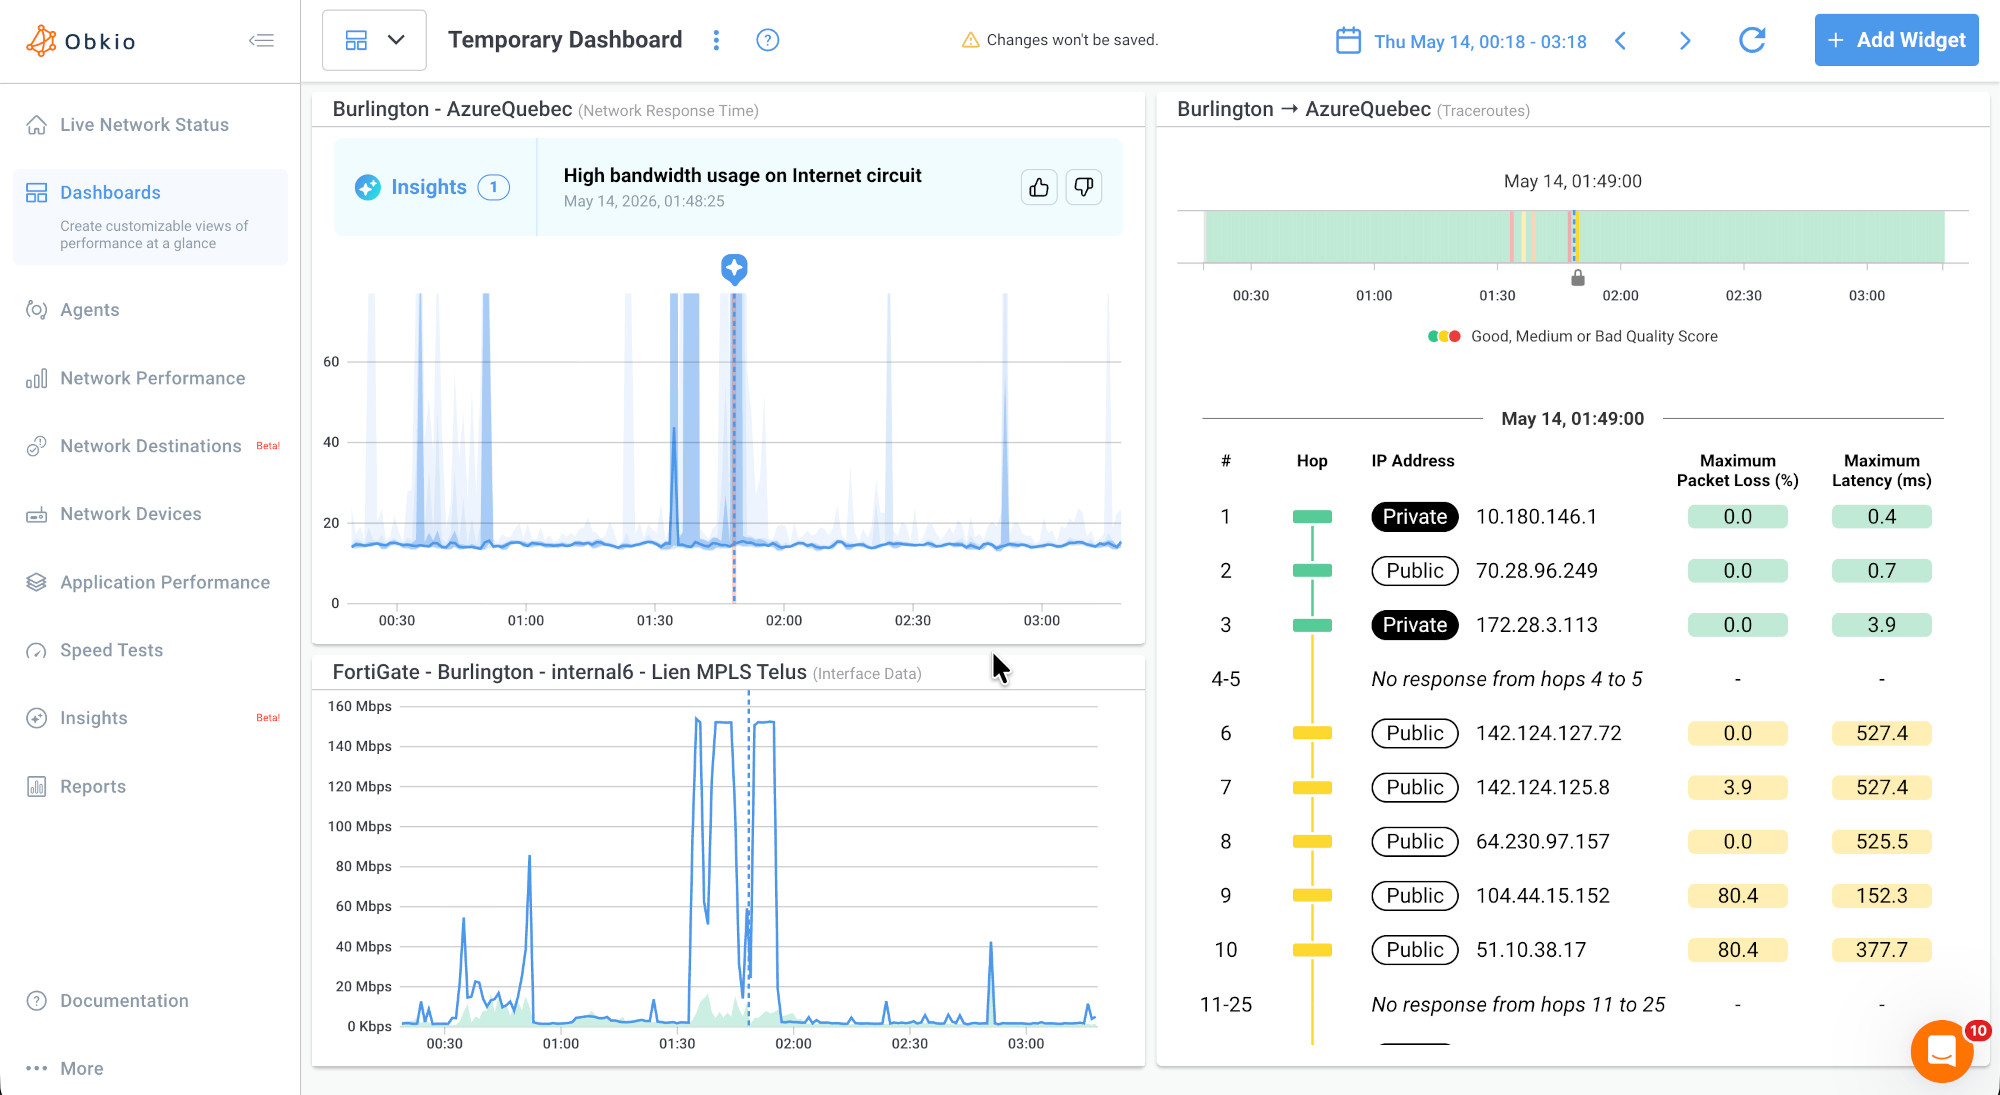


Begin Automatic Network Diagnosis to Automatically Correlate and Analyze Data
In the background, Insights' correlation engine analyzes all available monitoring data from the same time window; the same network troubleshooting process a senior network engineer would follow manually, completed in seconds.
Checks for false positives: Insights first verifies whether the Monitoring Agent had all the resources it needed to run its tests properly. If not, the issue is flagged as user-side immediately, saving your team from chasing a network problem that isn't really there.
Diagnoses network device performance: Insights examines CPU, memory, and bandwidth usage across your network devices to identify congestion or resource constraints that may be preventing equipment from processing traffic in real-time — and pinpoints the specific device responsible.
Correlates traceroute data for network path diagnosis: Insights cross-references traceroute data from the same time period to identify latency, packet loss, or jitter between IP addresses, and surfaces the exact hops affected along the network path.


Get A Network Diagnosis That Identifies the Root Cause of Issues For You
In the past, Obkio would send an alert notifying you of a network issue like packet loss, and from there, the troubleshooting was on you.
With Insights, the investigation is already done by the time you open the issue. Each one comes with a probable root cause, clearly identified: whether it's a congested device, an ISP routing issue, or a problem at a specific hop along the network path.
Your team gets the answer, not just the alarm, allowing them to act immediately, escalate with confidence, or open a support ticket with proof in hand.
What Issues Obkio Insights Diagnoses Today
At launch, Obkio Insights automatically identifies the following root causes of network performance issues, with more on the way:
Issue on ISP’s local loop / Firewall
Without Device Monitoring configured, this shows as a combined "firewall or ISP local loop" result. Pair a device to isolate exactly which one it is.

Issue in ISP’s network
The degradation is occurring deeper inside your ISP’s infrastructure, beyond the local loop. This gives your team evidence to open a support ticket or escalate with your provider.

Issue on LAN network
The problem is within your local network rather than with your ISP or Internet circuit. Rule out external factors to focus troubleshooting on internal infrastructure: switches, access points, or local routing.
Firewall performance issue
Your firewall is under resource strain and can't process traffic fast enough. With Device Monitoring configured, Insights pinpoints the specific cause: high bandwidth usage, high CPU usage, or high memory usage.
Unlock precise firewall diagnostics
Insights already tells you when a problem is on your firewall or ISP's local loop. Add Device Monitoring and Insights separates the two, and identifies whether a firewall issue is caused by high bandwidth, CPU, or memory usage.


Drill Into the Diagnostic Evidence With Dashboards Highlighting the Cause of Issues
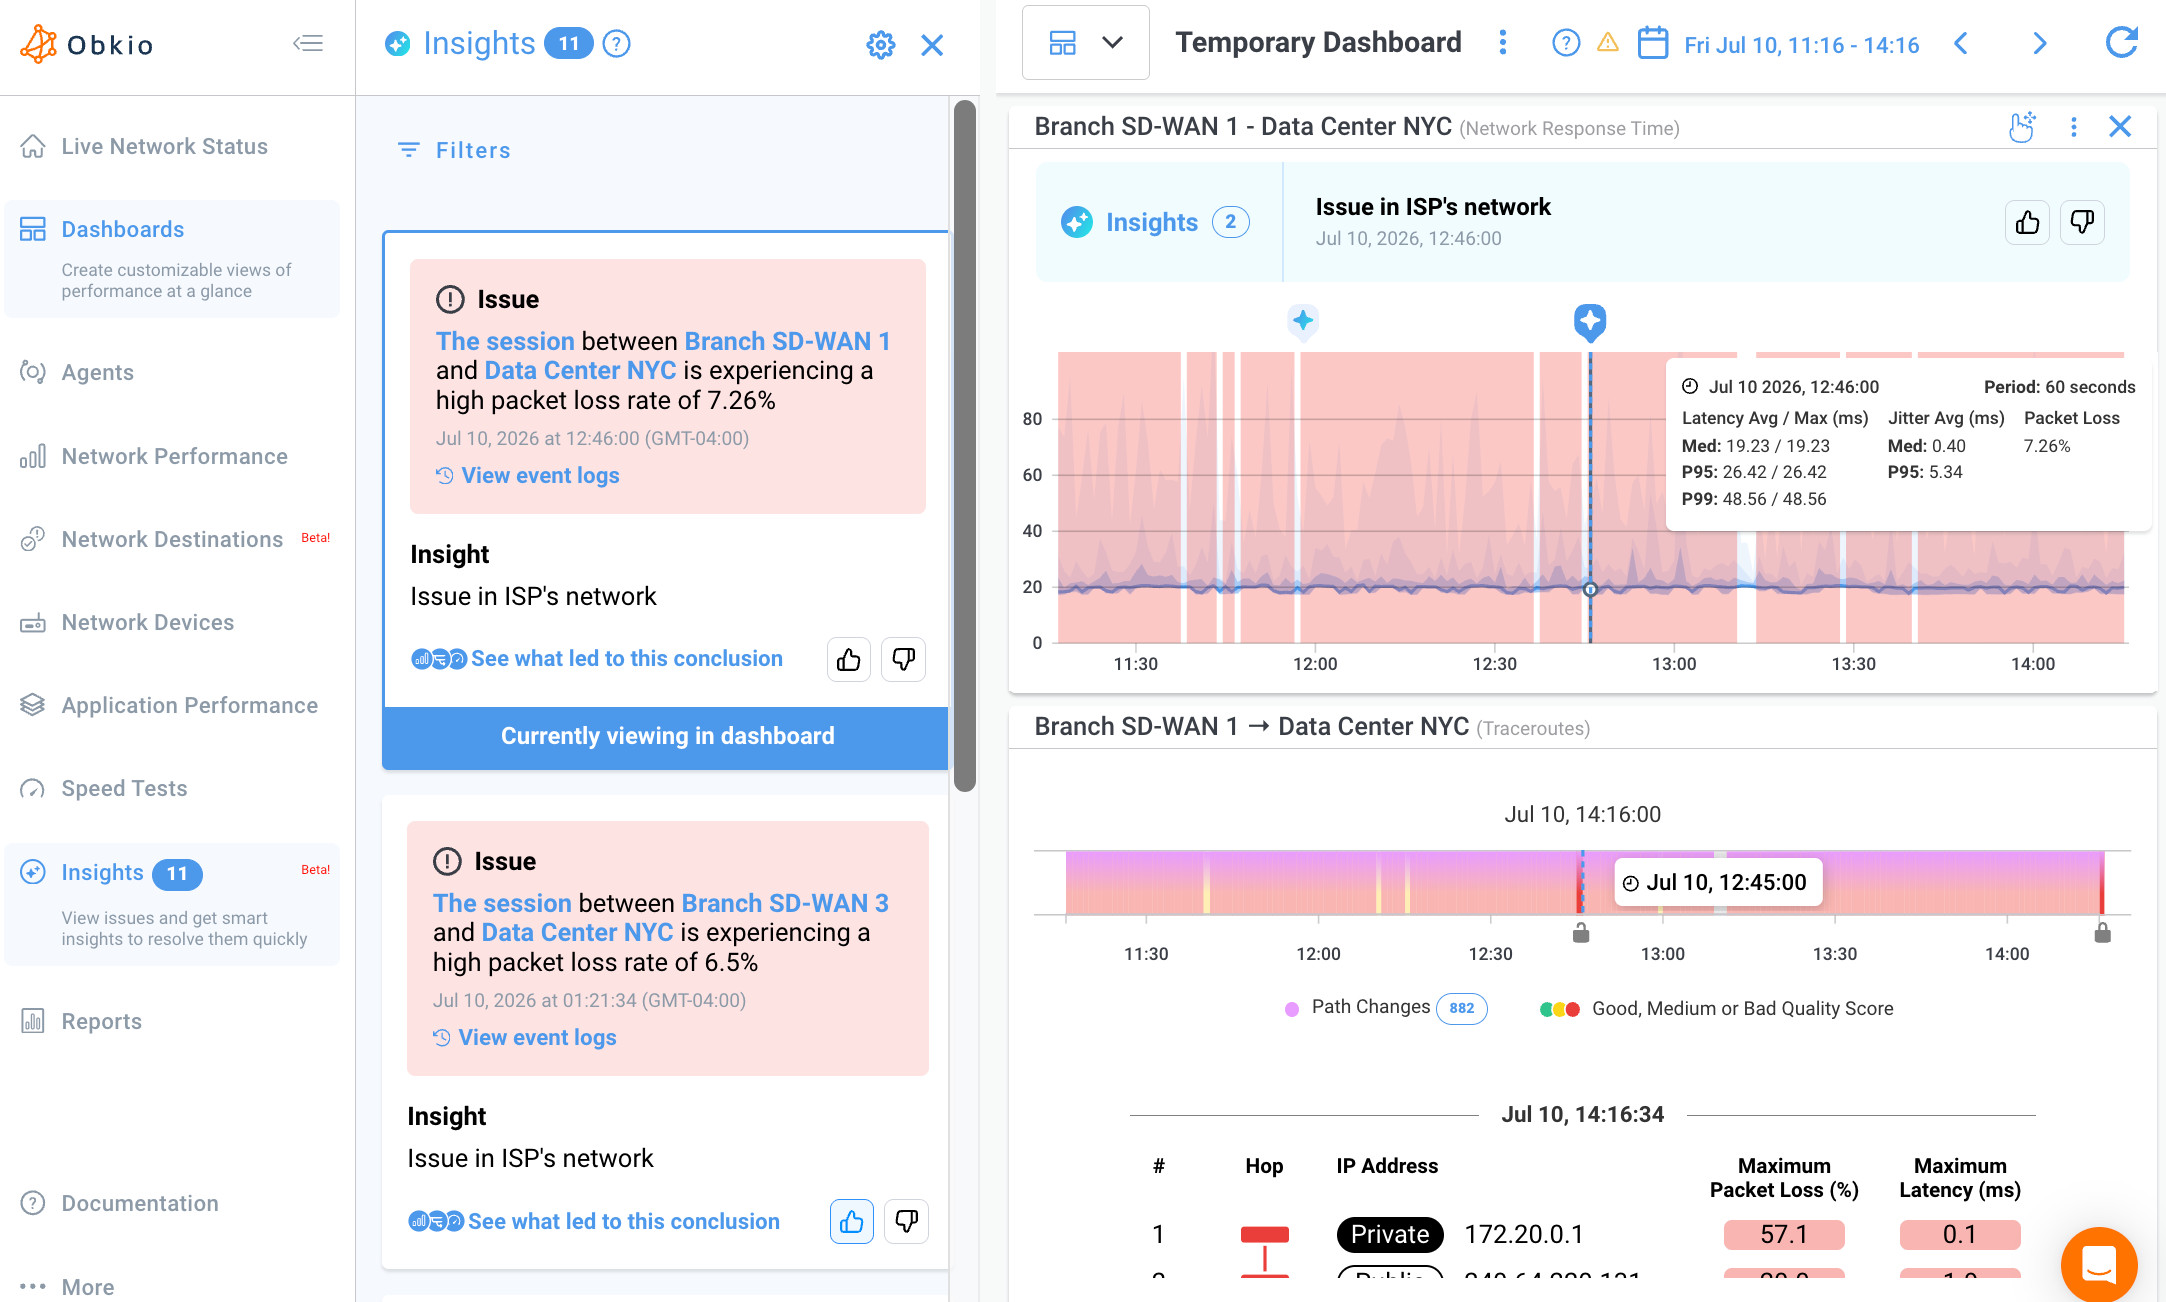
Every Insight is displayed directly on the issue it explains, and listed in the Insights tab. From there, clicking "See what led to this conclusion" opens an automatically generated network diagnostic dashboard displaying all the metrics collected during the issue's timeframe.
The dashboard brings together NPM performance data, SNMP device metrics, and traceroute path data, all correlated and visualized side-by-side for the exact period of the detected issue. The root cause is highlighted directly on the graph via the Insights marker, marking the moment the event occurred, so you can follow the reasoning step by step and see exactly what triggered the diagnosis.
No digging, no switching between tools, no piecing together data manually. Everything you need to understand, explain, and resolve the network issue is in one place.
Who Is Obkio Insights' Automatic Network Diagnostics Tool For?
Built to help IT pros troubleshoot faster, and non-experts prove their issues exist.
IT Generalists & Network Engineers
Whether you're the only IT person in the room or a seasoned network engineer, Insights does the heavy lifting. Skip manual data correlation and get straight to the root cause, with full diagnostic evidence ready when you need to dig deeper or challenge your ISP.
MSPs & IT Managers / Leadership
Empower your entire team to diagnose issues that once required your most senior engineers, end the blame game with clients, and hold ISPs accountable. Insights gives leadership the diagnostic reports needed to justify infrastructure investments and show the direct impact of network performance on business productivity.

How to Get Started With Insights: Automatic Network Diagnostics
Automatic network diagnostics from day one. Obkio monitors, analyzes and troubleshoots issues for you.
Start Your Free Obkio Trial: Sign up and follow the onboarding wizard to deploy your Monitoring Agents and create your first Monitoring Sessions.
Deploy Your Network Monitoring Agents: Add Monitoring Agents across your network locations. These collect the performance, device, and path data that Insights needs to run automatic network diagnostics.
Get Traceroute-Based Insights: These work right out of the box, with no configuration needed. As soon as Insights is enabled, it analyzes traceroute data automatically to detect and diagnose LAN and ISP issues.
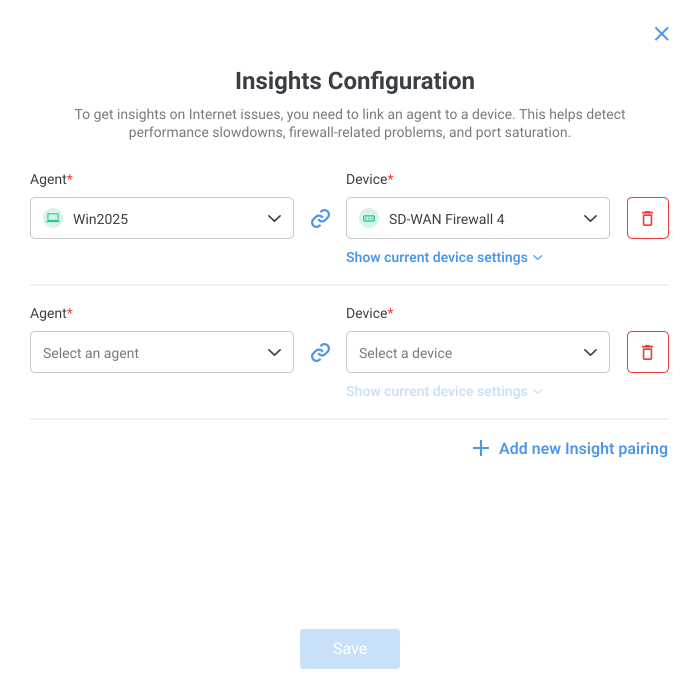
Configure Device-Based Insights: To enable Insights for High Bandwidth, CPU, and Memory issues, Obkio needs some context about your network first:
- Monitor your firewalls and routers with Network Device Monitoring.
- Open the "Insights" tab, click the settings icon to open the Insights Configuration window, and select the Agent and network device pairing.
- Click "Show current device settings" to expand the device's configuration, then set the Internet-facing interface's maximum download and upload speeds, so Insights can detect when the connection is saturated.
Once this is in place, click "Done." These Insights will run automatically in the background, ready to deliver root cause analysis the moment a performance problem is detected.
Talk With Our Network Pros
Have any questions about Insights? Let's talk!
Frequently Asked Questions


Automatic network diagnostics is the process of identifying the root cause of a network performance issue without manual investigation. Instead of requiring a network engineer to manually correlate data across multiple sources, an automatic diagnostics engine like Obkio Insights does this work instantly, analyzing NPM, SNMP, and traceroute data simultaneously to pinpoint root causes the moment an issue is detected.
Obkio Insights is Obkio's automatic network diagnostics engine. When a network issue is detected, Insights automatically correlates data across NPM, SNMP Device Monitoring, and Visual Traceroutes to identify the root cause.
Standard network monitoring alerts tell you something is wrong. Obkio Insights tells you why. When a network issue is detected, Insights automatically runs a full network diagnosis and displays a probable root cause directly on the issue, along with a one-click diagnostic dashboard showing all the correlated evidence.
Network diagnostics identifies the cause of a performance issue: what went wrong, where in the network it happened, and who is responsible for fixing it. Network troubleshooting is the broader process of resolving the issue. It includes the diagnosis, then the fix itself, whether that's reconfiguring a device, upgrading a circuit, or escalating to your ISP. Obkio Insights automates the diagnosis step, so troubleshooting starts from a probable root cause instead of a raw alert.
Network root cause analysis is the process of tracing a performance issue, like packet loss, latency, or jitter, back to its source. Done manually, it means correlating performance metrics, device health, and traceroute data from the time of the issue, then ruling out possible causes one by one. Obkio Insights automates network root cause analysis. It correlates NPM, SNMP Device Monitoring, and Visual Traceroute data from the issue's time window and displays the probable root cause directly on the issue.
Not at all. Obkio Insights was specifically designed for IT professionals who aren't dedicated network specialists. It automates the complex network diagnosis process so any IT team member can understand what's wrong, where the network issue happened, and who needs to fix it.
Insights correlates data from Obkio's Network Performance Monitoring (NPM), SNMP Device Monitoring, and Visual Traceroutes performance data, all analyzed together from the time of the detected network issue.
Yes. Using traceroute data, Insights determines whether an issue is on your LAN, on your ISP's local loop, or deeper in your ISP's network. When the cause is on the ISP side, the diagnostic dashboard gives you the correlated data from the time of the issue, which you can attach to a support ticket or escalation. Without Device Monitoring configured, firewall and ISP local loop issues show as a combined result. Adding Device Monitoring separates the two.
Yes. When traceroute analysis shows that degradation is occurring within your local network rather than on your ISP's side, Insights identifies it as an issue on the LAN. LAN diagnostics work out of the box with no configuration. They let you focus troubleshooting on internal infrastructure like switches, access points, and local routing.
Insights currently covers Internet connectivity diagnostics and network troubleshooting, with VPN, SD-WAN, Microsoft Teams, and more use cases being added in the coming months.
Network Diagnostics & Troubleshooting
Resources
Guides, how-tos, and feature updates on network diagnostics and troubleshooting. Learn how to find the root cause of performance issues like packet loss, latency, and jitter, and how Obkio Insights automates the process.





Start Your Free 14-Day Trial Now!
Get a free POC with Obkio's 14-day trial. Identify network problems & collect data to troubleshoot.
Start Now Book a Demo