Table of Contents
Table of Contents
Network observability may be seen as a newer term in the world of networking, but it has become critical for managing modern distributed networks. As networks grow more complex with cloud services, remote workers, and distributed applications, traditional network monitoring approaches no longer provide sufficient visibility into network health and performance.
Network observability provides comprehensive real-time insights into network behaviour by collecting and analyzing telemetry data from routers, switches, firewalls, servers, and applications. Unlike traditional network monitoring that tracks predefined metrics against thresholds, observability delivers contextual understanding and enables proactive troubleshooting across your entire infrastructure.
This guide explains what network observability is, how it differs from network monitoring, and how to implement it effectively for your business' network. You'll learn:
- Core concepts and key differences between observability and monitoring
- Essential techniques and tools for network observability
- Best practices for implementation and deployment
- Real-world benefits for network performance and reliability
- When to use network observability versus traditional network monitoring
Whether you're a network administrator troubleshooting performance issues, an IT manager planning infrastructure upgrades, or an engineer optimizing distributed systems, this guide provides actionable strategies for leveraging network observability to maintain a reliable, high-performing network environment.
Network observability provides comprehensive real-time insights into network behavior, performance, and health by collecting and analyzing telemetry data from routers, switches, firewalls, servers, and applications. Unlike traditional monitoring that tracks specific metrics, observability offers contextual understanding and root cause analysis across distributed networks.
In essence, network observability involves collecting and analyzing vast amounts of telemetry data from various sources within the network, including routers, switches, firewalls, servers, and applications. This data is then processed, correlated, and visualized to provide meaningful insights into the network's functioning.
The business case for network observability is compelling. Network downtime costs businesses an average of $5,600 per minute, according to Gartner, translating to over $300,000 per hour for enterprise organizations. Organizations implementing observability reduce mean time to resolution (MTTR) by 65-75% compared to traditional monitoring approaches, while Forrester predicts that 78% of enterprises will adopt network observability platforms by 2026 to manage increasingly complex distributed infrastructures
One of the key aspects of network observability is its focus on capturing fine-grained details and contextual information about network events. It allows network administrators and engineers to delve deep into the inner workings of the network, for uncovering the root causes of performance issues.
Let’s look at some of the key concepts of network observability more in detail:
- Telemetry Data Collection: Network observability relies on the collection of extensive telemetry data from various network devices and components. This includes information such as network traffic, packet-level details, performance metrics, logs, and other relevant data sources.
- Real-time Visibility: Network observability emphasizes real-time visibility into network operations. It involves monitoring and analyzing data in near real-time, allowing for proactive identification of anomalies, performance issues, and security threats.
- Contextual Understanding: Network observability goes beyond raw data collection by providing contextual understanding. It involves correlating data from different sources to create a holistic view of network behaviour, enabling administrators to identify the root causes of issues and make informed decisions.
- Monitoring at Scale: Network observability accommodates the challenges of monitoring large-scale, complex networks. It enables efficient data collection, aggregation, and analysis across distributed network environments, ensuring comprehensive coverage without overwhelming the monitoring infrastructure.
- Data Analysis and Visualization: Network observability leverages advanced analytics techniques and visualization tools to process and interpret the collected data effectively. This enables administrators to derive meaningful insights, identify patterns, and visualize network behaviour for easier interpretation and decision-making.
- Proactive Incident Response: By providing real-time insights and contextual understanding, network observability supports proactive incident response. It allows for the early detection of issues and enables administrators to take immediate action, minimizing the impact of disruptions and improving overall network resilience.
- Automation and Intelligence: Network observability embraces automation and intelligent capabilities to streamline monitoring and analysis processes. Machine learning algorithms and AI-powered techniques can be employed to automate anomaly detection, identify patterns, and provide actionable recommendations for network optimization.
- Collaboration and Integration: Network observability promotes collaboration between different teams and departments involved in network management. It encourages the integration of observability data with other IT operations and management systems, such as network configuration tools, security systems, and service management platforms. In fact, an effective IT service management platform plays a key role in bringing these elements together, ensuring seamless coordination and improved operational efficiency.
By embracing these key concepts, organizations can achieve a comprehensive understanding of their network infrastructure, ensuring optimal performance, efficient troubleshooting, and proactive management. Network observability empowers administrators to make data-driven decisions and maintain a robust network environment in today's increasingly complex and dynamic networking landscape.
Learn about network performance monitoring to optimize network performance. Discover key network metrics, tools & techniques & the benefits for businesses.
Learn more

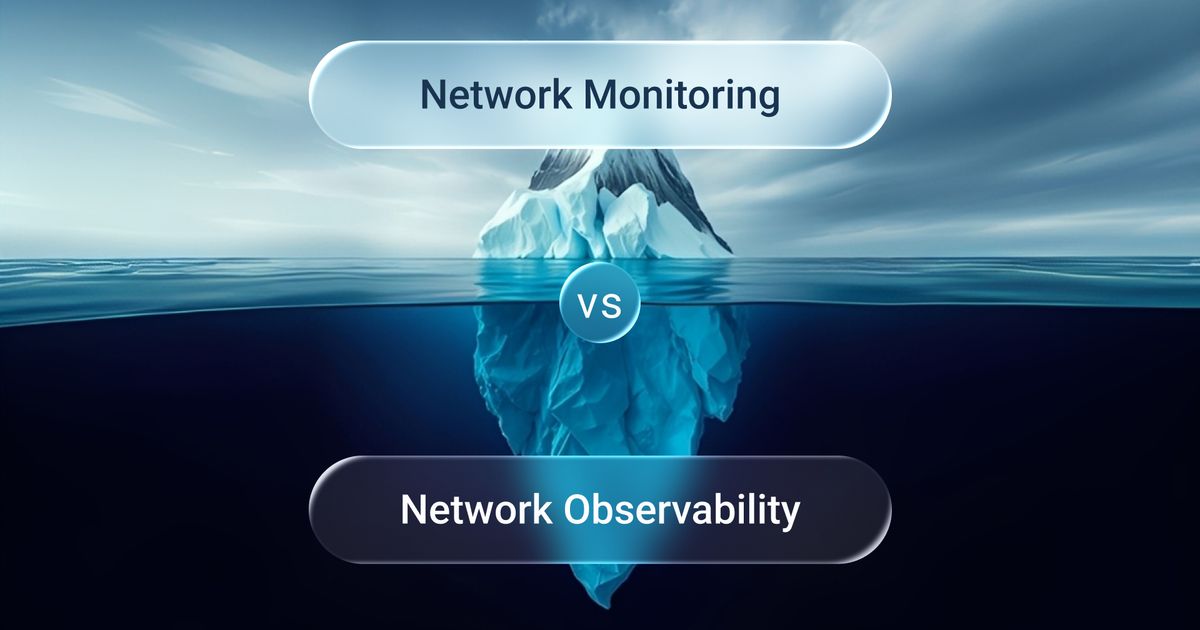
Network observability and network monitoring are two interconnected concepts in the realm of network management. While they share common goals of ensuring network stability and performance, they differ in their approaches and the depth of insights they provide. By exploring the relationship between network observability and network monitoring, we can gain a better understanding of how these concepts complement each other and contribute to effective network management strategies.
Let's delve into the nuances and connections between these two vital aspects of network operations.
Network monitoring focuses on the continuous collection, analysis, and reporting of network data to ensure the stability, availability, and performance of the network infrastructure. It typically involves monitoring key network metrics such as latency, packet loss, throughput, jitter, and device availability.
The primary goal of network monitoring is to detect and alert administrators about deviations from predefined thresholds or abnormal network behaviour. It provides visibility into the current state of the network, enabling proactive troubleshooting and issue resolution. Network monitoring tools often use SNMP (Simple Network Management Protocol) Network Monitoring or other protocols to gather data from network devices.
Network observability, on the other hand, takes a broader and more comprehensive approach. It involves collecting and analyzing a wide range of telemetry data from multiple sources within the network infrastructure, such as network devices, applications, servers, and user interactions.
The main objective of network observability is to gain deep insights and an understanding of network behaviour, performance, and interactions. It emphasizes real-time visibility, contextual knowledge, and the ability to trace network events and transactions across different components.
Network observability leverages advanced analytics techniques, machine learning algorithms, and data visualization tools to process and interpret the collected data. It provides administrators with actionable insights, facilitating proactive incident response, performance optimization, and root cause analysis.
While network monitoring focuses on monitoring specific metrics and thresholds, network observability goes beyond that by providing a more holistic and detailed view of the network. Network observability encompasses the capabilities of network monitoring but adds contextual information, real-time visibility, and the ability to handle large-scale and dynamic network environments.
In a way, network observability can be seen as an evolution of network monitoring. It builds upon the foundation of network monitoring but extends it by integrating additional data sources, advanced analytics, and intelligent automation. Network observability enables organizations to achieve a deeper understanding of their network infrastructure and make informed decisions to ensure optimal performance, security, and reliability.
It's worth noting that network monitoring is often a part of network observability. Monitoring specific metrics and thresholds is still valuable in providing an overall picture of network health. However, network observability takes monitoring to a higher level by encompassing a broader range of data and analysis techniques for a more comprehensive understanding of the network.
Ready to take your network monitoring and observability to the next level? Say goodbye to network headaches and hello to Obkio's all-in-one Network Monitoring tool! Whether you're a troubleshooting enthusiast or a data-driven network guru, Obkio has got you covered.
With real-time visibility, comprehensive analytics, and a user-friendly interface, our tool is designed to make network monitoring and observability a breeze.
Don't just monitor your network, truly understand it with Obkio. Get started today and unlock the power of network intelligence!
- 14-day free trial of all premium features
- Deploy in just 10 minutes
- Monitor performance in all key network locations
- Measure real-time network metrics
- Identify and troubleshoot live network problems

Network observability requires a combination of techniques and tools to collect, analyze, and interpret telemetry data from various sources within the network. These techniques and tools enable organizations to gain deep insights into network behaviour, performance, and interactions. Let's explore some of the key techniques and tools used in network observability:
Packet capture involves capturing and analyzing network traffic at the packet level. It provides granular visibility into network behaviour, allowing administrators to inspect individual packets for troubleshooting, security analysis, and performance optimization.
Flow analysis, on the other hand, focuses on aggregating and analyzing traffic flows based on packet headers, providing insights into network traffic patterns, bandwidth utilization, and application performance.
Tools like Wireshark, tcpdump, and NetFlow analyzers are commonly used for packet capture and flow analysis.
Distributed monitoring allows organizations to monitor network infrastructure, applications, and services across multiple locations or environments. It involves deploying monitoring agents or sensors in different network segments or geographical regions to collect telemetry data. These agents feed data to a central monitoring system that provides a comprehensive view of the entire network. Distributed monitoring helps capture data from various points in the network, ensuring a holistic understanding of network performance and behaviour.
Distributed Network Monitoring tools, like Obkio, are your number-one ally for implementing distributed monitoring for Network Observability.
Log management involves collecting, indexing, and analyzing logs generated by various network devices, applications, and systems. Logs provide valuable information about network events, errors, and performance metrics. By aggregating and analyzing logs, administrators can gain insights into system behaviour, detect anomalies, and troubleshoot issues.
Popular log management tools include ELK Stack (Elasticsearch, Logstash, Kibana), Splunk, and Graylog.
Data visualization tools play a critical role in network observability by transforming raw telemetry data into intuitive and actionable visual representations. These tools present network metrics, flow data, performance indicators, and other relevant information in visually appealing charts, graphs, and dashboards.
Data visualization helps administrators quickly identify patterns, anomalies, and performance bottlenecks, making it easier to interpret and analyze network data. Tools like Grafana, Kibana, and Tableau are widely used for network visualization in network observability.
Machine learning (ML) and artificial intelligence (AI) techniques are increasingly being used in network observability. ML algorithms can help analyze large volumes of telemetry data, detect anomalies, predict performance issues, and provide actionable insights.
AI-powered techniques can automate anomaly detection, identify patterns, and provide intelligent recommendations for network optimization. These technologies enhance the capabilities of network observability tools, making them more intelligent and adaptive to changing network conditions.
Many existing network monitoring tools have expanded their capabilities to incorporate observability features. These platforms offer a unified view of network monitoring data, flow analysis, log management, and other observability techniques. They provide a consolidated interface for administrators to monitor and analyze network performance, detect anomalies, and troubleshoot issues effectively.
Some popular integrated network monitoring tools include Obkio, Datadog, Dynatrace, and New Relic.
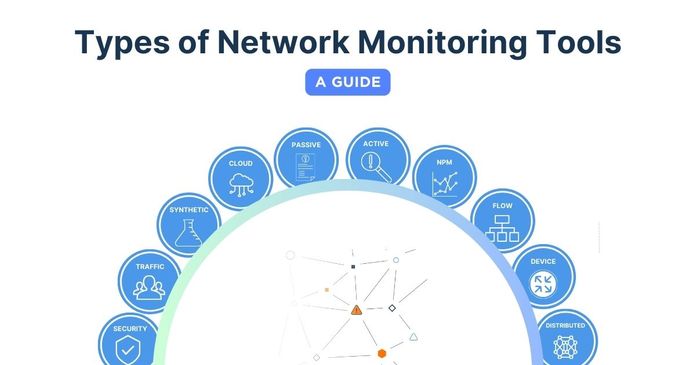
Discover the superheroes of network monitoring tools in our comprehensive guide. Unveil the perfect type of network monitoring tool for your business.
Learn more

Network observability delivers measurable improvements across network operations, transforming how organizations detect issues, optimize performance, and manage complex distributed environments. Understanding these concrete benefits helps justify implementation investments and guides strategic planning.
Network observability reduces mean time to resolution (MTTR) by providing contextual data that traditional monitoring lacks. Instead of receiving an alert that latency increased to 150ms on a specific link, observability shows the complete picture: which applications are affected, what user transactions are failing, and how traffic patterns changed in the minutes before the issue occurred.
Organizations implementing observability typically reduce troubleshooting time by 60-70% compared to threshold-based monitoring alone. Network teams spend less time correlating logs from multiple systems and more time implementing solutions. When a VoIP quality issue arises, observability immediately reveals whether the problem stems from jitter on the WAN connection, packet loss at the ISP handoff, or bandwidth contention from a backup job—without manual investigation.
Observability platforms identify performance degradation before it impacts users. By continuously analyzing telemetry data, these systems detect subtle changes in network behavior that indicate impending failures: gradual increases in error rates, slowly degrading interface performance, or unusual traffic patterns that suggest configuration issues.
This proactive approach prevents outages rather than merely responding to them. For example, observability might detect that a router's CPU utilization increases by 2-3% weekly—a pattern invisible to threshold-based alerts but indicative of a memory leak that will cause failure in approximately six weeks. Teams can schedule maintenance during planned windows rather than responding to 3 AM emergencies.
- Modern applications span multiple cloud providers, on-premises data centers, and edge locations. Network observability provides unified visibility across these distributed environments, revealing how application components interact and where bottlenecks occur.
Organizations use observability to optimize application delivery by identifying the slowest network hops, understanding traffic flow patterns, and measuring actual user experience. A retail company might discover that checkout transactions routed through a specific cloud region experience 200ms additional latency—actionable data that enables architectural improvements delivering measurable revenue impact.
Observability also enables accurate capacity planning by revealing actual bandwidth consumption patterns, peak usage times, and traffic growth trends across all network segments. Instead of over-provisioning circuits by 50% "to be safe," teams provision based on data-driven forecasts.
Network observability strengthens security by detecting anomalous behavior that signature-based tools miss. By establishing baselines for normal network activity—typical data flows, connection patterns, and bandwidth usage—observability platforms identify deviations that indicate potential security incidents.
A sudden increase in DNS queries from a specific subnet, unusual data transfers to external IP addresses, or changes in application communication patterns all trigger investigation before they escalate into data breaches. Observability provides the network-level context that security teams need to distinguish between legitimate activity and threats.
Integration with security information and event management (SIEM) systems enhances incident response by correlating network telemetry with security events, providing complete attack timelines and impact assessments.
Network observability reduces operational expenses by automating data collection, analysis, and initial troubleshooting steps. Instead of manually collecting logs, running traceroutes, and checking device configurations when issues occur, observability platforms automatically gather and correlate this information.
Organizations report 30-40% reductions in time spent on routine network monitoring tasks. Network engineers focus on strategic improvements rather than manual data collection and analysis. Automated anomaly detection eliminates the need for constant dashboard monitoring, while intelligent alerting reduces notification fatigue by filtering out false positives.
Resource optimization provides additional cost savings. By identifying underutilized circuits, over-provisioned bandwidth, and inefficient traffic routing, observability enables organizations to eliminate waste and optimize infrastructure spending.
Network observability provides the detailed performance metrics needed to validate SLA compliance and identify when service providers fail to meet contractual obligations. Continuous monitoring with granular data collection creates indisputable records of network performance.
When an ISP claims 99.9% uptime but users experience connectivity issues, observability data provides concrete evidence: actual uptime percentages, latency measurements, packet loss rates, and incident timelines. This documentation supports service credit claims and drives accountability from providers.
Internal SLA management also improves. IT teams use observability data to measure and report on network performance to business stakeholders, demonstrating service quality with objective metrics rather than subjective assessments.
Organizations migrating to cloud environments or managing multi-cloud architectures rely on observability to ensure successful transitions. Observability platforms measure performance across hybrid environments, comparing on-premises and cloud network performance to guide migration decisions.
During cloud migrations, observability identifies which applications experience performance degradation in cloud environments, reveals connectivity bottlenecks between on-premises and cloud resources, and validates that cloud network configurations meet performance requirements. Post-migration, it ensures that user experience matches or exceeds pre-cloud performance levels.
For multi-cloud deployments, observability provides unified visibility across AWS, Azure, Google Cloud, and on-premises infrastructure, enabling teams to optimize application placement, manage inter-cloud connectivity costs, and ensure consistent performance regardless of resource location.
Network observability transforms infrastructure planning from guesswork into science. Historical telemetry data reveals actual usage patterns, identifies bottlenecks, and quantifies the impact of network changes—enabling evidence-based architecture decisions.
When evaluating SD-WAN implementation, observability data shows exactly which sites experience the most performance issues, what bandwidth utilization looks like across all locations, and how traffic patterns would benefit from dynamic path selection. When considering network segmentation, observability reveals actual traffic flows between network zones, helping design efficient segmentation strategies.
Investment justification becomes straightforward with concrete performance data. Instead of requesting budget based on "the network feels slow," teams present specific metrics: "Application response times exceed our 200ms target 23% of the time, impacting 1,200 users daily and costing an estimated $X in productivity."
Network observability bridges the gap between network operations and application development teams by providing shared visibility into how network performance impacts applications. When application teams report performance issues, network teams can quickly demonstrate whether network conditions contribute to the problem.
This shared context reduces finger-pointing and accelerates resolution. Application performance monitoring (APM) tools integrate with network observability platforms, creating end-to-end visibility from user clicks through application code to network hops and back-end databases. Both teams work from the same data, speaking the same language about performance bottlenecks.
DevOps teams particularly benefit from observability's ability to correlate application deployments with network performance changes, identifying when code releases introduce network-impacting behaviors like excessive API calls or inefficient database queries.
So we've talked about Network Observability tools earlier, but what makes them so special?
Network observability tools are software solutions designed to provide comprehensive visibility into the performance, behavior, and health of computer networks. These tools gather and analyze data from various network devices, applications, and infrastructure components to help network administrators, engineers, and IT teams monitor, troubleshoot, and optimize network operations.
Network observability tools typically offer some more advanced and specialized features compared to traditional network monitoring tools, such as:
Real-Time Monitoring: These tools offer real-time monitoring capabilities, allowing users to track network performance metrics such as bandwidth usage, latency, packet loss, and device health in real-time. Real-time monitoring enables proactive issue detection and quick response to network anomalies.
End-to-End Visibility: Network observability tools provide end-to-end visibility across the entire network infrastructure, including routers, switches, firewalls, servers, applications, and endpoints. This holistic view helps identify dependencies, pinpoint bottlenecks, and understand the impact of network issues on overall performance.
Topology Mapping: Many observability tools offer network topology mapping features that visualize the network layout, device interconnections, and traffic flows. Topology maps help in understanding network architecture, identifying potential single points of failure, and optimizing network design.
Distributed Tracing: Network observability tools often include distributed tracing capabilities, allowing users to trace the path of transactions or data packets across distributed systems and microservices. This feature is especially valuable in complex, distributed environments to diagnose performance issues and understand dependencies between different components.
Full-Stack Visibility: Unlike traditional network monitoring tools that focus primarily on network infrastructure, observability tools provide full-stack visibility by monitoring not only network performance but also application performance, user experience, and infrastructure metrics. This holistic view helps in correlating network data with application performance and identifying root causes of issues that impact end-user experience.
Dynamic Baseline Generation: Observability tools use machine learning algorithms to dynamically generate performance baselines based on historical data and normal operating conditions. This approach enables automatic anomaly detection by comparing real-time data with expected behavior, reducing false positives and improving the accuracy of alerts.
Code-Level Instrumentation: Some observability tools offer code-level instrumentation capabilities that allow developers to instrument application code with custom metrics, traces, and logs. This granular visibility into application behavior helps in optimizing application performance, identifying performance bottlenecks, and troubleshooting code-level issues.
Anomaly Detection and Root Cause Analysis: Network observability tools employ advanced anomaly detection techniques, such as statistical analysis, machine learning, and pattern recognition, to automatically detect deviations from normal behavior and pinpoint root causes of issues. This proactive approach to troubleshooting accelerates problem resolution and minimizes downtime.
Overall, the combination of these advanced features distinguishes network observability tools from traditional network monitoring tools, enabling organizations to gain deep insights into their entire IT infrastructure, detect and resolve issues faster, and optimize the performance and reliability of modern applications and services.
Implementing network observability requires careful planning, strategy, and adherence to best practices to ensure its effectiveness. So before we leave you on your way, we want to equip you with the best practices for successfully implementing a network observability strategy that perfectly fits your business needs.
Here are some key best practices to consider when implementing network observability:
Start by defining clear objectives and goals for network observability. Identify the specific insights, metrics, and visibility requirements that align with your organization's network management and performance optimization objectives.
This will guide your implementation strategy and ensure that the observability solution meets your specific needs.
Some examples of objectives could include:
- Identify and Resolve Network Bottlenecks: The objective could be to identify and resolve network bottlenecks that impact application performance. This could involve monitoring metrics like latency, packet loss, and bandwidth utilization to pinpoint areas of congestion and optimize network resources.
- Optimize Application Delivery: The objective could be to optimize application delivery by monitoring and analyzing application response times, server performance, and network latency. This objective aims to identify performance bottlenecks, optimize network configurations, and improve the overall user experience.
- Ensure High Availability and Reliability: The objective could be to ensure high availability and reliability of network services by monitoring network uptime, link status, and device health. This objective focuses on minimizing downtime, identifying potential failures, and implementing proactive measures for fault tolerance.
- Improve Capacity Planning and Scalability: The objective could be to improve capacity planning and scalability by monitoring network traffic patterns, resource utilization, and application demands. This objective aims to optimize network capacity, forecast future requirements, and ensure smooth scalability as the network grows.
- Enable Effective Troubleshooting and Root Cause Analysis: The objective could be to enable effective troubleshooting and root cause analysis by capturing detailed network telemetry data, logs, and metrics. This objective aims to reduce mean time to repair (MTTR), enhance problem-solving efficiency, and minimize the impact of network issues.
- Monitor and Optimize Cloud Infrastructure: The objective could be to monitor and optimize cloud infrastructure by monitoring network connectivity, performance, and cost efficiency. This objective focuses on ensuring optimal usage of cloud resources, identifying potential cost-saving opportunities, and maintaining a high level of network performance in cloud environments.
Choose the right set of network observability tools and technologies that align with your network infrastructure, scale requirements, and data analysis capabilities. Consider factors such as data collection methods, integration with existing systems, ease of use, scalability, and support for different network components.
There are several network observability tools available in the market, each offering unique features and capabilities. Evaluate different options, conduct proofs-of-concepts, and select tools that provide comprehensive visibility and analysis capabilities.
Most importantly, understand if you actually need a Network Observability tool, or maybe just a Network Monitoring tool!
- Network Monitoring Tool: These tools primarily focus on collecting and displaying data related to network performance metrics such as bandwidth usage, latency, packet loss, device status, and traffic patterns. They provide visibility into the current state of the network and alert administrators about predefined thresholds or conditions.
- Network Observability Tool: On the other hand, network observability tools go beyond traditional monitoring by offering advanced capabilities such as distributed tracing, anomaly detection, root cause analysis, full-stack visibility, and dynamic baseline generation. These tools provide deeper insights into the behavior, interactions, and dependencies of network components, applications, and services.

Ready for Reliable Network Monitoring? Choose Obkio!
If you've done your research and concluded that what you truly need is a focused network monitoring tool rather than a comprehensive network observability tool, Obkio's Network Monitoring and Troubleshooting tool is precisely what you're looking for.
End-to-End Monitoring: Gain complete visibility into your network from end to end. Obkio monitors every aspect of your network's performance, from devices and connections to applications and services, ensuring you have a comprehensive view of your network's health.
Advanced Diagnostics: Our tool includes advanced diagnostics and troubleshooting features that help you pinpoint network issues quickly and accurately. Say goodbye to prolonged downtime and hello to proactive problem-solving.
Ease-of-Use: Designed with user experience in mind, Obkio offers an intuitive interface and straightforward setup process. You don't need to be a network expert to start monitoring and optimizing your network effectively.

Clearly define the key metrics and Key Performance Indicators (KPIs) that you want to monitor and analyze and tailor these metrics to your specific business and operational needs to ensure they align with your desired outcomes.
While they are a variety of network metrics you should be monitoring, here are some of the most important:
- Latency: Latency measures the time it takes for data to travel from the source to the destination. High latency can indicate network congestion, routing issues, or performance bottlenecks that affect user experience and application responsiveness.
- Packet Loss: Packet loss refers to the percentage of packets that do not reach their destination. It can be caused by network congestion, faulty network equipment, or configuration issues. Monitoring packet loss helps identify potential network issues and assess the quality of service.
- Bandwidth Utilization: Bandwidth utilization measures the percentage of available network bandwidth being used. Monitoring bandwidth utilization helps identify periods of high demand and potential congestion points that may impact network performance.
- Network Errors: Network errors include various types of errors that occur during data transmission, such as CRC errors, input/output errors, and frame errors. Tracking network error rate helps identify problematic network devices or connections that require troubleshooting.
- Network Traffic Volume: Network traffic volume measures the amount of data transmitted over the network within a given time frame. Monitoring network traffic volume helps identify trends, peak usage times, and potential capacity issues.
- Network Jitter: Jitter refers to the variation in the delay of received packets. High jitter can lead to inconsistent data transmission and negatively impact real-time applications such as voice and video communications. Monitoring network jitter helps ensure a stable and reliable network connection.
- Network Topology Changes: Tracking network topology changes helps identify any modifications or additions to the network infrastructure. It provides insights into network expansion, device reconfigurations, or potential security breaches.
- Application Response Time: Application response time measures the time it takes for an application to respond to a user's request. Monitoring application response time helps assess critical applications' performance and user experience.
- Network Device Health: Monitoring the health of network devices with Network Device Monitoring, such as routers, switches, and firewalls, helps ensure their proper functioning. Metrics such as CPU usage, network utilization, memory usage, and interface status can provide insights into device performance and potential issues.
- Network Response Time: Network respone time measured takes for a network system or a computer to respond to a request or a query initiated by a user or another system.
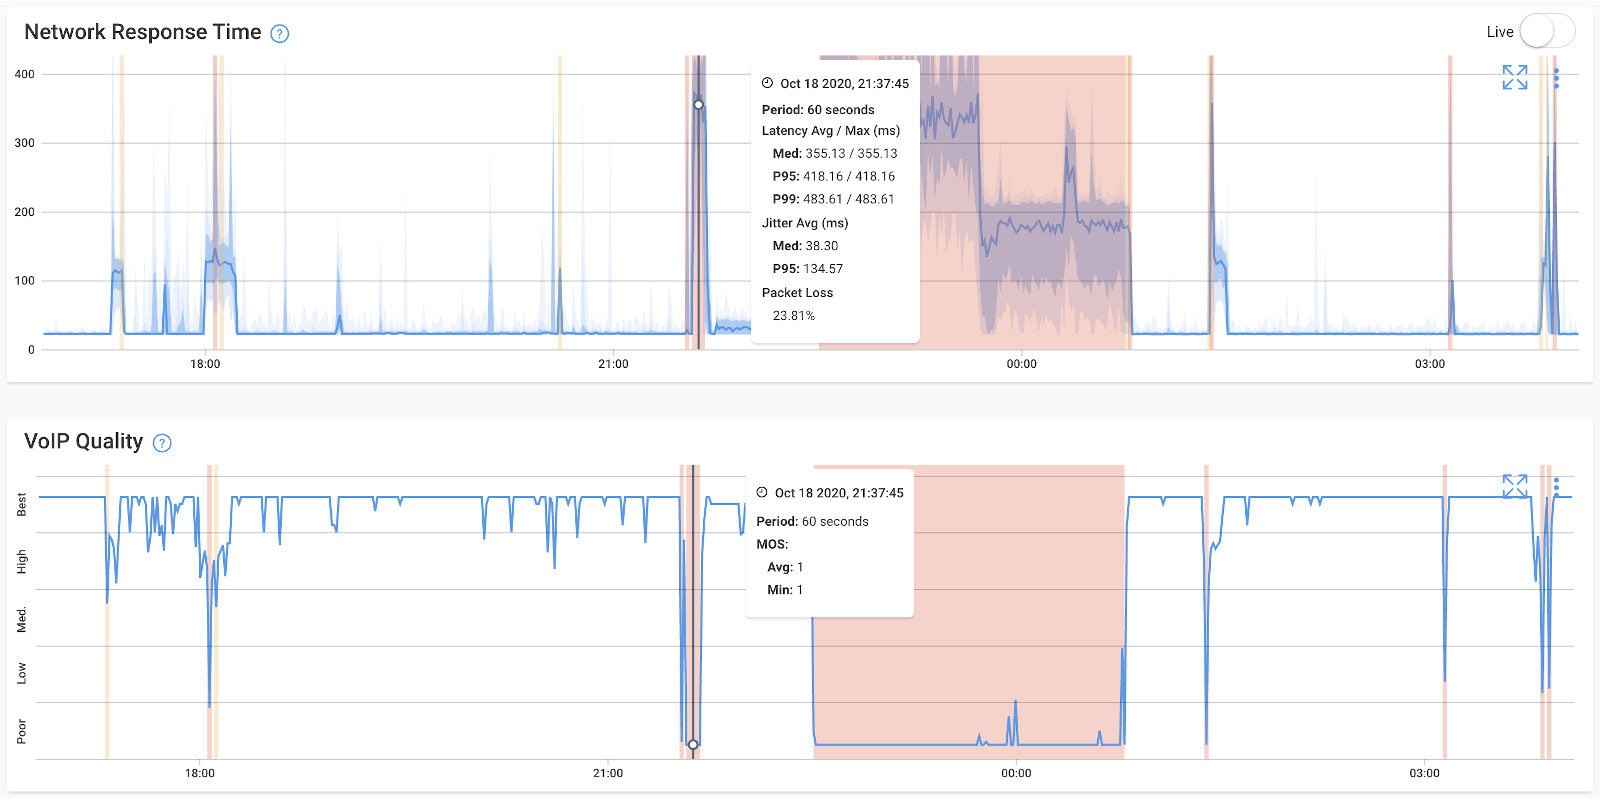
Implement a mechanism to collect, aggregate, and centralize telemetry data from various sources within your network infrastructure. This may involve deploying agents, sensors or collectors, like Obkio’s Network Monitoring Agents, in strategic network locations to capture relevant data points.
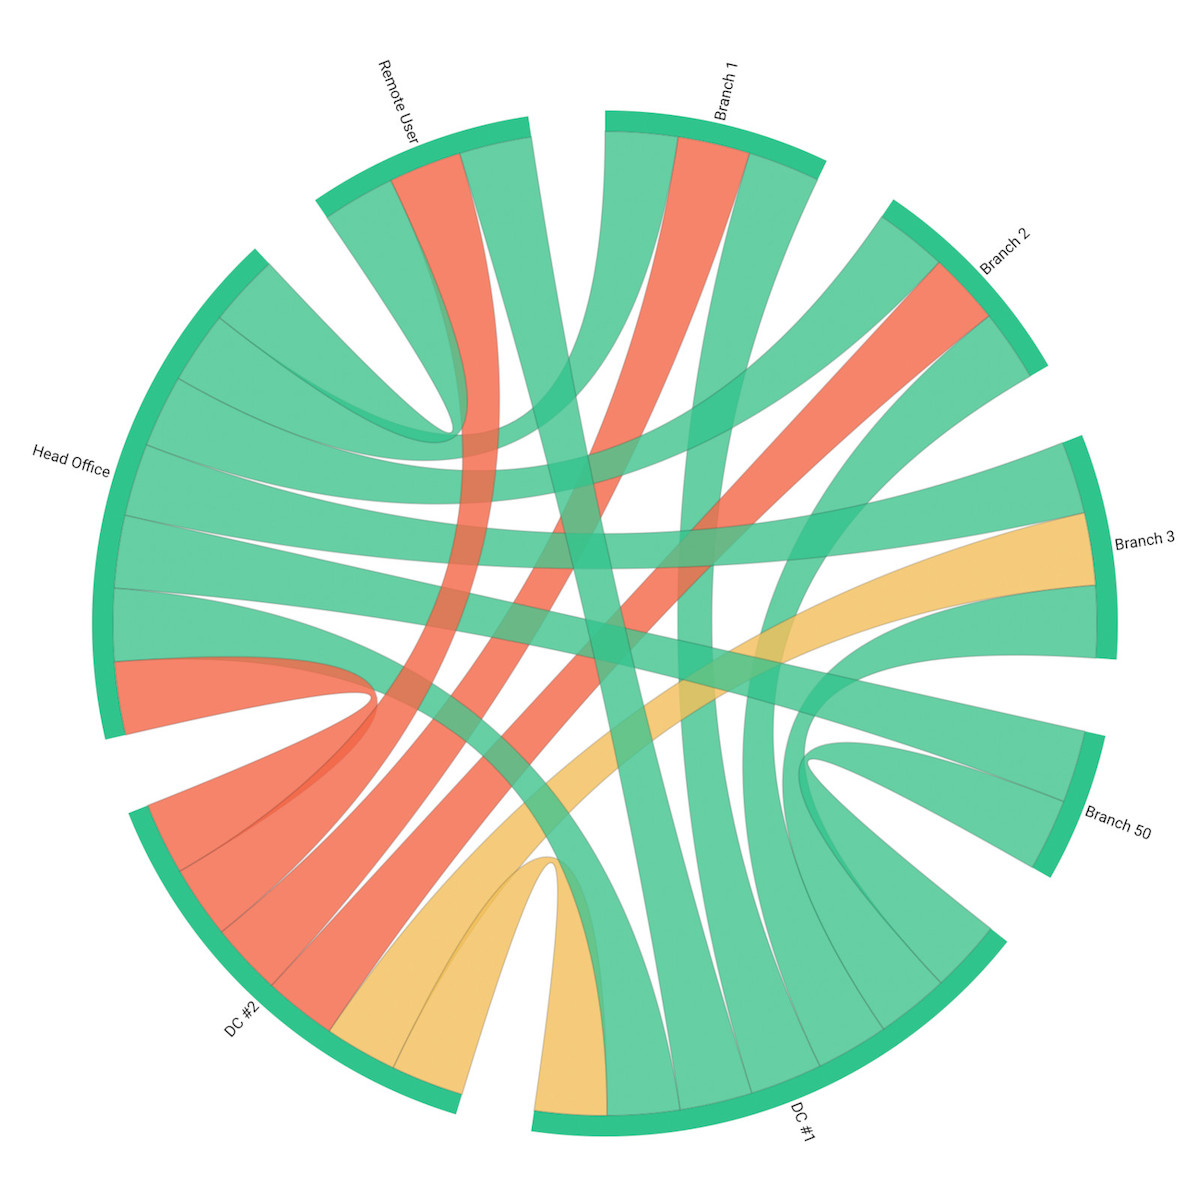
Ensure that the collected data is stored securely and is easily accessible for analysis and visualization.
Utilize automation and orchestration capabilities to streamline data collection, analysis, and response processes. Automation can help in data collection, anomaly detection, and incident response, enabling faster and more efficient troubleshooting.
Orchestration can help coordinate actions across different network components to resolve issues and optimize performance.
Establish baseline performance metrics and set appropriate thresholds for triggering alerts and notifications. Baselines help define normal behaviour for different network components and facilitate anomaly detection.
Thresholds help determine when specific metrics exceed acceptable limits, indicating potential issues. Regularly review and update these network baselines and thresholds as the network environment evolves.
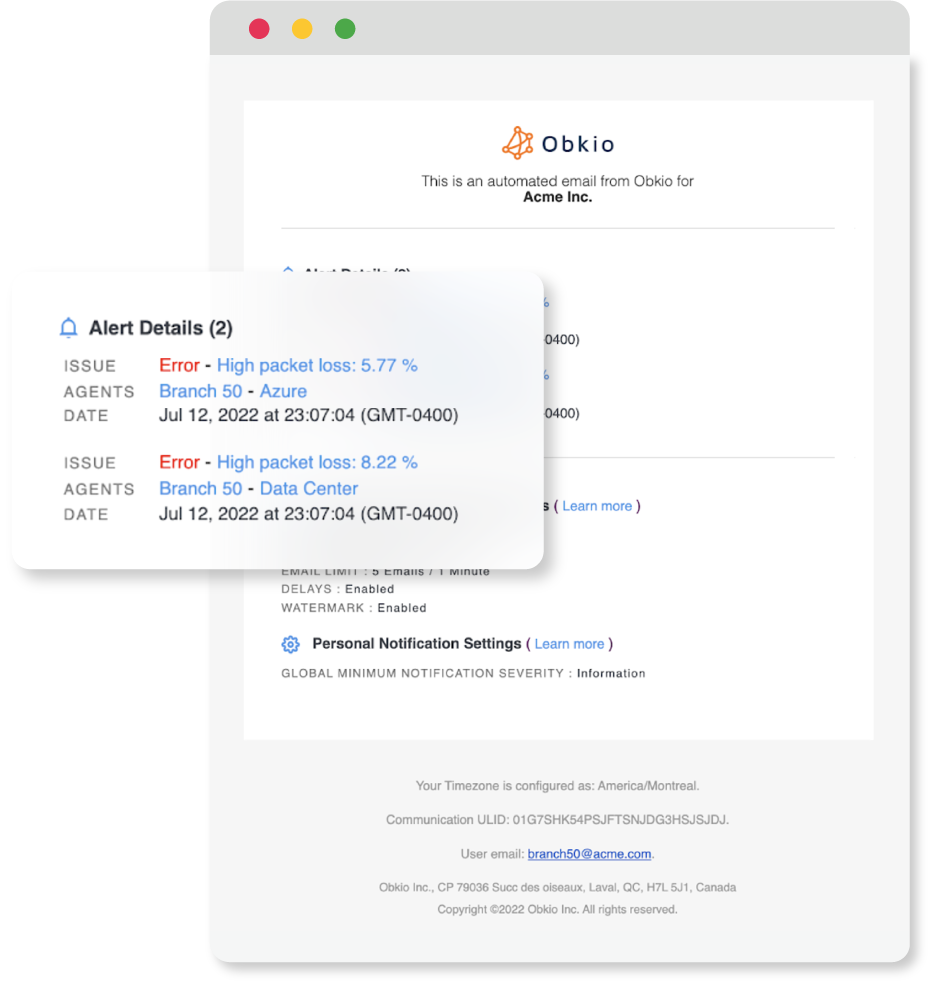
Implement real-time monitoring capabilities to detect and respond to network issues promptly. Configure network monitoring alerts and notifications to provide immediate notifications when anomalies or performance deviations occur.
Ensure that the alerting system is configured appropriately, providing actionable insights and avoiding unnecessary alert fatigue.
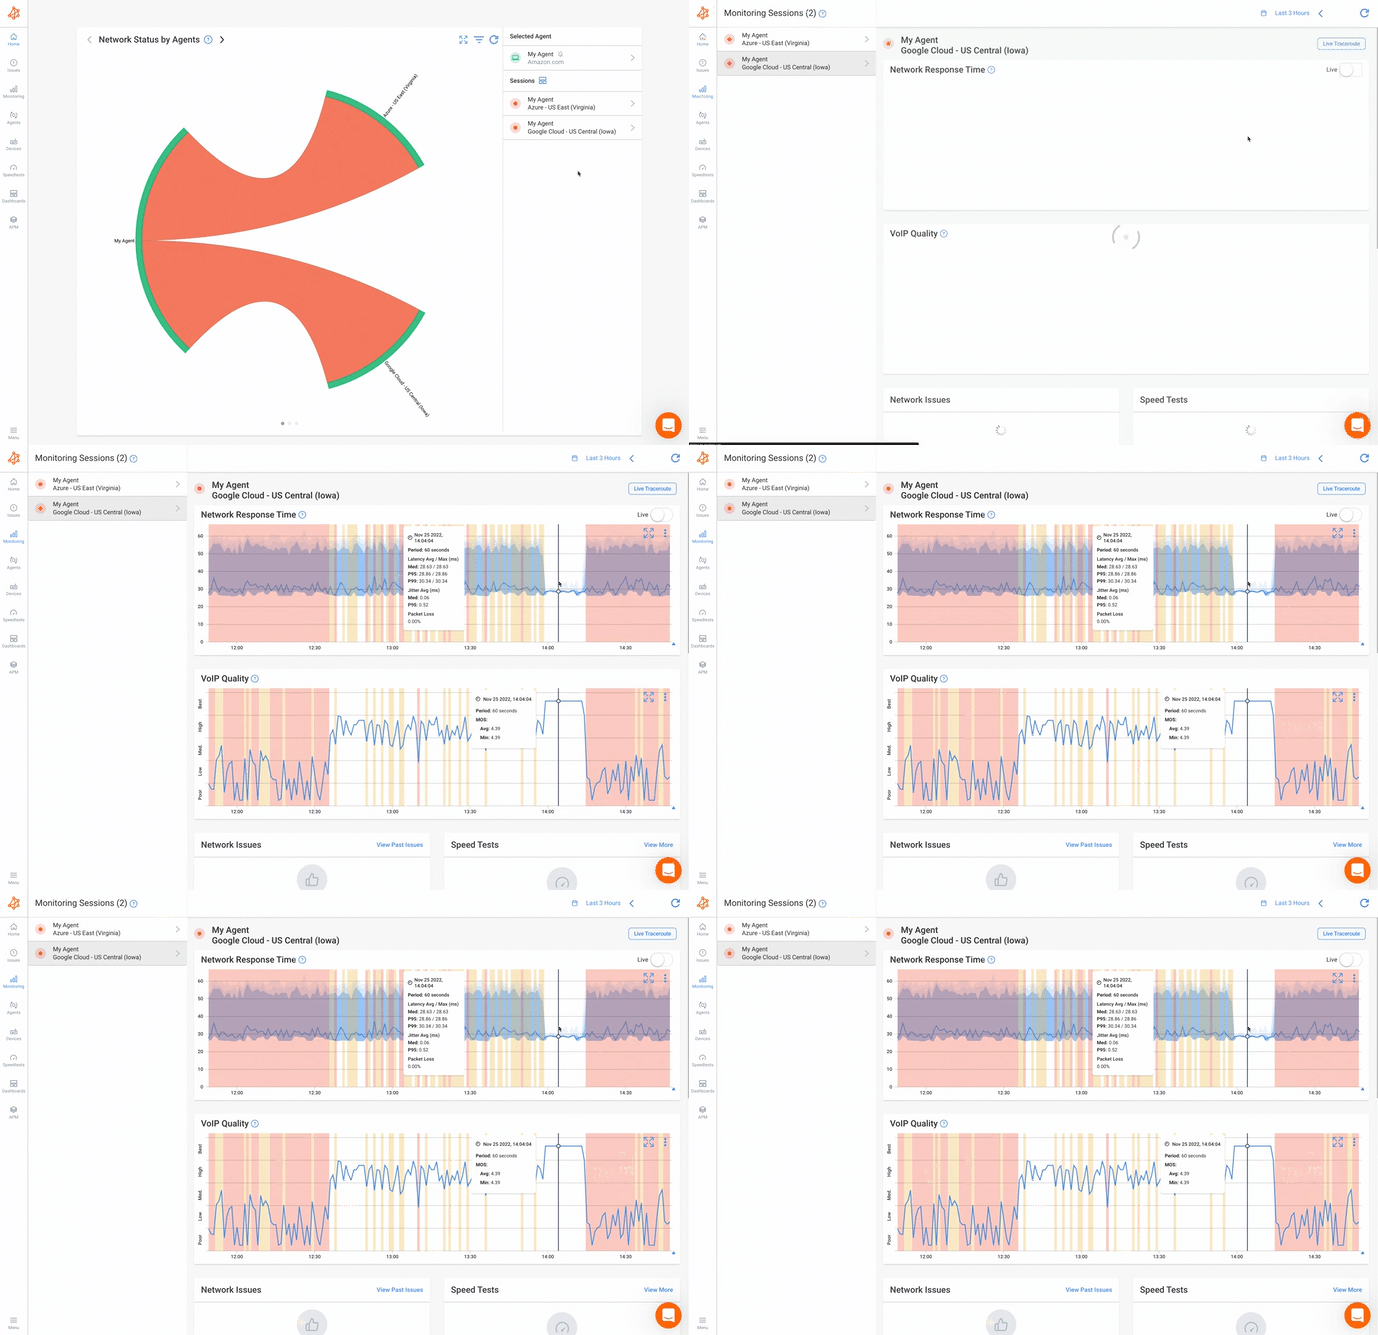
Network observability is a collaborative effort involving network administrators, DevOps teams, and other stakeholders. Encourage cross-functional collaboration and open communication channels to share insights, discuss findings, and collaborate on issue resolution. Foster a culture of continuous learning and improvement within the organization.
Regularly analyze and review the collected data to identify trends, patterns, and areas for optimization. Leverage data visualization tools and dashboards to gain meaningful insights and facilitate data-driven decision-making.
Schedule periodic reviews and analysis sessions to ensure ongoing optimization and improvement of network performance.
Network observability is an ongoing process, and the network environment is constantly evolving. Regularly assess the effectiveness of your observability practices and make necessary adjustments based on changing requirements, technology advancements, and emerging network monitoring best practices.
Stay informed about industry trends, new tools, and techniques to continually enhance your network observability capabilities.
Choosing between network observability and network monitoring depends on your network's complexity, scale, and operational requirements. While both approaches provide valuable insights, the optimal choice varies based on specific business needs and infrastructure characteristics.
Small Networks (Fewer than 50 Devices)
Traditional network monitoring is typically sufficient for small networks with straightforward architectures. When your infrastructure includes a limited number of routers, switches, and servers in predictable configurations, monitoring tools effectively track key metrics like bandwidth utilization, device availability, and basic performance indicators.
Start with network monitoring if you have:
- Single-site or small multi-site deployments
- Minimal cloud integration
- Straightforward network topology
- Limited IT resources for tool management
Growing Networks (50-500 Devices)
Organizations with expanding networks benefit from a hybrid approach combining monitoring and observability capabilities. As network complexity increases with additional sites, cloud services, and diverse applications, the need for contextual insights grows alongside traditional metric tracking.
Implement hybrid monitoring and observability when you experience:
- Multi-site connectivity challenges
- Increased application performance complaints
- Difficulty isolating root causes with monitoring alone
- Growing cloud and hybrid infrastructure
Enterprise Networks (500+ Devices)
Large-scale enterprise environments require comprehensive network observability to manage distributed architectures effectively. With hundreds or thousands of network devices, multiple data centers, extensive cloud presence, and complex application dependencies, observability provides the deep insights necessary for proactive management.
Full observability becomes essential with:
- Global network presence across multiple regions
- Complex hybrid cloud and multi-cloud architectures
- Microservices and containerized applications
- High-volume transaction processing
- Stringent SLA requirements
Traditional On-Premises Environments
Networks consisting primarily of physical infrastructure with stable, predictable traffic patterns can operate effectively with network monitoring. These environments benefit from threshold-based alerting and established performance baselines.
Cloud-Native and Hybrid Architectures
Modern cloud-native applications, microservices architectures, and hybrid environments demand network observability. The dynamic nature of cloud resources, containerized workloads, and distributed services requires real-time correlation and contextual analysis that traditional monitoring cannot provide.
Network observability is critical for:
- Kubernetes and container orchestration platforms
- Serverless computing environments
- Software-defined networking (SDN) and SD-WAN deployments
- Multi-cloud connectivity and workload distribution
Reactive Troubleshooting vs. Proactive Management
Choose network monitoring when your primary goal is detecting known issues and responding to threshold violations. Monitoring excels at alerting administrators when metrics exceed predefined limits, enabling rapid response to familiar problems.
Select network observability when you need to:
- Identify unknown issues before they impact users
- Understand complex interactions between network components
- Perform deep root cause analysis across distributed systems
- Predict potential failures through pattern recognition
Compliance and Reporting Needs
Organizations with strict compliance requirements benefit from observability's comprehensive data collection and analysis capabilities. The ability to trace transactions, maintain detailed logs, and provide contextual evidence supports audit requirements and regulatory compliance.
Limited IT Resources
Smaller teams with constrained resources should start with network monitoring for its straightforward implementation and lower management overhead. As teams grow and expertise develops, gradually introduce observability capabilities for specific critical applications or network segments.
Mature IT Operations
Organizations with dedicated network operations teams, DevOps practices, and robust IT infrastructure can maximize value from full network observability. The investment in advanced tools and training pays dividends through reduced downtime, faster issue resolution, and optimized network performance.
Organizations don't need to choose exclusively between monitoring and observability. The most effective strategy often involves starting with monitoring for baseline visibility, then gradually introducing observability capabilities as networks grow and complexity increases.
Begin by implementing monitoring for critical infrastructure, then expand observability to specific problem areas like application performance, cloud connectivity, or user experience. This phased approach allows teams to develop expertise while maximizing the value of both approaches.
In the realm of network management and monitoring, two critical concepts come to the forefront: network observability and network visibility. While they both play essential roles in gaining insights into network performance and behavior, they differ in scope and approach.
In this section, we delve deeper into these two concepts of Network Observability vs. Visibility, exploring their differences, benefits, and applications. By grasping the distinctions between network observability and visibility, you'll gain a clearer understanding of how each contributes to effective network management and troubleshooting.
Network visibility refers to the ability to collect, capture, and analyze network data and traffic. This involves deploying various tools and technologies to gain insights into what is happening on the network.
Network visibility solutions often include network taps, packet brokers, and monitoring tools that help capture and aggregate network traffic for analysis. The goal of network visibility is to provide IT teams with a clear view of the network's performance, security, and overall health.
By having access to detailed data about network traffic and behaviors, organizations can detect and troubleshoot issues, monitor for security threats, and optimize network performance.
Network observability takes a broader approach. It encompasses the concept of understanding the internal state and behaviors of a system based on its external outputs. In the context of networking, observability refers to the ability to infer the internal state and health of a network based on the data and signals it generates.
This may involve not only collecting network data and traffic, but also utilizing telemetry data, logs, metrics, and other sources of information to gain a holistic understanding of network behavior. Observability focuses on understanding how different components of a network interact and influence each other, allowing for proactive issue detection and better insights into the root causes of problems.
Scope and Approach: Network visibility primarily focuses on capturing and analyzing network traffic and data to monitor performance and security. Network observability, on the other hand, emphasizes understanding the internal behavior of the network as a whole based on the data it produces.
Data Types: Network visibility heavily relies on capturing raw network packets and data. Network observability goes beyond this by incorporating various types of data, including telemetry, logs, and metrics, to gain a comprehensive understanding of network behavior.
Insights and Use Cases: Network visibility is often used for real-time monitoring, anomaly detection, and reactive troubleshooting. Network observability enables proactive issue detection, root cause analysis, and the ability to understand how different network components interact and influence each other.
Holistic Understanding: Network observability aims to provide a more holistic and contextual understanding of the network's behavior, allowing IT teams to identify patterns, trends, and relationships that might not be immediately apparent through traditional visibility tools.
In summary, while both network visibility and network observability contribute to effective network management and monitoring, observability takes a broader and more proactive approach, leveraging various data sources to gain a deeper understanding of network behaviors and interactions.
The world of computer networking is vaste, and any network admin knows that there are many more networking concepts to explore. In addition to network observability vs. visiblity, we also have Network Observability vs Monitoring vs Telemetry.
Network observability, monitoring, and telemetry are interconnected concepts in the field of IT and network management, each with its own distinct focus and purpose. Let's break down the differences between these terms:
Network monitoring involves the continuous surveillance of a network's performance, availability, and security. It revolves around the collection and analysis of data related to network devices, traffic, and applications.
The primary goal of network monitoring is to ensure that the network is operating smoothly and efficiently, and to promptly detect and respond to issues such as network downtime, congestion, and security breaches. Monitoring tools often provide real-time alerts, reports, and dashboards to IT teams, enabling them to take action based on the collected data.
Key Differences of Network Monitoring:
- Focus: Network monitoring is primarily concerned with tracking the real-time performance and health of network devices, traffic, and applications.
- Data Collection: Monitoring tools gather data from network devices and analyze metrics such as bandwidth utilization, latency, error rates, and network availability.
- Purpose: The main purpose of network monitoring is to ensure that the network is operating within acceptable performance parameters and to detect and respond to deviations or issues promptly.
Network Monitoring Use Cases:
- Performance Monitoring: Network monitoring tools provide insights into metrics like latency, throughput, and response times to ensure optimal network performance.
- Security Monitoring: Monitoring helps detect and alert on unauthorized access attempts, abnormal traffic patterns, and potential security breaches.
- Capacity Planning: By analyzing historical data, monitoring assists in predicting resource requirements and planning for network growth.
- Troubleshooting: Monitoring aids in quickly identifying and isolating network issues, allowing for rapid resolution.
Telemetry refers to the automated collection and transmission of data from various network components and devices. This data can include metrics, logs, and other relevant information about the health, performance, and behavior of these components.
Telemetry data is crucial for understanding how different parts of the network are functioning and interacting. It is used to assess the overall system health, identify trends, and make informed decisions for optimizing network performance and diagnosing problems. Telemetry provides a continuous stream of data that allows for both real-time monitoring and historical analysis.
Key Differences of Telemetry:
- Focus: Telemetry involves the automated collection and transmission of data from network devices to provide insights into their health and behavior.
- Data Collection: Telemetry data includes various metrics, logs, and statistics generated by network devices, helping to assess their performance and status.
- Purpose: Telemetry data informs network administrators about the operational state of devices and enables data-driven decision-making.
Telemtry Use Cases:
- Capacity Optimization: Telemetry data helps identify underutilized resources, optimizing capacity and ensuring efficient resource allocation.
- Predictive Maintenance: By monitoring equipment conditions, telemetry enables predictive maintenance, reducing downtime due to hardware failures.
- Performance Analysis: Telemetry metrics aid in understanding trends and patterns in network behavior, guiding performance optimization efforts.
- Traffic Analysis: Telemetry data assists in analyzing traffic patterns, identifying bottlenecks, and improving overall network efficiency.
Network observability takes a step beyond monitoring and telemetry. It involves the ability to gain insights into the internal workings of a network by analyzing its external outputs.
This includes not only monitoring data and telemetry, but also other sources like logs, traces, and application data. The goal of network observability is to understand not only what is happening on the network, but also why and how it is happening. It focuses on uncovering the context, relationships, and patterns that influence network behaviors. Observability enables proactive problem detection, root cause analysis, and a more comprehensive understanding of network dynamics.
Key Differences of Network Observability:
- Focus: Network observability emphasizes gaining a deeper understanding of the internal behaviors and interactions within a network based on external data outputs.
- Data Collection: Observability relies on diverse data sources, including monitoring metrics, logs, traces, and application data, to reconstruct network behaviors.
- Purpose: Observability facilitates root cause analysis, proactive problem detection, and understanding complex relationships within the network.
Network Observability Use Cases:
- Root Cause Analysis: Observability allows IT teams to trace back issues to their origin, providing insights into why problems occurred and how to prevent them.
- Proactive Issue Detection: By identifying patterns and anomalies, observability helps anticipate potential problems and address them before they impact the network.
- Microservices Monitoring: Observability is crucial in complex microservices architectures, where understanding interactions among various services is essential.
- User Experience Insights: Observability provides insights into user experiences, helping ensure optimal service delivery and customer satisfaction.
- Monitoring focuses on real-time tracking and alerting of network performance and security metrics.
- Telemetry involves collecting and transmitting data from network components for analysis and optimization.
- Observability goes beyond monitoring and telemetry by providing a holistic understanding of network behaviors and interactions based on various data sources.
Together, these concepts contribute to effective network management, troubleshooting, and optimization, helping IT teams ensure the reliability, security, and efficiency of their networks.
Network monitoring tracks predefined metrics like latency, bandwidth, and packet loss against established thresholds, alerting administrators when values exceed limits. Network observability goes further by collecting comprehensive telemetry data from all network sources—including logs, traces, flows, and metrics—to provide contextual understanding of network behavior.
While monitoring answers "what is happening," observability answers "why is it happening" by correlating data across systems to enable root cause analysis and proactive issue detection.
Network observability costs vary significantly based on network size, complexity, and chosen platform. Small deployments (under 50 devices) typically cost $500-$2,000 monthly, mid-size networks (50-500 devices) range from $2,000-$15,000 monthly, and enterprise implementations (500+ devices) can exceed $20,000 monthly. Pricing models include per-device, per-data-volume, or per-user licensing. Most vendors offer 14-30 day free trials.
Essential tools for network observability include distributed monitoring platforms (like Obkio for synthetic monitoring), packet capture and flow analysis tools (Wireshark, NetFlow analyzers), log management systems (ELK Stack, Splunk), data visualization platforms (Grafana, Kibana), and SNMP polling tools for device health monitoring.
Many organizations start with an integrated platform that combines these capabilities. For cloud and hybrid environments, consider tools with native cloud provider integrations. Machine learning capabilities enhance anomaly detection, while API integrations enable automation and correlation with other IT systems.
Yes, network observability significantly reduces downtime through proactive issue detection. By continuously analyzing telemetry data and establishing baselines for normal behavior, observability platforms identify performance degradation before it impacts users—detecting subtle changes like gradual CPU increases, memory leaks, or unusual traffic patterns that indicate impending failures.
Organizations using network observability reduce mean time to resolution (MTTR) by 65-75% and often prevent outages entirely by addressing issues during planned maintenance windows. However, observability cannot prevent all downtime, particularly hardware failures or external issues like ISP outages.
Network observability complements rather than replaces existing monitoring tools. Most observability platforms integrate with traditional monitoring systems through APIs, allowing them to ingest data from SNMP monitors, syslog servers, and performance monitoring tools. This creates a unified view combining threshold-based alerts with contextual telemetry data.
Organizations typically implement network observability incrementally, starting with critical applications or problem areas while maintaining existing monitoring—then gradually expanding coverage. Many teams use traditional monitoring for basic device health checks while leveraging observability for complex troubleshooting and root cause analysis.
No, network observability benefits organizations of all sizes, though implementation complexity varies. Small businesses with 20-50 devices gain value from observability when managing cloud services, remote offices, or critical applications requiring detailed performance insights. Mid-size organizations (50-500 devices) see the most dramatic ROI as complexity increases beyond traditional monitoring capabilities.
While large enterprises (500+ devices) require comprehensive observability for distributed architectures, smaller organizations can start with focused implementations targeting specific pain points—VoIP quality monitoring, cloud connectivity, or application performance—then expand as needs grow.
Essential metrics for network observability include latency (end-to-end delay), packet loss percentage, jitter (latency variation), throughput and bandwidth utilization, network device CPU and memory usage, interface error rates, and application response times. Flow-based metrics reveal traffic patterns and top talkers, while Quality of Service (QoS) metrics ensure critical applications receive adequate resources.
For cloud environments, monitor inter-region latency and cloud provider performance. Advanced implementations track Mean Opinion Score (MOS) for voice quality, transaction completion rates, and user experience metrics. The specific metrics depend on your infrastructure and business priorities.
Implementation timelines vary by scope and complexity. Basic deployments with cloud-based platforms can achieve initial visibility within days—deploying monitoring agents, configuring data collection, and creating initial dashboards takes 1-2 weeks for small networks. Mid-size implementations typically require 4-8 weeks including planning, agent deployment, integration with existing systems, baseline establishment, and team training.
Enterprise deployments spanning multiple sites and complex architectures may take 3-6 months for comprehensive implementation. However, organizations can realize value incrementally by prioritizing critical applications or problem areas, then expanding coverage over time.
Network observability requires understanding of networking fundamentals—TCP/IP, routing, switching, and common protocols—but doesn't necessarily demand specialized certifications. Most platforms offer intuitive interfaces accessible to network administrators with moderate experience. Advanced features like custom dashboards, API integrations, and machine learning configurations benefit from additional expertise.
Many organizations successfully implement observability by training existing network staff through vendor-provided resources, online courses, and hands-on experience. Consider partnering with managed service providers or consultants for initial implementation if internal expertise is limited, then transitioning to internal management as skills develop.
Yes, network observability is critical for successful cloud migrations. During migration planning, observability establishes performance baselines for on-premises applications, helping set cloud performance targets and identify potential issues. Throughout migration, it measures application performance in cloud environments, compares on-premises versus cloud response times, identifies connectivity bottlenecks, and validates that cloud configurations meet requirements.
Post-migration, observability ensures user experience matches or exceeds pre-cloud performance, optimizes cloud resource placement, and manages connectivity costs. Organizations using observability during cloud migrations report 40-50% fewer performance-related issues and faster time to production.
Network visibility focuses on collecting and displaying network traffic data and performance metrics—essentially answering "what is happening on the network right now." Network observability encompasses visibility but adds deeper analysis: understanding why events occur, how components interact, and what patterns indicate future issues.
Network Visibility provides raw data through packet capture, flow monitoring, and device statistics. Network Observability correlates this data with logs, traces, and application metrics to create contextual understanding. Think of visibility as having a detailed map, while observability is understanding the entire journey including why certain routes are chosen and where delays occur.
Network observability is essential for remote work environments, providing visibility into home network performance, ISP connectivity quality, VPN performance, and cloud application access. It identifies whether performance issues stem from employee internet connections, corporate VPN concentrators, or application servers, eliminating guesswork when remote employees report problems.
Network Observability platforms measure metrics like VPN latency, video conferencing quality (jitter, packet loss), and cloud application response times from remote locations. Organizations use this data to optimize VPN configurations, identify ISPs with poor performance, and ensure remote employees have equivalent experiences to office-based staff.

Both network observability and network monitoring play critical roles in ensuring optimal network performance, identifying issues, and enabling proactive optimization. While network monitoring focuses on collecting and analyzing network data, network observability takes a more holistic approach, encompassing broader visibility, contextual insights, and actionable analytics.
By implementing both practices in tandem, businesses can gain a comprehensive understanding of their network infrastructure, proactively address performance issues, and deliver a superior user experience.
To achieve these benefits, it is essential to leverage the right tools and technologies. One such tool that stands out is Obkio's Network Monitoring and Observability tool!
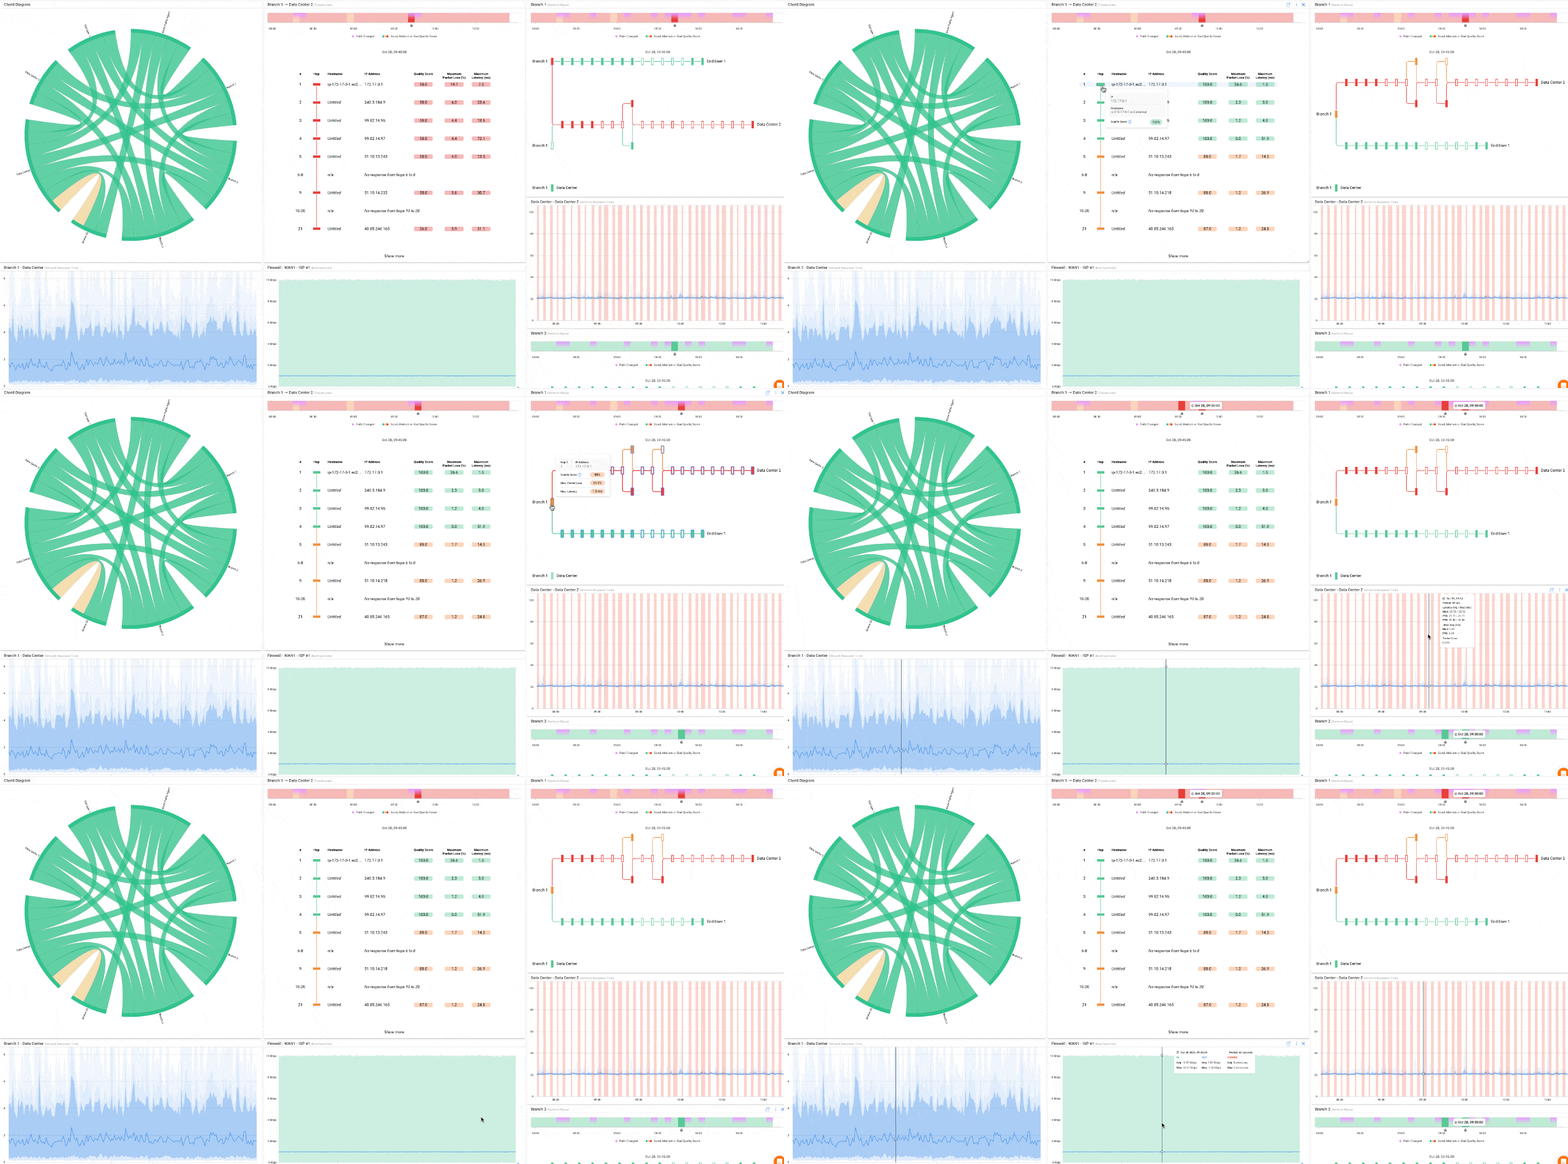
Obkio offers a robust and user-friendly platform for network monitoring and observability, enabling businesses to monitor network performance in real-time, troubleshoot issues efficiently, and optimize their network infrastructure. With Obkio, organizations can leverage comprehensive metrics, customizable dashboards, and automated alerts to ensure their networks operate at peak efficiency.
Embrace the power of Obkio to enhance your network performance, improve troubleshooting capabilities, and deliver an exceptional user experience.
- 14-day free trial of all premium features
- Deploy in just 10 minutes
- Monitor performance in all key network locations
- Measure real-time network metrics
- Identify and troubleshoot live network problems

Remember, in today's interconnected world, network reliability and performance are critical for businesses to thrive. Implementing network observability and network monitoring is not just an option but a necessity.


 Obkio Blog


