


Table of Contents
Table of Contents
Discover a truly unbiased list of the top network monitoring tools, where smaller companies aren't overshadowed by promotions or high prices. Our comprehensive guide includes all players in the industry, ensuring a fair comparison for your IT needs, free from financial influence.
Already know everything about network performance monitoring tools and you just need our list? Skip directly with our table of content, but you will be missing out on the best.


As mentioned before, the list of network performance monitoring tools will be split in the following categories:
- Pure Network Performance Monitoring Tools
- Traditional Network Monitoring Tools
- Open-Source Network Monitoring Tools
- All-In-One IT Software Editor
- Packet Capture Based Network Monitoring Tools
In the ever-evolving world of software and technology, it can be challenging to find reliable, unbiased information when searching for the perfect solution. Just like the sponsored listings on travel websites or the clearly marked ads in search results, you'd expect transparency in software listings. Unfortunately, that's not always the case.
Many software lists are primarily promotional, with top positions bought and paid for, often overshadowing smaller, innovative solutions.
These pay-to-play listings put the Davids of the industry at a severe disadvantage against the Goliaths, making it difficult for them to compete for attention. As a result, end-users like you might end up paying the price, quite literally, through expensive licensing fees.
Our goal is to change that. We believe in giving every solution a fair chance, which is why we've created a comprehensive and unbiased guide to network monitoring solutions.

By considering all options, from free and open source to enterprise and mid-size/SMB solutions, we aim to help you make an informed decision that best suits your needs and budget.
If you know everything about network monitoring tools, you can skip to the list. In the following section, we will cover a few.
What is a network monitoring tool? The Key to Optimizing and Securing Your IT Infrastructure 
A network monitoring tool is a tool or a suite of tools designed to monitor, manage, and maintain the performance, availability, and overall health of computer networks. These software solutions continuously track and analyze network devices, such as servers, routers, switches, firewalls, and other hardware components, along with network services and applications.
Network monitoring tools can identify potential issues, bottlenecks, or outages by collecting and analyzing data on various network parameters, including response times, bandwidth usage, and error rates. These tools often provide real-time alerts and notifications to network administrators when performance issues or security threats are detected, allowing for prompt troubleshooting and resolution.
Some key features of network monitoring tool may include:
- Device discovery and mapping: Automatically detect and visualize network devices and their connections.
- Performance monitoring: Measure and analyze network performance metrics, such as latency, throughput, and packet loss.
- Availability monitoring: Ensure network devices and services are up and running, and quickly detect downtimes or network outages.
- Fault management: Identify and diagnose network errors, failures, or performance issues.
- Security monitoring: Detects potential security threats or breaches, and provides alerts to administrators.
- Reporting and analytics: Generate detailed reports and visualizations to help analyze network performance, trends, and issues over time.
By employing network monitoring tools, organizations can proactively manage their networks, minimize downtime, optimize performance, and maintain a secure and efficient IT environment.

Mastering the Network Monitoring Maze: A Fun Guide to Decoding Your Perfect Software Match
In today's complex and dynamic IT environments, network monitoring is essential for maintaining optimal performance and security. There are various types of network monitoring tools available, each designed to address different aspects of network management and provide unique insights.
To help you navigate the landscape and choose the right solution for your needs, we've compiled a comprehensive list of the most common types of network monitoring tool, complete with brief descriptions of each.
Passive Network Monitoring: Passive monitoring tools observe network traffic without actively probing or sending test packets. They collect data by tapping into network devices and analyzing traffic that passes through the network, providing insights into network performance and security without interfering with normal operations.
Active Network Monitoring: Active monitoring tools actively send test packets or requests to network devices or services to measure response times, latency, and availability. This type of monitoring provides a more proactive approach to identifying potential issues before they impact end-users.
SNMP-Based Monitoring: SNMP (Simple Network Management Protocol) is a widely used protocol for network management. SNMP-based monitoring tools gather network performance and device information by polling SNMP-enabled devices, allowing administrators to monitor and manage various network components.

Learn about what SNMP monitoring is & how to use it to monitor performance of networking devices like firewalls, routers, switches and wifi access points.
Learn moreApplication Performance Monitoring (APM): APM tools focus on monitoring the performance and availability of applications running on a network. They track metrics like response times, error rates, and resource usage, helping to ensure that applications meet performance standards and provide a good user experience.
End-User Experience Monitoring Tools: These tools monitor the performance of applications and services from the end-user perspective. By simulating user interactions or capturing real user data, they provide insights into how well applications are performing for users, allowing for targeted improvements.
Synthetic Network Performance Monitoring: Synthetic monitoring tools use scripted transactions or test packets to simulate user interactions or network traffic, providing a controlled way to measure network performance and availability, independent of actual user activity.

Learn how to use synthetic monitoring to monitor network performance & identify network issues, and the benefits of synthetic traffic over packet capture.
Learn moreNetwork Packet Analyzer Tools: Packet analyzers, also known as packet sniffers, capture and analyze individual data packets transmitted over the network. These tools help administrators identify network issues, monitor traffic patterns, and detect security threats or potential bottlenecks.
Flow-Based Network Performance Monitoring: Flow-based monitoring tools analyze network traffic flows, such as NetFlow, sFlow, or IPFIX, to provide insights into bandwidth usage, traffic patterns, and potential congestion points. They help optimize network performance and plan capacity upgrades.
Cloud-Based Network Performance Monitoring: These tools are specifically designed to monitor network performance in cloud environments, such as public, private, or hybrid clouds. They provide visibility into cloud infrastructure, network connectivity, and application performance.
WiFi Performance Monitoring: WiFi monitoring tools focus on the performance and security of wireless networks. They measure signal strength, interference, and connectivity, helping to optimize wireless coverage, capacity, and security.
Agent-Based Monitoring: Agent-based monitoring relies on software agents installed on network devices or servers to collect performance data and report back to a central management console. This approach provides detailed and real-time insights into device performance and health.
Agentless Monitoring: In contrast to agent-based monitoring, agentless monitoring does not require the installation of software agents on network devices. Instead, these tools use existing protocols, like SNMP or WMI, to collect data remotely, providing a less invasive and more flexible monitoring approach.
Unlocking the Network Monitoring Treasure Chest: Fun Features and Fantastic Functionalities Awaiting Your Discovery
Welcome aboard the voyage to uncover the myriad features and functionalities of network monitoring tools. Like a treasure chest brimming with precious gems, these tools are packed with incredible capabilities that can help you navigate the high seas of IT management. Join us as we embark on a thrilling journey to explore the bountiful offerings that network monitoring tools present, ensuring you find the perfect fit for your unique needs.
- Network Device Discovery and Mapping: Automatically detects and maps network devices, visualizing their connections and relationships for easy management.
- Performance Monitoring: Measures and analyzes key network performance metrics, such as latency, throughput, and packet loss, to help maintain optimal network functionality.
- Availability Monitoring: Ensures network devices and services are up and running, and quickly detects downtimes, outages, or performance issues.
- Fault Management: Identifies and diagnoses network errors, failures, or performance issues, allowing for prompt resolution and prevention of future problems.
- Security Monitoring: Detects potential security threats or breaches and provides alerts to administrators, helping maintain a secure network environment.
- Reporting and Analytics: Generates detailed reports and visualizations to help analyze network performance, trends, and issues over time, supporting data-driven decision-making.
- Alerting and Notifications: Sends real-time alerts and notifications to administrators when performance issues, security threats, or other problems are detected, enabling rapid response.
- Bandwidth Monitoring and Analysis: Monitors and analyzes bandwidth usage to identify potential bottlenecks, optimize network capacity, and plan for future upgrades.
- Configuration Management: Tracks and manages network device configurations, ensuring consistency and compliance with organizational policies.
- Root Cause Analysis: Pinpoints the underlying cause of network issues, helping administrators quickly diagnose and resolve problems.
- Traffic Analysis: Monitors and analyzes network traffic patterns, providing insights into user behavior, application performance, and potential congestion points.
- Log Management: Collects, stores, and analyzes log data from network devices and applications, supporting troubleshooting, security analysis, and regulatory compliance.
- SLA Monitoring: Measures and tracks performance against predefined service level agreements (SLAs), ensuring that network services meet or exceed established standards.
- Integration Capabilities: Allows integration with other IT management tools and systems, such as helpdesk, asset management, or ITSM software, streamlining workflows and improving overall efficiency.
- Customizability and Extensibility: Supports customization and expansion to accommodate unique network environments, specific requirements, and changing business needs.
And so, our network monitoring adventure comes to an end, but fear not – the real excitement lies ahead as you implement these features and functionalities to optimize, secure, and maintain your IT environment. Remember, each network monitoring tool is like a treasure chest, filled with an array of dazzling capabilities that can help you sail smoothly through the stormy waters of network management. Choose wisely, intrepid explorer, and may your network be ever-resilient and prosperous!

Riding the Wave of Network Performance Monitoring: Top Trends Shaping the Future of IT Management
Welcome to the exciting world of network performance monitoring, where innovation and technology advancements are continually reshaping the way we manage and optimize our IT environments. In this ever-evolving landscape, staying informed about the latest trends is crucial to staying ahead of the curve and ensuring your network remains efficient, secure, and reliable. Join us as we delve into the top trends in network performance monitoring that are transforming the industry and redefining the future of IT management.
As technology continues to evolve, the trends in network performance monitoring adapt to keep up with the ever-changing IT landscape. Some of the key trends in network performance monitoring include:
- Cloud Monitoring: With the widespread adoption of cloud computing and services, network monitoring tools are increasingly focusing on monitoring cloud-based infrastructure and applications, ensuring optimal performance and reliability in public, private, and hybrid cloud environments.
- AI and Machine Learning: The integration of artificial intelligence (AI) and machine learning (ML) in network monitoring solutions is becoming more prevalent. These technologies enable automated anomaly detection, predictive analytics, and more efficient root cause analysis, resulting in faster and more accurate issue resolution.
- SD-WAN Monitoring: As organizations increasingly adopt software-defined wide-area networks (SD-WAN) to simplify network management and optimize connectivity, network monitoring tools are adapting to provide visibility and performance insights into these complex, virtualized environments.

Find out how SD-WAN monitoring can help you gain visibility into your network & optimize performance. Identify common SD-WAN issues and how to solve them.
Learn more- IoT Monitoring: The rapid growth of the Internet of Things (IoT) has led to an explosion of connected devices on networks. Monitoring tools are evolving to handle the increased complexity and scale introduced by IoT, ensuring the performance and security of these interconnected devices.
- User Experience Monitoring: As user experience becomes a critical differentiator for businesses, network monitoring solutions are placing a greater emphasis on end-user experience monitoring, using real-user or synthetic monitoring techniques to optimize application performance from the user's perspective.
- Network Automation: Automation is playing an increasingly important role in network monitoring and management. By automating routine tasks, such as data collection, alerting, and issue resolution, network monitoring tools help reduce manual effort, improve efficiency, and minimize the risk of human error.
- Security Integration: With the growing number of cyber threats targeting networks, monitoring solutions are integrating more closely with security tools to provide real-time threat detection, analysis, and response capabilities, enabling a proactive approach to network security.
- Hybrid IT Monitoring: As organizations adopt a mix of on-premises, cloud, and edge computing infrastructure, network monitoring solutions must adapt to provide comprehensive visibility and management capabilities across these diverse environments.
- 5G and Edge Monitoring: The emergence of 5G networks and edge computing is driving the need for monitoring solutions that can ensure optimal performance, availability, and security in these high-speed, low-latency environments.
- Customizable and Scalable Solutions: As networks grow and become more complex, organizations require monitoring solutions that can be easily customized and scaled to meet their unique needs and requirements. This trend is driving the demand for flexible, modular monitoring tools that can be tailored to specific environments and use cases.
As we've explored, the dynamic realm of network performance monitoring is influenced by numerous trends that drive innovation and transformation in IT management. By staying abreast of these developments and embracing the latest advancements, you can ensure your network monitoring strategy remains agile, effective, and future-proof. Remember, the key to navigating the fast-paced world of network monitoring lies in understanding and adapting to these emerging trends, empowering you to conquer the challenges of tomorrow and achieve success in the ever-changing IT landscape.

Learn about network performance monitoring to optimize network performance. Discover key network metrics, tools & techniques & the benefits for businesses.
Learn moreNavigating the Network Monitoring Tool: Essential Information for Each Solution
As you embark on your quest to find the perfect network monitoring solution, it's crucial to gather and compare essential information about each option. To help you make the most informed decision, we've done the legwork for you by striving to collect the following key details for each solution featured in our comprehensive list:
- Type of Software: Understanding whether the solution is passive, active, agent-based, agent-less, or any other type of network monitoring tool can help you determine if it's suitable for your specific needs.
- User Interface: Evaluating the user-friendliness, intuitiveness, and overall appearance of the software's interface will ensure that you select a tool that's easy to navigate and manage.
- Top Positive Reviews Comments: Gleaning insights from users who've had positive experiences with the solution can provide valuable information about its strengths and benefits.
- Top Negative Reviews Comments: Learning from users who've encountered challenges or drawbacks with the software can highlight potential areas of concern or improvement. Please be aware that numerous review sites incentivize users to leave reviews, and often only showcase top reviews from select customers, making it crucial to approach reviews with caution. It's also worth noting that negative comments can often provide valuable insights, as they tend to be more truthful and provide a balanced view of the product or service being reviewed.
- Video Demo: Accessing a video demo of the solution can save you time and effort by allowing you to quickly assess its features and capabilities without scheduling multiple demo calls.
- Free Trial: Exploring if the software offers a free trial can enable you to test its features and functionality before committing to a purchase.
- Customer Service and Support: Evaluating the quality and availability of customer service and support can ensure that you select a vendor who will be there to assist you throughout your network monitoring journey.
With this essential information at your fingertips, you'll be well-equipped to navigate the network monitoring landscape and make an informed decision that best aligns with your organization's unique needs and goals. Happy hunting!
The Ultimate Network Monitoring Tool Checklist: Top Criteria for Finding Your Perfect Match
Finally, When evaluating and selecting a network monitoring tool, organizations typically consider several key criteria to ensure the chosen solution meets their needs and requirements. Some of the most frequent criteria include:
- Features and Functionality: The software should offer a comprehensive set of features and capabilities that address the organization's specific network monitoring needs, such as performance monitoring, fault management, and reporting.
- Ease of Use: The software's user interface should be intuitive and user-friendly, making it easy for IT staff to navigate and manage.
- Scalability: The solution should be capable of scaling to accommodate the organization's future growth and changing network requirements.
- Deployment Model: Organizations need to decide whether they prefer a cloud-based SaaS solution or an on-premises deployment, considering factors such as their IT strategy, infrastructure, and security requirements.
- Integration Capabilities: The software should easily integrate with other IT management tools and systems used by the organization, such as helpdesk, asset management, or ITSM software.
- Customizability and Extensibility: The solution should offer customization options to tailor it to the organization's specific requirements and the ability to extend its capabilities as needed.
- Vendor Reputation: The software provider should have a solid track record and reputation in the industry, ensuring reliability and credibility.
- Pricing and Budget: The cost of the solution, including licensing fees, subscription costs, and any additional expenses, should align with the organization's budget.
- Support and Customer Service: The vendor should offer prompt and reliable customer support, including technical assistance, troubleshooting, and training resources.
- Security and Compliance: The software should adhere to industry-standard security measures and help the organization maintain compliance with relevant regulations and policies.
- Reviews and Testimonials: Reading user reviews and testimonials can provide valuable insights into the software's strengths and weaknesses, as well as the quality of the vendor's customer support.
- Free Trial or Demo: The availability of a free trial or demo can help organizations assess the software's features and usability before committing to a purchase.
By carefully evaluating these criteria, organizations can make an informed decision when selecting a network monitoring tool that best meets their needs and requirements.
Having spent a decade in the software industry, I'd like to offer a two-cent piece of advice: Look for a solution that enables you to get started quickly with minimal implementation costs, allowing you to create a solid prototype of the solution. This approach will enable you to test the prototype, various scenarios, and truly determine if the software meets your needs and has the potential to grow with your business.
By focusing on rapid implementation and real-world testing, you can make a more informed decision and ensure that the selected solution aligns with your organization's goals and requirements.
Network Monitoring Market Segmentation Made Fun: What Pizza Can Teach Us About Network Monitoring
The NPM market is a bit like a pizza parlor. Comparison Sites tries to categorize players based on the type of pizza they offer, but let's face it - most vendors have their own spin on things.
We have our own way of looking at things. We've divided the Network Monitoring market into five segments, and it's kind of like ordering a pizza:
First up, we've got the "Traditional Players." These guys have been around for a while and used to be all about monitoring the infrastructure - kind of like how traditional pizza places used to only offer plain cheese or pepperoni. They've adapted to meet new market demands, but sometimes their solutions can fall a little short (kind of like a pizza with too much sauce).
Next, we've got the Open Source solutions. These are like making your own pizza at home - it might not be as fancy as the commercial options, but it gets the job done and it's easy on the wallet.
Moving on to the "Pure Play NPM Players". These guys are like the fancy artisanal pizza places - they focus on network performance from an end-user perspective and use all kinds of high-tech ingredients like agent-based solutions and synthetic testing. They're designed for performance and they look pretty cool too.
Then we've got the "Embedded Monitoring Features" segment. These are like the toppings that come with your pizza - sure, they're there, but they might not offer the level of customization or visibility that you need.
Last but not least, we've got the "Large Players" segment. These guys are like the pizza chains - they offer a whole suite of software solutions, with NPM just being one small piece of the puzzle.
And let's not forget about the packet-based technology solutions. These are like the gourmet, wood-fired pizza ovens - they require a lot of specialized equipment and expertise, but when you need them, they're the best of the best.
So there you have it, folks - the NPM market, broken down into pizza terms.
The Unbiased List of Every Network Monitoring Solutions for All Scenarios
Welcome, dear readers, to the moment you've been waiting for – the grand unveiling of our comprehensive and unbiased list, "The Unbiased List of Every Network Monitoring Solutions for All Scenarios." With countless options available in the world of network monitoring, we understand that finding the perfect solution for your unique needs can be a daunting task. Fear not, for we have meticulously researched and compiled this extensive list to help you navigate the sea of network monitoring tools.
So, buckle up and join us on this exciting journey as we explore the wide array of network monitoring solutions tailored for all scenarios, ensuring that you find your perfect match!
For network monitoring tool Vendors: If you represent a network monitoring tool that is not listed or want to improve your current listing, feel free to send your information to info@obkio.com.
For Customers:
I want to acknowledge that we have placed our own company at the top of this list as this market assessment took us weeks to collect all the data and conduct thorough evaluations. This is my biased part, but we stand by our expertise and the quality of our research and assessment process.

To provide a comprehensive and accurate list of network monitoring solutions, we have collected information available from the vendor website, information they agreed to share (we tried) and information available on other websites. This information has been carefully compiled. We believe that this approach helps to provide an unbiased and informative overview of the various solutions available in the market.
For each Network Monitoring Tool, I spent multiple hours to collect the following information:
- Support: Details about the customer service options provided by the Network Monitoring Tool, including technical support, documentation, and training.
- User Interface: Screenshots of the Network Monitoring Tool user interface to provide an idea of its design and layout.
- User Reviews: Feedback from the Network Monitoring Tool users on top platforms to help assess the platform's strengths and weaknesses.
- Demo Video: A video showcasing the Network Monitoring Tool' features and functionality to give a better understanding of what the platform can do.
We apologize in advance if some vendors have a shorter section due to limited public information and delayed responses. We made every effort to gather as much information as possible.
As mentioned before, the list will be split in the following categories:
- Pure Network Performance Monitoring
- Traditional Network Monitoring
- Open-Source Network Monitoring
- All-In-One IT Software Editor
- Packet Capture Based Network Monitoring
Part 1: Maximizing Network Performance: The 6 Best Pure Network Performance Monitoring (NPM) Tools
When it comes to network performance monitoring, pure-play NPM solutions offer a specialized approach that sets them apart from other IT management platforms. These solutions focus solely on network performance monitoring and provide advanced analytics and reporting capabilities to help organizations make informed decisions about their network infrastructure.
In this section, we'll explore the best 6 pure NPM tools that specialize in network performance monitoring with agent-based solutions and synthetic testing. These tools leverage application, infrastructure, and network monitoring to diagnose and troubleshoot issues in real-time. Each of these solutions offers unique features and capabilities that differentiate themselves based on the complexity of the solution.
Let's take a closer look at what makes these 6 pure NPM tools stand out and how they can help organizations maximize their network performance.
1. Obkio: A Synthetic Cloud-Based Network Monitoring Tool
Obkio is a cloud-based network performance monitoring and testing platform that helps organizations monitor the performance of their network infrastructure and applications. With Obkio, users can monitor network metrics, including latency, packet loss, and network jitter, and troubleshoot network issues in real-time to ensure optimal network performance.
The Obkio platform includes multiple network monitoring tools, such as active and passive monitoring agents, network path monitoring, and cloud network monitoring, that help users identify and diagnose network issues quickly. The platform's user-friendly interface provides real-time insights into network performance, enabling users to detect and address issues before they impact end-users.

Obkio is designed to be easy to deploy and use, with a simple setup process and an intuitive interface that requires minimal training. The platform is suitable for organizations of all sizes and can be used across various industries, including professional services, manufacturing, finance and more.
Overall, Obkio is an effective and reliable network performance monitoring tool that can help organizations proactively manage their network infrastructure and ensure optimal performance for end-users.
1.1.1 Obkio’s Positioning
Moving on to the "Pure Play NPM Players."
These are like the fancy artisanal pizza places of the NPM market - they focus on network performance from an end-user perspective and use all kinds of high-tech ingredients like agent-based solutions and synthetic testing to deliver a top-notch experience.

Obkio is a proud member of this group, leveraging their 20 years of experience in the telecom industry and 5 years of active presence in the NPM market to provide a modern and comprehensive network performance monitoring tool.
With their sleek and user-friendly interface, customizable templates, and deep insights into network performance, Obkio is designed for performance and looks pretty cool too.
Whether you're looking to optimize performance or prevent downtime, Obkio is a pure play NPM player that can satisfy even the most discerning diners.

1.1.2 Obkio’s Pricing Model
Obkio's pricing information is available on their website. They offer a range of pricing plans based on the number of agents required to monitor a network. The pricing is flexible, and the cost per agent decreases as the number of agents increases. Additionally, Obkio offers a free trial for organizations to test out the platform and determine if it meets their needs before committing to a paid plan.
- Free : 2 Agents | 1 Device | 1 User (Limited Functionality)
- $399 / month : 10 Agents | 5 Devices | 2 Users
- $699 / month : 10 Agents | 10 Devices | 5 Users
- Additional Fees for Additional Agent ($39 or $65 / month), Device ($16 or $20 / month) and User ($26 / month)
In fact, you can use Obkio's Price Calculator to build your custom plan, and get a customized quote that you can use for your business' budgetting and planning needs.

Obkio offers good news for its customers: its network performance monitoring solution comes with a straightforward pricing model that requires no hour-long training or assistance from their sales team to understand. We don't have hidden charges or fees, Obkio's pricing is based on a flat monthly fee per monitoring agent, device and users, with no additional costs based on data usage, bandwidth, or other metrics hard to estimate. This transparent pricing model makes it easy for customers to budget for their network monitoring costs without worrying about unexpected charges.
Learn more here : https://obkio.com/pricing/
Free Trial: https://obkio.com/signup/

Obkio's Free 14-Day Trial
To help you start monitoring and troubleshooting network issue in minutes, Obkio offers a free 14-day trial of all their premium features. With the help of Obkio's Onboarding Wizard, users can start collecting performance data and identifying network issues in minutes.
- 14-day free trial of all premium features
- Deploy in just 10 minutes
- Monitor performance in all key network locations
- Measure real-time network metrics
- Identify and troubleshoot live network problems


1.1.3 Obkio’s Customer Service and Support:
We do support a bit differently at Obkio: the same engineers who build Obkio day-in and day-out are the same people you engage with on our support channels.
Documentation & Forums: Check out our Documentation Center for a variety of articles on how Obkio's solutions work. There is also a community-based Forum where you will be able to get some help and participate in discussions.
Support Team: You can also reach our support team at support@obkio.com or by using the chat icon at the bottom right of this page. The Support Team is usually available to chat from Monday to Friday, 9am to 5pm EST, but you can give it a try at any time, you could be surprised!
The support team answered the chat within minutes for a support question.
Dedicated Support: We offer dedicated support options for Enterprise customers. This includes in-depth account analysis with online Zoom meetings for private training and onboarding. Contact us to learn more.
1.1.4 Obkio’s User Interface
The Obkio platform is designed to have a user-friendly interface that makes it easy for users to navigate and access the network monitoring and testing features. The interface is intuitive and provides real-time insights into network performance, enabling users to detect and troubleshoot network issues quickly.


Be guided through how to identify and troubleshoot network problems with Obkio’s Network Monitoring app tour and features through screenshots.
Learn more#### 1.1.6 Positive Reviews Comments for Obkio
"Obkio was very easy to deploy and use, providing detailed network performance visibility without needing access to network equipment."
"Obkio is so user friendly and has so much power in simple views that has not only met our expectations and needs but is giving our organization added value in our Operations and Project teams."
"The team behind Obkio is absolutely amazing and passionate about what they do. Whenever there's something different happening with our servers, they write an email to wave a flag and when we don't understand, they take time to explain the situation."
"The nice part about Obkio cons is that you can discuss these with the Obkio team and they will build those features for you."
"It is priced fairly low for the amount of features you get. Also, they are constantly working on making it better with more features and public agents."
"Accurate internet performance measurement and monitoring Ease of use Ease of deployment Support for Raspberry Pi, Windows and Linux Detailed breakdown of performance issues using weighted scoring."

1.1.7 Obkio’s Demo
If you're interested in seeing Obkio's network monitoring platform in action, a detailed demo is available on their website to guide you through their app.
For a more personalized demo or working session, you can book a one-on-one demo with Obkio's Network Pros! Talk about your enterprise's use case, get network troubleshooting help, and learn about the features you need.

1.2. Kentik
Kentik is a cloud-based network analytics platform that provides real-time insights into network traffic, performance, and security. Kentik collects, processes, and analyzes massive amounts of network data from various sources, such as routers, switches, firewalls, and other network devices.
The platform uses machine learning and advanced algorithms to identify patterns and anomalies in network traffic, allowing network administrators to quickly troubleshoot issues, optimize network performance, and detect security threats.
Kentik offers a range of features, including network visibility and analytics, DDoS protection, peering analytics, cloud visibility, and network security. The platform is used by large enterprises, service providers, and internet companies to monitor and manage their networks.

1.2.1 Kentik Positioning
Kentik offers a comprehensive network performance monitoring tool that includes real-time visibility, monitoring, and analysis of network traffic. Some of the specific types of network performance monitoring offered by Kentik include:
- Traffic analysis: Kentik collects and analyzes network traffic data from various sources, including routers, switches, firewalls, and other network devices. It provides real-time visibility into traffic patterns, usage, and congestion, allowing network administrators to quickly identify and troubleshoot issues.
- Application performance monitoring (APM): Kentik can monitor application performance metrics, such as response times, throughput, and error rates. This allows network administrators to identify and troubleshoot issues related to specific applications.
- Network performance metrics: Kentik offers a wide range of network performance metrics, such as latency, packet loss, and jitter. These metrics can be used to monitor network performance and identify potential issues before they impact end-users.
- Network availability monitoring: Kentik can monitor network availability and uptime, alerting administrators when there is a network outage or issue.
Overall, Kentik's network performance monitoring tool provides real-time visibility and insights into network performance, allowing organizations to optimize their networks and provide a better experience for end-users.
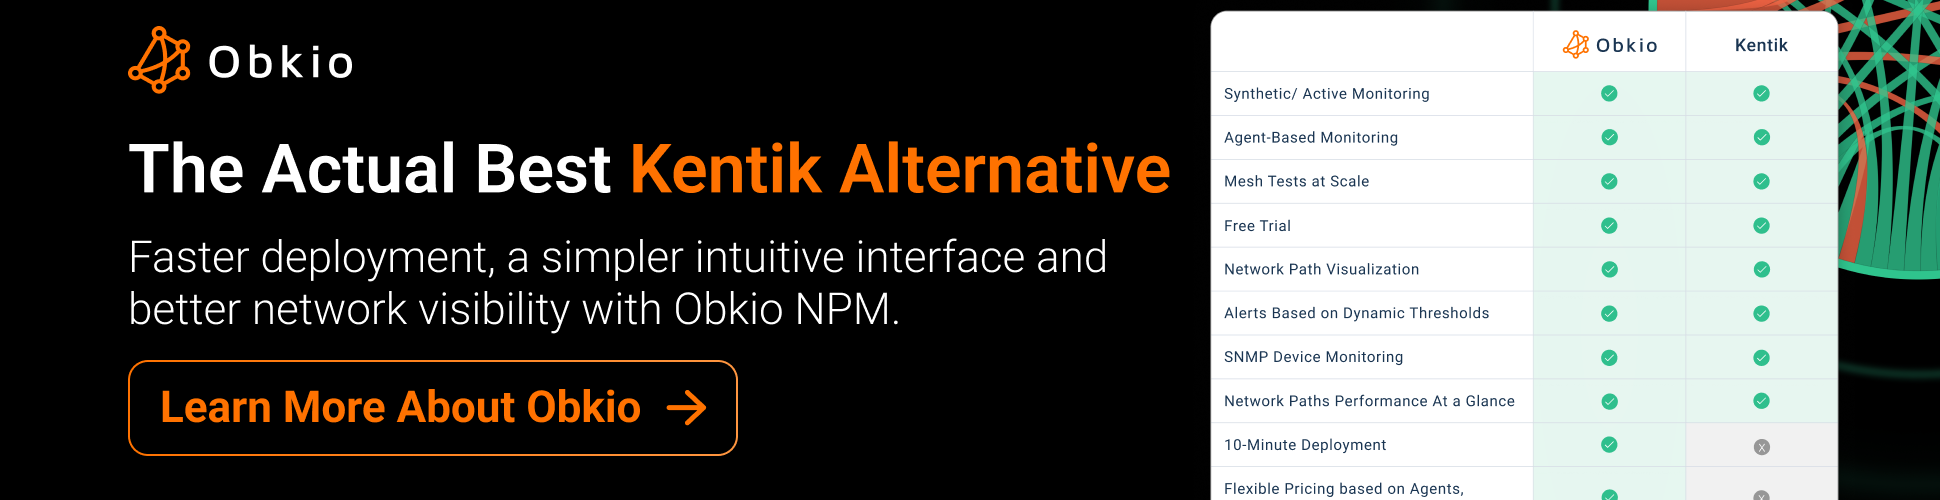
See how Obkio's Network Monitoring tool stands up against Kentik as the #1 Kentik Alternative.
1.2.2 Kentik Customer Service
Kentik offers a range of customer service options to support its users, including:
- Support portal: Kentik's online support portal provides access to a range of resources, including documentation, FAQs, and knowledge base articles. Users can also submit support tickets and track the status of their requests.
- Technical support: Kentik offers 24/7 technical support for its users via email or phone. Users can contact the support team to get help with any issues they are experiencing.
- Onboarding and training: Kentik offers onboarding and training services to help users get started with the platform. This includes personalized training sessions, best practices guides, and workshops.
- Professional services: Kentik's professional services team can provide assistance with customized integrations, data migration, and other specialized services.
Overall, Kentik offers a robust customer service program to ensure its users get the most out of the platform and can quickly and easily get help when needed.
1.2.3 Kentik Network Performance Monitoring User Interface


1.2.4 Kentik Network Performance Monitoring Tool Demo
1.3 ThousandEyes: Network Performance Monitoring Tool
Cisco is now refering to ThousandEyes for their Network Monitoring. Some functionalities are still within AppDynamics and this is why we included both solutions. We might revise the article to combine AppDynamics and ThousandEyes in a future date.
ThousandEyes is a cloud-based network intelligence platform that provides visibility into digital experiences across the internet. The platform uses a combination of endpoint agents and cloud agents to monitor the performance of networks, applications, and services from multiple vantage points around the world.

ThousandEyes can help identify network issues and diagnose problems that can impact the user experience. It is designed to help IT teams improve the performance, availability, and security of their digital services by providing real-time visibility into the network and infrastructure that supports those services.
ThousandEyes was acquired by Cisco in 2020 and is now a part of Cisco's product portfolio.
1.3.1 ThousandEyes Positioning
ThousandEyes is a pure play NPM player focused on delivering network performance monitoring tools to network experts. They use high-tech ingredients like agent-based solutions and synthetic testing to provide real-time visibility into network performance from an end-user perspective.
With their comprehensive insights into network performance, ThousandEyes is designed to satisfy even the most discerning network experts who require in-depth visibility into their network performance.
Whether you're looking to optimize performance, troubleshoot issues, or prevent downtime, ThousandEyes offers a modern and efficient approach to network performance monitoring.

By combining AppDynamics and ThousandEyes, organizations can gain comprehensive visibility into the performance of their applications and networks, from the application layer to the network layer. This can help organizations quickly identify and troubleshoot performance issues, reduce downtime, and optimize application performance for end-users.
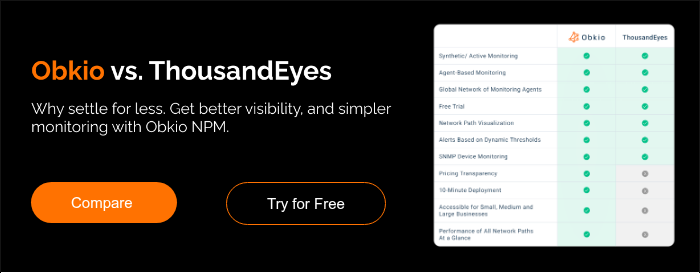
See how Obkio's Network Monitoring tool stands up against ThousandEyes as the best ThousandEyes Alternative.
1.3.2 ThousandEyes Pricing Model
While ThousandEyes provides pricing information on their website, the pricing is not publicly listed and may require a consultation with a sales representative to obtain a specific quote. The pricing for ThousandEyes varies based on the specific needs of each customer and can be influenced by several factors, such as the number of agents and sensors required, the level of support needed, and the features and functionality required.
As a result, ThousandEyes recommends that interested users contact their sales team for a customized quote based on their specific needs.
1.3.3 ThousandEyes Customer Service
ThousandEyes offers a range of customer service options to support their customers. These options include:
- Technical Support: ThousandEyes provides technical support to help customers troubleshoot any issues they may encounter while using the platform. Customers can submit support requests through the ThousandEyes support portal or contact the support team by phone or email.
- Documentation: ThousandEyes provides extensive documentation to help customers learn how to use the platform effectively. This documentation includes user guides, best practices, and technical references.
- Training: ThousandEyes offers training programs to help customers get the most out of the platform. These programs include instructor-led training, self-paced online courses, and certification programs.
- Community: ThousandEyes has an active community of users who share knowledge and collaborate on issues related to the platform. The community includes discussion forums, knowledge bases, and user groups.
- Professional Services: ThousandEyes offers professional services to help customers with specific projects or initiatives. These services include consulting, implementation, and customization.
Overall, ThousandEyes is committed to providing high-quality customer service and support to help customers get the most out of the platform.
1.3.4 ThousandEyes User Interface
ThousandEyes has a modern and intuitive user interface that is designed to provide easy access to its network intelligence capabilities. The platform's interface is clean and organized, with a dashboard that provides a quick overview of network performance and key metrics.
The interface allows users to view and analyze network data from different perspectives, such as network topology maps, application flows, and device inventories. Users can also create custom dashboards and reports to focus on specific areas of interest.
ThousandEyes also offers a variety of visualizations, including graphs, charts, and maps, to help users understand and interpret network performance data. The platform provides real-time visibility into network performance, allowing users to quickly identify and troubleshoot issues.
Overall, ThousandEyes' interface is user-friendly and designed to provide a comprehensive view of network performance and security. Its ease of use and powerful features make it a popular choice for IT teams looking for a solution to monitor their digital services and infrastructure.


1.3.5 ThousandEyes Positive Reviews
"ThousandEyes has been very useful to identify network issues. It gives a complete overview concerning the path that the traffic takes through the service provider infrastructure."
"I like the ability to drill down into alerting at a very granular level and apply logic to cut down on the amount of noise in our alerting."
"Ease of set up and data collection. Standard scripting method used for synthetics. Secret sauce seems to be the ISP / Service Provider / LEC based latency detection all through the service delivery path. Good volume of Cloud agents representing global locations."
"The tool's capabilities are helpful for us in determining bottlenecks in our customer-facing applications."
1.3.6 ThousandEyes Demo
1.4. Catchpoint
Catchpoint is a digital experience monitoring (DEM) platform that provides real-time insights into the performance of web and mobile applications, networks, and services from multiple locations around the world.
The platform allows organizations to monitor their digital services and detect and troubleshoot issues before they impact end-users.

Catchpoint's monitoring capabilities include website performance monitoring, network monitoring, synthetic transaction monitoring, real user monitoring, and API monitoring. The platform provides granular data on performance metrics such as page load times, DNS resolution times, network latency, and server response times. Catchpoint's customers include some of the world's largest enterprises, including LinkedIn, Comcast, and Adobe.
1.4.1 Catchpoint Positioning
Catchpoint offers network performance monitoring through several types of monitoring agents, which are distributed globally across multiple cloud providers, ISPs, and data centers. These agents can monitor network performance from multiple vantage points, including within the enterprise network, at the edge, and in the cloud.
Catchpoint's network performance monitoring includes the following types:
- TCP Traceroute: Catchpoint's TCP Traceroute provides visibility into the network path between the client and server, identifying any latency or packet loss issues along the way.
- Network Path Visualization: This feature provides a graphical representation of the network path between the client and server, including details such as hop-by-hop latency and packet loss.
- DNS Monitoring: Catchpoint's DNS monitoring provides visibility into DNS resolution times and the health of the DNS infrastructure.
- Network Device Monitoring: This feature allows IT teams to monitor the performance of network devices such as routers, switches, and firewalls, and receive alerts when performance issues arise.
- Network Topology Mapping: This feature provides a visual representation of the enterprise network topology, allowing IT teams to quickly identify network performance issues and their impact on business services.
Overall, Catchpoint's network performance monitoring provides IT teams with the visibility and insights needed to optimize network performance, reduce network downtime, and improve the user experience.

1.4.2 Catchpoint Pricing Model
Catchpoint's pricing is not publicly available on their website. The company offers a range of plans and pricing options depending on the specific needs of each customer. Pricing is based on factors such as the number of monitoring agents, frequency of monitoring, and types of monitoring required.
1.4.3 Catchpoint Customer Service
Catchpoint provides customer service and support to help customers get the most out of their platform and ensure a positive user experience. The company offers several resources to support their customers, including:
Technical Support: Catchpoint offers technical support through a dedicated support team that is available 24/7 to help customers with any issues or questions related to the platform. Customers can access support via phone, email, or chat.
Customer Success: Catchpoint's Customer Success team works closely with customers to ensure they are achieving their desired outcomes and getting maximum value from the platform. The team provides guidance on best practices and helps customers optimize their monitoring and alerting configurations.
Professional Services: Catchpoint offers a range of professional services to help customers implement and customize the platform to meet their specific needs. These services include onboarding, configuration, integration, and consulting.
Knowledge Base: Catchpoint's Knowledge Base is a comprehensive library of resources that includes user guides, best practices, and troubleshooting tips to help customers maximize the value of the platform.
Overall, Catchpoint's customer service and support are designed to help customers achieve their digital experience monitoring goals and ensure they are getting the most value out of the platform.
1.4.4 Catchpoint User Interface


1.4.5 Positive Reviews/Comments
"Very flexible to use product, lots of API possibilities."
"It is a powerful tool-It has many useful functionalities -It has support for different kinds of test -It has an excellent support team."
"Easy to use. No prior knowledge is needed. Easily integrates with multiple services and systems."
1.4.6 Catchpoint Demo
Experience the power of the Catchpoint platform in action! This demo provides an overview of Catchpoint's real-time visibility into global monitoring networks and its various platform dashboards. You'll discover how monitoring teams can leverage Catchpoint to perform synthetic tests, analyze real-time user data, and monitor full network performance to optimize the user experience.
1.5. AppNeta
AppNeta is a software company that provides network performance monitoring and troubleshooting solutions for enterprise IT teams. Its cloud-based platform, called AppNeta Performance Manager, allows businesses to monitor the performance of their applications and networks from end-to-end, from the user's device to the application server and back.

AppNeta's platform uses a combination of active and passive monitoring techniques to provide real-time visibility into application performance across a variety of network environments, including cloud, SaaS, and on-premises. The platform also includes features for network troubleshooting, network path analysis, and packet capture analysis.
Overall, AppNeta aims to help IT teams proactively identify and resolve network and application performance issues before they impact end-users, thereby improving the user experience and minimizing business disruption.
1.5.1 AppNeta Positioning
AppNeta's network performance monitoring (NPM) is based on a combination of active and passive monitoring techniques that provide real-time visibility into the performance of a network and its associated applications.
Active monitoring involves sending test traffic across the network to measure performance metrics such as latency, packet loss, and jitter. AppNeta uses its proprietary technology called "FlowView" to perform active monitoring. FlowView is a lightweight, network-based protocol that analyzes application flows and delivers real-time visibility into network performance.
Passive monitoring involves collecting data from the network without sending any test traffic. AppNeta uses a passive monitoring technique called "PacketTrace" to capture and analyze network packets. PacketTrace captures packets from network segments and provides a detailed analysis of application flows, network conversations, and device-level statistics.
AppNeta's NPM solution combines both active and passive monitoring techniques to provide end-to-end visibility into network performance. The platform collects and correlates data from different sources, including application performance metrics, network flow data, packet data, and device-level statistics. The data is then analyzed and presented in a centralized dashboard, allowing IT teams to quickly identify and troubleshoot network performance issues.
See how Obkio's Network Monitoring tool stands up against Appneta as the ultimate Appneta Alternative.

1.5.2 AppNeta Pricing Model
AppNeta's pricing is not publicly available on their website, as it is based on a number of factors including the size of the organization, the number of applications being monitored, the number of locations being monitored, and the level of support required.
However, AppNeta offers a free trial for interested customers to try out their platform before committing to a purchase. The trial period typically lasts for 14 days and allows customers to test out the full range of features and functionality of the platform.
1.5.3 AppNeta Customer Service
AppNeta offers a range of customer services to support its network performance monitoring and troubleshooting solutions. These services include:
Technical Support: AppNeta provides technical support to its customers via phone and email during business hours, Monday through Friday. Their support team is staffed with knowledgeable technicians who can help customers troubleshoot and resolve issues related to the AppNeta platform.
Training and Onboarding: AppNeta offers training and onboarding services to help new customers get up and running with their platform quickly and efficiently. This includes personalized training sessions, documentation, and resources to help users get the most out of the platform.
Professional Services: AppNeta offers professional services to help customers with more complex deployments or custom integrations. This includes assistance with installation, configuration, and customization of the platform to meet specific business needs.
Community Support: AppNeta maintains an online community forum where customers can connect with each other, ask questions, and share best practices. The community is moderated by AppNeta staff and is a valuable resource for customers to learn from each other and get help.
Overall, AppNeta is committed to providing excellent customer service and support to help its customers maximize the value of their network performance monitoring and troubleshooting solutions.
1.5.4 AppNeta User Interface


1.5.5 AppNeta User Reviews
"The synthetic traffic with auto diagnostics. The multi route path creation and analysis is very useful."
"In particular, TraceView helps to quickly identify trends in the performance. It helps to track, isolate or fix the outliers affecting application performance. The ability to monitor the application at all levels in the application stack is amazing."
1.5.6 AppNeta Demo
1.6. LiveAction
LiveAction is a software company that offers a network performance monitoring tool called LiveNX. LiveNX provides real-time monitoring and analysis of network performance metrics, such as bandwidth utilization, packet loss, latency, and jitter.
With LiveNX, network administrators can gain visibility into their network infrastructure, troubleshoot performance issues, and optimize network performance. The tool uses flow data from devices across the network to provide insights into network traffic and application performance.
LiveNX also offers features such as network topology mapping, device discovery, and automated alerts to help network administrators proactively monitor and manage their network infrastructure. It is compatible with a wide range of network devices and can be deployed on-premises or in the cloud.

1.6.1 LiveAction Positioning
You probably know that network performance monitoring involves collecting and analyzing data about network traffic and device performance to identify issues and optimize performance. LiveNX from LiveAction does network performance monitoring by collecting flow data from network devices, analyzing it, and presenting it in a user-friendly interface.
Here are some of the key features of LiveNX that make it an effective network performance monitoring tool:
Flow data collection: LiveNX collects flow data from network devices such as routers and switches, which provides visibility into network traffic and application performance.
Real-time monitoring: LiveNX provides real-time monitoring of network performance metrics, such as bandwidth utilization, packet loss, latency, and jitter, so you can quickly identify and address issues as they arise.
Network topology mapping: LiveNX automatically discovers and maps the network topology, allowing you to see how devices are connected and how traffic flows through the network.
Automated alerts: LiveNX can be configured to generate automated alerts based on predefined thresholds for network performance metrics, so you can be alerted to potential issues before they become major problems.
Historical data analysis: LiveNX stores historical flow data, allowing you to analyze trends and identify patterns in network performance over time.
Application performance analysis: LiveNX can also analyze flow data to provide insight into application performance, including identifying which applications are using the most bandwidth and which are causing performance issues.
Overall, LiveNX provides network engineers with the tools they need to monitor and optimize network performance, helping to ensure that the network is running smoothly and efficiently.
1.6.2 LiveAction Pricing Model
LiveAction LiveNX pricing is not publicly available on their website, as it is customized based on the specific needs of each customer. However, you can request a quote from LiveAction by filling out a form on their website or by contacting their sales team directly.
LiveAction offers both perpetual and subscription licensing options for LiveNX, as well as different editions of the tool that vary in features and functionality.
1.5.3 LiveAction Customer Service
LiveAction offers various customer support options to help their customers with technical issues, product questions, and more. Here are some of the customer service offerings provided by LiveAction:
- Technical support: LiveAction provides 24/7 technical support to customers with an active maintenance contract. Customers can contact the support team through phone, email, or the LiveAction support portal.
- Customer success: LiveAction has a dedicated customer success team that helps customers with product onboarding, training, and adoption. This team works closely with customers to ensure they are getting the most value out of LiveAction's products.
- Professional services: LiveAction offers professional services to help customers with deployment, configuration, and customization of their products. These services are provided by LiveAction's certified engineers and can be tailored to meet the specific needs of each customer.
- Knowledge base: LiveAction has an extensive knowledge base that includes product documentation, training videos, FAQs, and more. Customers can access this information through the LiveAction support portal.
- Community forum: LiveAction has an online community forum where customers can share their experiences, ask questions, and get advice from other LiveAction users.
Overall, LiveAction is committed to providing excellent customer service and support to help their customers succeed with their products.
1.5.4 LiveAction User Interface


1.5.5 LiveAction User Reviews
"Ease of use. LiveAction allows us to track down network issues very easily. We have found and resolved at least 50 problems while using this product since it was implemented."
"Easy to use, easy to set up and works. Within a few hours of setting up the demo of the service and adding a few devices, we found an asymmetric routing issue we weren't even aware of."
"Fat client interface is still available so we are not forced to use a WebGUI like so many other vendors."
1.5.6 LiveAction Demo
Part 2: Trusted Network Monitoring: 8 Best IT Management Platforms and Network Monitoring Tools
Managing an organization's IT infrastructure is like being the captain of a massive ship. And just like a ship needs a whole crew to keep it running smoothly, an organization needs a variety of tools to manage its IT infrastructure effectively. That's where IT management platforms come in - they're like the superheroes of the network management world, with the power to manage various aspects of an organization's IT infrastructure.
But when it comes to network monitoring specifically, sometimes you need a superhero with a little extra something - like Superman's x-ray vision or Iron Man's high-tech suit. That's where the best network monitoring tools come in - they're the sidekicks that help IT management platforms take their network monitoring game to the next level.
In this section, we'll explore the 8 best IT management platforms or traditional network monitoring tools that have earned their reputation as trusted superheroes of network monitoring. Sure, implementing NPM within these larger suites can be complex and costly, but with these tools, the payoff is worth it. So, grab your cape and let's dive into what makes these 9 trusted network monitoring tools stand out and how they can help organizations keep their network running like a well-oiled machine.

Discover the superheroes of network monitoring tools in our comprehensive guide. Unveil the perfect type of network monitoring tool for your business.
Learn more2.1 PRTG Network Monitor
PRTG Network Monitor offers three different solutions for network monitoring, which are:
PRTG Network Monitor: This is the core network monitoring solution, which provides real-time monitoring and alerts for network devices, applications, and servers. It can monitor network performance, bandwidth usage, and availability, and includes customizable dashboards, reports, and notifications.
PRTG Enterprise Monitor: This solution is designed for large, complex IT environments, and provides advanced features for distributed monitoring, load balancing, and failover. It can monitor multiple PRTG instances and provide a centralized view of network performance across different locations.
PRTG Hosted Monitor: This is a cloud-based network monitoring solution that provides real-time monitoring and alerts for networks, servers, and applications. Hosted on Paessler's servers, it is a fully-managed service that eliminates the need for on-premises hardware and infrastructure.

Overall, PRTG's solutions are designed to provide comprehensive network monitoring capabilities for organizations of all sizes, with advanced features and scalability options to meet the needs of larger and more complex environments.
2.1.1 PRTG Positioning
PRTG is a well-established player in the NPM market and positioned as a traditional NPM player with a focus on infrastructure monitoring, including systems and networks.
Their legacy solution has been adapted to meet the evolving needs of the market and offers a broad range of monitoring tools to help organizations identify issues, troubleshoot problems, and optimize network performance.
PRTG's solutions are based on traditional network monitoring protocols such as SNMP, Flow-Based, and ICMP, which may not provide the comprehensive insights and visibility required to optimize network performance in complex IT environments.
While PRTG has updated its recipe to keep up with the times, their approach remains focused on delivering reliable infrastructure monitoring solutions.

2.1.2 PRTG Pricing Model
PRTG's pricing model is based on the number of sensors required for monitoring. A sensor is defined as one aspect of a device that can be monitored, such as CPU usage, bandwidth, or response time. They also also offer a 30-day free trial of their paid plans, allowing potential customers to test the platform and determine which plan is best for their needs.
2.1.3 PRTG Customer Service
PRTG offers a range of customer service options to support their customers. These options include:
- Technical Support: PRTG provides technical support to help customers troubleshoot any issues they may encounter while using the platform. Customers can submit support requests through the PRTG support portal or contact the support team by phone or email.
- Documentation: PRTG provides extensive documentation to help customers learn how to use the platform effectively. This documentation includes user manuals, guides, knowledge base articles, and video tutorials.
- Knowledge Base: PRTG has a knowledge base that provides answers to frequently asked questions and troubleshooting tips.
- Community: PRTG has an active community of users who share knowledge and collaborate on issues related to the platform. The community includes discussion forums, knowledge bases, and user groups.
- Training: PRTG offers training programs to help customers get the most out of the platform. These programs include instructor-led training, self-paced online courses, and certification programs.
- Professional Services: PRTG offers professional services to help customers with specific projects or initiatives. These services include consulting, implementation, and customization.
- Maintenance and Updates: PRTG provides regular maintenance and updates to ensure the platform is secure and up-to-date with the latest technology and features.
Overall, PRTG is committed to providing high-quality customer service and support to help customers get the most out of the platform. Its range of customer service options and resources are designed to meet the needs of organizations of all sizes and provide a seamless experience with the platform.
2.1.4 PRTG User Interface


2.1.5 PRTG User Reviews
"The feature that I find most appealing about PRTG is that it can be customized according to our requirements and is easy to put into practice."
"The excellent thing about this system is that we don't have to be concerned if we don't receive any notifications; in fact, it implies that everything is well. The user interface is straightforward to use and allows us to set up and modify the monitoring devices and sensors we have to monitor."
"The ability to integrate it with a variety of market solutions, as well as the plethora of interface elements that are already available make it admirable for our business."
2.1.6 PRTG Demo
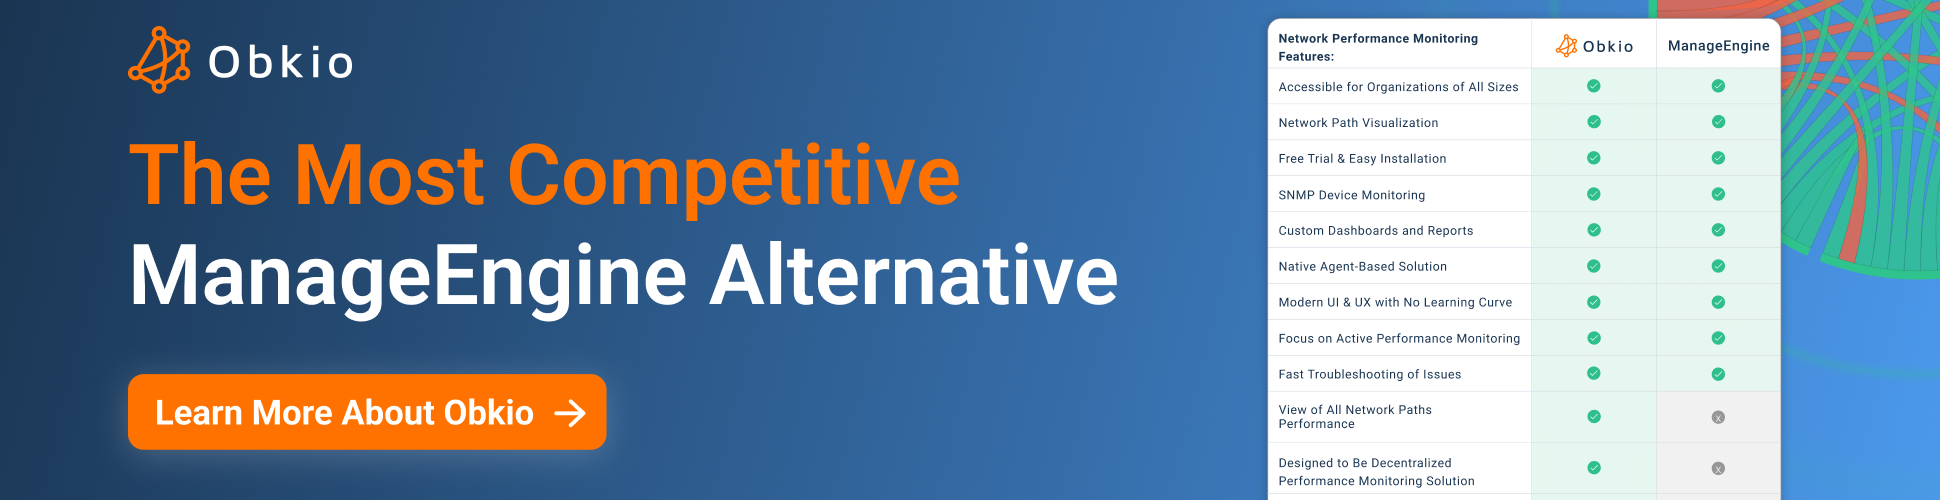
2.2. Manage Engine OPManager
This section aims to provide a specific focus on the network performance monitoring functions of Manage Engine. However, as Manage Engine is a comprehensive software solution offering multiple capabilities, it's important to note that some limitations may exist in terms of the specific details that can be covered.
ManageEngine OpManager is a network performance monitoring (NPM) tool developed by ManageEngine, a division of Zoho Corporation. OpManager provides a comprehensive suite of monitoring tools designed to help organizations optimize their network performance. It offers real-time visibility into network performance, including devices, servers, applications, and bandwidth usage.

OpManager supports a range of protocols, including SNMP, ICMP, WMI, and CLI, to provide a complete view of network performance. It also includes features such as network mapping, threshold-based alerting, custom dashboards, and reports to help organizations quickly identify and resolve issues.
OpManager is designed to be user-friendly and easy to install, making it accessible for organizations of all sizes and technical backgrounds.
2.2.1 Manage Engine OPManager Positioning
ManageEngine is a trusted player in the NPM market, providing a comprehensive suite of network performance monitoring tools to help organizations optimize their IT infrastructure. Their solutions are designed to meet the evolving needs of the market, providing deep insights into network performance to help organizations identify and resolve issues quickly.
ManageEngine offers a range of monitoring protocols, including SNMP, Flow-Based, and ICMP, providing a well-rounded approach to network performance monitoring.
With their user-friendly interface and customizable dashboards, ManageEngine's solutions are accessible for organizations of all sizes and technical backgrounds.
Whether you're looking to improve network performance, troubleshoot issues, or prevent downtime, ManageEngine is a reliable solution for NPM.
If you're looking for a simpler, more affordable alternative, discover how Obkio is the best ManageEngine alternative.
2.2.2 Manage Engine OPManager Pricing Model
OpManager's licensing is based on the number of devices to be monitored, and is a device-based licensing model. This means that the pricing is dependent on the device as a whole, and all its components, such as interfaces, ports, disks, and performance metrics are included in the license by default.
2.2.3 Manage Engine OpManager Customer Service
ManageEngine provides a range of support services to help users get the most out of their network performance monitoring tools. Their support services include online documentation, knowledge base, community forums, and email support. They also offer phone support, chat support, and remote assistance for customers who need immediate assistance with their products.
In addition, ManageEngine offers professional services, such as installation, configuration, and customization, to help organizations optimize their NPM solutions. Their professional services team works closely with customers to understand their requirements and provide customized solutions to meet their specific needs.
Overall, ManageEngine's support services are designed to help customers quickly and easily resolve any issues they may encounter while using their products. Their experienced support team is available around the clock to provide timely and effective assistance to help customers maximize their investment in network performance monitoring.
2.2.4 Manage Engine OPManager User Interface


2.2.5 Manage Engine OPManager User Reviews
"The unified monitoring, easy integration, and alert notification management, the ability to monitor and manage various IT infrastructure components in one product. This makes it a popular choice for many organisation looking to streamline their IT operations and simplify the management of their IT infrastructure."
"Outstanding and quick service/support always available for questions or problems. - Scalability throughout different networks- integration with other services (like SSO from Azure-ad) - high level of details of devices over a long period of time once the initial setup is completed."
"24x7 Real-time Monitoring and always provide true notification or alerts over mail. We can schedule a number of auto generated customized reports which help us get a consolidated standard report, so that it's easy to analyze and investigate problems before the issue arises."
2.2.6 Manage Engine Demo
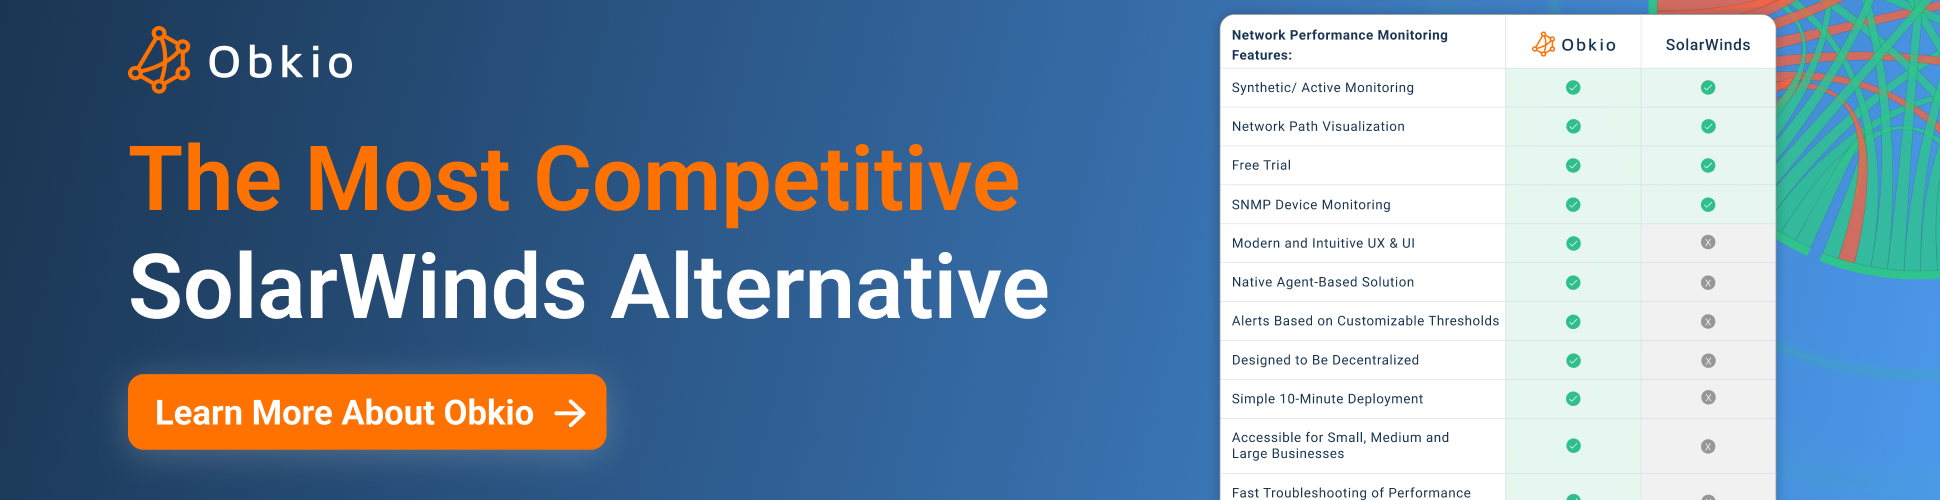
2.3. SolarWinds Network Performance Monitor
SolarWinds Network Performance Monitor (NPM) is a network monitoring tool that provides real-time visibility into network performance and health. With NPM, users can monitor and manage their network infrastructure, identify and troubleshoot issues, and optimize network performance.
SolarWinds Network Performance Monitor is available as both an on-premises solution and a cloud-based SaaS solution. The cloud-based version is called SolarWinds NPM Cloud.

2.3.1 SolarWinds Positioning
SolarWinds is a well-established player in the NPM market, with a legacy solution that was previously known for infrastructure monitoring, including systems and networks. They've adapted their solutions to meet the new needs of the market and have a strong reputation for delivering comprehensive network performance monitoring tools.
However, their reliance on protocols like SNMP, Flow-Based, and ICMP may not always offer the comprehensive insights and visibility required to optimize network performance in complex IT environments.
SolarWinds is positioned as a traditional player who has updated their recipe to keep up with the times, offering a broad range of monitoring tools to help organizations troubleshoot issues, identify areas for improvement, and optimize network performance.
Discover how Obkio stands up against SolarWinds NPM as the simplest, most affordable SolarWinds alternative.
2.3.2 SolarWinds NPM Pricing Model
SolarWinds Network Performance Monitoring pricing is determined based on several factors, including the number of devices being monitored, the level of support required, and the type of license chosen. Additional factors that may affect pricing include the specific features needed, the duration of the license, and any applicable discounts or promotions.
SolarWinds offers a range of pricing options to fit the needs and budget of different organizations, and interested users can contact SolarWinds sales representatives for a customized quote.
2.3.3 SolarWinds Customer Services
SolarWinds offers several support options to assist its customers with technical issues or questions they may have while using their products. Some of the support options available to SolarWinds customers include:
- 24/7 Technical Support: SolarWinds provides round-the-clock technical support via phone, email, and online chat to assist customers with any technical issues they may encounter.
- Product Documentation: SolarWinds offers extensive product documentation, including user guides, installation guides, and knowledge base articles, to help users understand how to use its products.
- Product Training: SolarWinds provides product training courses and webinars to help users get the most out of their products and learn how to use them effectively.
- Customer Success Center: The SolarWinds Customer Success Center is an online community where customers can connect with each other, ask questions, and share best practices.
- Professional Services: SolarWinds also offers professional services to help customers with installation, configuration, and customization of its products.
One potential limitation of SolarWinds is that the sheer amount of information available through its customer success portal can be overwhelming and confusing for a first-time user.
Overall, SolarWinds' support options are designed to provide customers with the assistance they need to get the most out of their products and achieve their IT management goals.
2.3.4 SolarWinds User Interface
SolarWinds offers various IT management tool solutions, each with its own user interface. The user interface is customizable and designed to provide a user-friendly and intuitive experience, with a dashboard that provides a comprehensive view of the network and infrastructure being managed.


SolarWinds also offers a mobile app with a simple and easy-to-use interface for on-the-go monitoring of networks and systems.
2.3.5 SolarWinds User Reviews
"The network map it creates is very helpful for seeing any issues with LAN or WAN links. The dashboards are good and provide the level of information that we would want to see. The Top 10 lists are great for prioritising what the team should focus on."
"UPDATE: The tool is still easy to use, this did not change. Also, reports are customizable fully and this one is a really good part of the tool. Module configuration is easy for even beginner users. Alerts can be integrated into any chat-ops or incident management tools. Reports can be configured in any way …"
"The ease of setup and getting started. NPM works pretty much flawlessly. Reporting is flexible and useful. Agent and SNMP/WMI."
2.3.6 SolarWinds Network Performance Monitoring Demo
2.4 ScienceLogic
ScienceLogic is an IT monitoring tool that allows businesses to gain visibility and control over their IT infrastructure. It provides a unified platform for monitoring and managing both on-premises and cloud-based infrastructure, including servers, networks, storage, applications, and more.
With ScienceLogic, IT teams can gain real-time insights into the performance, availability, and health of their IT infrastructure, as well as proactively identify and resolve issues before they impact end-users. It also enables IT teams to automate routine tasks, reduce manual intervention, and improve the overall efficiency of their operations.

Some of the key features of ScienceLogic include customizable dashboards, advanced analytics, intelligent alerting, automated remediation, and integration with other IT management tools. It is used by businesses of all sizes across various industries, including healthcare, finance, telecommunications, and government agencies.
2.4.1 ScienceLogic Positioning
ScienceLogic offers network performance monitoring as one of its key capabilities. It allows IT teams to gain real-time visibility into network performance and identify potential issues before they impact end-users.
With ScienceLogic's network performance monitoring, you can track network traffic, bandwidth utilization, and other key performance metrics across your entire network infrastructure, including routers, switches, firewalls, and other network devices. It also offers advanced analytics and intelligent alerting to help you quickly identify and resolve network issues.
Additionally, ScienceLogic's network monitoring capabilities can be extended to cover hybrid and multi-cloud environments.
2.4.2 ScienceLogic Pricing
ScienceLogic's pricing varies depending on the pricing tier chosen, the specific features and capabilities you require, as well as the size and complexity of your environment. To get an accurate pricing estimate, it's best to contact ScienceLogic directly and speak with their sales team.
2.4.3 ScienceLogic Customer Services
ScienceLogic offers a range of customer service and support options to help customers get the most out of their IT monitoring and management platform. Some of the key customer service offerings include:
- Technical support - ScienceLogic provides 24/7 technical support to customers via phone, email, and a web-based support portal. Their technical support team is staffed with experienced engineers who can help with a wide range of issues related to the ScienceLogic platform, including installation, configuration, and troubleshooting.
- Professional services - ScienceLogic offers professional services to help customers get up and running with the platform quickly and effectively. Their professional services team can help with everything from initial installation and configuration to ongoing maintenance and optimization.
- Training and certification - ScienceLogic provides a range of training and certification programs to help customers build their skills and expertise with the platform. They offer both online and in-person training options, as well as certification exams to validate knowledge and skills.
- Community and knowledge base - ScienceLogic maintains an online community and knowledge base where customers can connect with other users, share best practices, and access a wealth of resources and documentation related to the platform.
Overall, ScienceLogic is committed to providing excellent customer service and support to help customers achieve their IT monitoring and management goals.
2.4.4 ScienceLogic User Interface


2.4.5 ScienceLogic User Reviews
"Highly capable & broad platform of capabilities, many of which are easily & quickly adoptable at scale & pace."
"SL1 is a very powerful tool and can monitor pretty much what you want it to, it does take a lot of knowledge to get to know the product and what you can make it do but it is a very good tool to have as a MSP."
"Good Monitoring console. its very useful for monitoring the Server utilisation."
2.4.6 ScienceLogic Demo
2.5 LogicMonitor
LogicMonitor is a cloud-based monitoring and analytics platform that allows businesses to monitor their IT infrastructure, applications, and services in real-time. It is designed to help IT operations teams identify and resolve issues before they affect end-users.
The platform collects data from a variety of sources including servers, storage devices, networks, and applications, and presents it in a unified dashboard for easy analysis. LogicMonitor uses a combination of agent-based and agentless monitoring techniques to provide comprehensive coverage of the entire IT infrastructure.

LogicMonitor offers a wide range of features including customizable dashboards, alerting and notifications, automated reporting, predictive analytics, and integrations with popular third-party tools. It is used by businesses of all sizes across a variety of industries including healthcare, finance, retail, and technology.
2.5.1 LogicMonitor Positioning
LogicMonitor offers network performance monitoring as one of its core features. It provides real-time visibility into network performance metrics such as bandwidth utilization, packet loss, latency, and jitter, allowing IT operations teams to quickly identify and troubleshoot network issues.
LogicMonitor uses a combination of agent-based and agentless monitoring techniques to provide comprehensive network monitoring coverage. It supports a wide range of network devices and technologies including routers, switches, firewalls, load balancers, and VPNs, and provides detailed insights into network traffic flows and performance.
Additionally, LogicMonitor also provides network topology mapping capabilities, which helps IT teams to visualize their network infrastructure and identify dependencies between network devices. This can be useful in troubleshooting network issues and planning for network capacity and scalability.
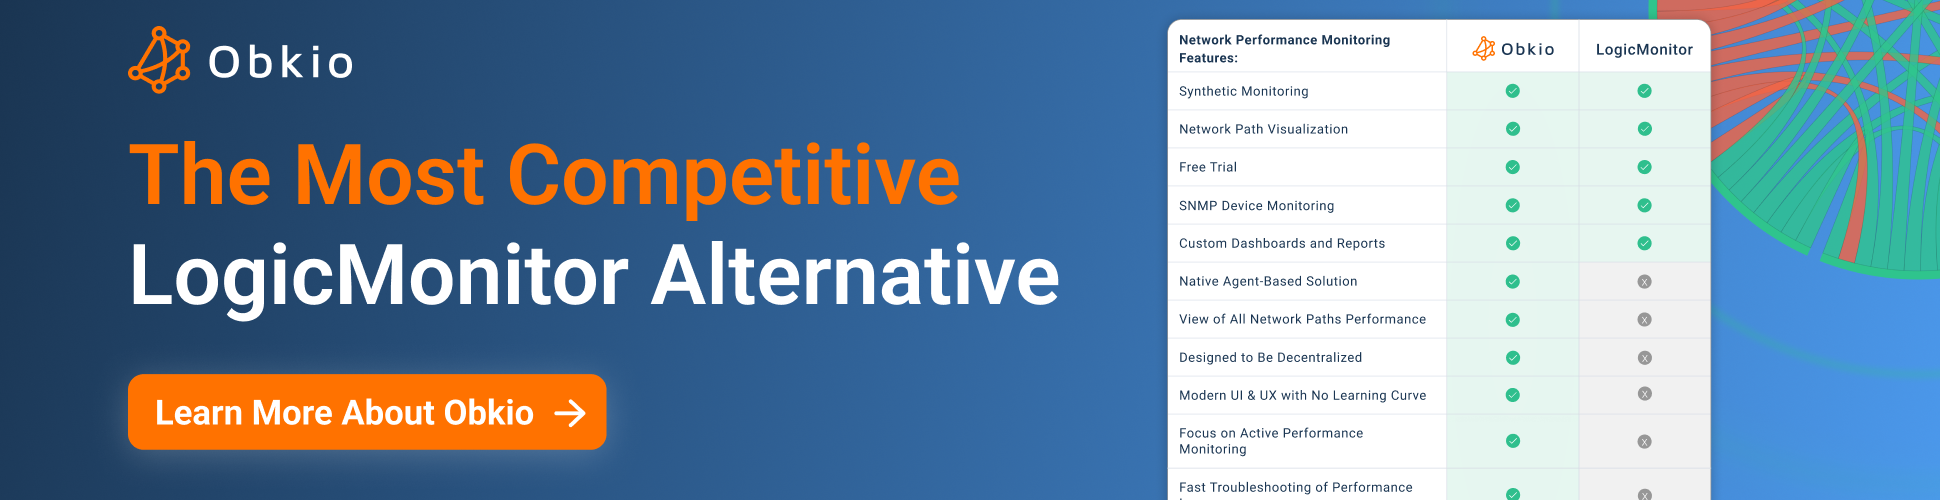
2.5.2 LogicMonitor Pricing
LogicMonitor pricing is not publicly available, and can vary depending on factors such as the number of devices being monitored, the specific features and services included, and the level of support needed. Potential customers should reach out to LogicMonitor directly for a quote based on their specific needs.
2.5.3 LogicMonitor Customer Services
LogicMonitor offers a range of customer service offerings to support network performance monitoring. These include:
- Onboarding: LogicMonitor provides a comprehensive onboarding process that includes a dedicated customer success manager, technical support, and training resources. The onboarding process is designed to ensure that customers are able to quickly and easily get started with network performance monitoring.
- Technical support: LogicMonitor offers technical support services to help customers troubleshoot any issues they may encounter with network performance monitoring. Customers can access technical support via phone, email, or chat, and LogicMonitor's support team is available 24/7 to assist with any issues.
- Training and education: LogicMonitor provides a range of training and education resources to help customers get the most out of network performance monitoring. This includes online training courses, webinars, and documentation.
- Professional services: LogicMonitor also offers professional services to help customers with more complex network monitoring requirements. This can include custom integrations, customized dashboards, and on-site support.
Overall, LogicMonitor is committed to providing excellent customer service and support to help customers get the most out of their network performance monitoring.
2.5.4 LogicMonitor User Interface


2.5.5 LogicMonitor User Reviews
"Easy to use, you can add all the devices you want to monitor from the interface, it is also possible to schedule alerts, the installation is easier than I thought, they have an excellent community behind the project there is a lot of documentation on how to make the most of the software."
"Good mechanics of real-time alerts, monitoring options in the cloud are excellent, the software is interpreted in a good way, the configuration for a good use did not bring problems, analysis and reports of the data collected are very complete."
2.5.6 LogicMonitor Demo
2.6 Auvik
Auvik is a network monitoring and management tool that provides visibility and control over network infrastructure. It is designed to help managed service providers (MSPs) and IT professionals to easily manage and monitor network devices such as routers, switches, firewalls, and servers.
Auvik's tool allows IT professionals to easily identify network issues and automate network management tasks, such as updating firmware and configuration backups. It offers features such as real-time network mapping, automated network discovery, and device monitoring. It also provides detailed insights into network performance, including bandwidth usage, traffic flows, and device performance metrics.

Overall, Auvik helps organizations to streamline network management, reduce downtime, and improve network security by providing a comprehensive network monitoring and management platform.
2.6.1 Auvik Positioning
Auvik provides a comprehensive network performance monitoring platform that includes real-time network mapping, device monitoring, and bandwidth usage tracking. Here are some of the key features of Auvik's network performance monitoring capabilities:
- Real-time network mapping: Auvik's software provides a real-time map of the network, showing all connected devices and their relationships. This helps IT professionals to quickly identify network issues and troubleshoot problems.
- Device monitoring: Auvik continuously monitors network devices such as routers, network switches, firewalls, and servers, and alerts IT professionals if any issues arise. This includes monitoring device health, availability, and performance metrics such as CPU usage, memory usage, and interface utilization.
- Bandwidth usage tracking: Auvik tracks network bandwidth usage in real-time, helping IT professionals to identify and troubleshoot bandwidth-intensive applications that may be causing network congestion (WAN or LAN congestion).
- Network performance metrics: Auvik provides detailed metrics on network performance, including latency, packet loss, and jitter. This helps IT professionals to identify and troubleshoot network performance issues.
Overall, Auvik's network performance monitoring capabilities are designed to help IT professionals to easily manage and monitor their network infrastructure, and quickly identify and resolve issues as they arise.
2.6.2 Auvik Pricing
Auvik's pricing model is based on the number of billable devices, which include routers, switches, firewalls, and controllers. Organizations should always refer to the latest pricing information available on Auvik's website or by contacting their sales team.
2.6.3 Auvik Customer Services
Auvik offers a range of customer services to help organizations get the most out of their network management and monitoring platform. Here are some of the key customer services that Auvik offers:
Technical support: Auvik provides technical support to help customers troubleshoot issues and resolve problems quickly. Their support team is available 24/7 via phone, email, and chat.
Onboarding and training: Auvik offers onboarding and training services to help organizations get up and running with the platform quickly. This includes personalized onboarding sessions, access to training resources, and ongoing support.
Account management: Auvik provides dedicated account management for its customers, with a designated account manager who serves as a single point of contact for all customer needs and requirements.
Community forum: Auvik offers a community forum where customers can connect with other users, ask questions, and share best practices for using the platform.
Feature requests: Auvik welcomes feature requests from its customers and actively solicits feedback to improve the platform and add new functionality.
Overall, Auvik's customer services are designed to help organizations get the most out of their network monitoring and management platform, and to provide the support and resources needed to ensure success.
2.6.4 Auvik User Interface

2.6.5 Auvik User Reviews
"Really solid network mapping and SNMP monitoring platform. Very easy to implement with lots of out of the box deployment options. Good Visual Mapping of product."
"It's provided me valuable insight into how our network topology looks and functions."
"The overview of the entire network environment has been a game-changer for my role at my company. It provides me insight into my client's settings so I can confidently answer their questions on their network and it is also really useful to have that whole map that generates for the business. While it is not used every day by other people on my team, we do have it integrated into other platforms that can notify us of any potential outages with devices."
2.6.6 Auvik Demo
2.7 Icinga
Icinga is an open-source monitoring tool used for monitoring network infrastructure, applications, and services. It provides real-time monitoring, alerting, and reporting of network resources and can be used to monitor various devices such as servers, switches, routers, and applications.
Icinga was created as a fork of Nagios, a well-known open-source monitoring tool. Icinga offers additional features and improvements over Nagios, including a modern web interface, better scalability, and improved performance.

Some of the key features of Icinga include:
- Monitoring of network services, hosts, and applications
- Customizable alerting and notification system
- Integration with various third-party tools and services
- Support for a wide range of plugins and addons
- Role-based access control and user management
- Automated deployment and configuration management
Icinga is used by small to large enterprises, service providers, and IT professionals to monitor and manage their IT infrastructure. It is available as a free, open-source tool with community support, and also as a commercial product with professional support and additional features.
2.7.1 Icinga Positioning
Icinga offers a comprehensive network monitoring tool that provides real-time monitoring and alerting of network infrastructure, services, and applications. Icinga can monitor various types of network performance metrics, including:
- Host availability and response time: Icinga can monitor the availability and response time of hosts, such as servers, switches, routers, and other network devices. It can also monitor the availability and response time of applications running on those hosts.
- Network bandwidth usage: Icinga can monitor network bandwidth usage to identify bottlenecks, congestion, and bandwidth utilization trends. It can also provide alerts when network bandwidth usage exceeds predefined thresholds.
- Network device performance: Icinga can monitor the performance of network devices, such as switches and routers, to identify issues related to device utilization, CPU and memory usage, and interface errors.
- Application performance: Icinga can monitor the performance of various applications, including web applications, databases, and other custom applications. It can monitor application response times, database query performance, and other application-specific metrics.
- Custom performance metrics: Icinga can also monitor custom performance metrics using plugins or custom scripts. This allows users to monitor any performance metric that is relevant to their specific environment.
Icinga offers a range of monitoring plugins and add-ons that can be used to monitor various network performance metrics. The platform also provides customizable alerting and notification features to quickly alert users when network performance issues are detected.

2.7.2 Icinga Pricing
Icinga is free to use and offers a support plan for customers. There is no pricing available for Icinga support.
Repository Subscription: The Icinga Repository Subscription includes packages for additional operating systems and additional tools to extend Icinga. There is no limitation in the number of installations.
Additional Packages: Icinga supports and provides free of charge operating system specific packages to clients and the community.
2.7.3 Icinga Customer Services
Icinga provides several customer service options to support its users, including:
- Community support: Icinga has a large and active community of users who provide support, advice, conference, meetups and guidance through online forums, mailing lists, and chat rooms.
- Documentation: Icinga provides comprehensive documentation, including user guides, installation guides, and API documentation, to help users get started with the platform.
- Professional services: Icinga offers professional services to help users with customized integrations, deployment, and configuration management. These services include consulting, training, and custom development.
- Technical support: Icinga offers professional technical support to its users, including email and phone support. The support team can provide help with installation, configuration, and troubleshooting issues.
Overall, Icinga provides a range of customer service options to support its users, including community support, documentation, professional services, and technical support. Users can choose the level of support that best fits their needs and budget.
2.7.4 Icinga User Interface


2.7.5 Icinga User Reviews
"Icinga works great in real-time monitoring and can be easily integrated with other tools (Slack, emails, etc.) for notifications."
"As an open source project, Icinga offers a free, open, and complete solution for most operation monitoring. In particular, Icinga is great for monitoring hosts and alerting on basic metrics."
2.7.6 Icinga Demo
2.8 Progress WhatsUpGold
Progress WhatsUp Gold is a network monitoring tool that provides real-time visibility and insights into network performance, availability, and security.
It is designed for small to medium-sized businesses and can monitor a wide range of network devices, including servers, switches, routers, and applications.

WhatsUp Gold offers a range of features, including:
- Network discovery and mapping: WhatsUp Gold can automatically discover and map the network topology, providing a visual representation of the network infrastructure.
- Real-time network monitoring: WhatsUp Gold can monitor network performance metrics, including response time, bandwidth utilization, and device availability, providing real-time alerts and notifications when issues are detected.
- Application performance monitoring (APM): WhatsUp Gold can monitor the performance of various applications, including web applications, databases, and other custom applications. It can monitor application response times, database query performance, and other application-specific metrics.
- Network security: WhatsUp Gold can monitor network security, including intrusion detection, malware detection, and vulnerability scanning.
- Reporting and analytics: WhatsUp Gold provides customizable reporting and analytics features, allowing users to generate reports and analyze network performance data.
Overall, WhatsUp Gold provides a comprehensive network monitoring solution that allows businesses to optimize network performance, improve network security, and reduce downtime.
2.8.1 Progress WhatsUpGold Positioning
Progress WhatsUp Gold offers a comprehensive network performance monitoring tool that includes several types of network performance monitoring, such as:
- Device monitoring: WhatsUp Gold can monitor the availability and performance of network devices such as servers, switches, routers, and firewalls, providing real-time alerts and notifications when issues are detected.
- Application monitoring: WhatsUp Gold can monitor the performance of various applications, including web applications, databases, and other custom applications. It can monitor application response times, database query performance, and other application-specific metrics.
- Network bandwidth monitoring: WhatsUp Gold can monitor network bandwidth usage to identify bottlenecks, congestion, and bandwidth utilization trends. It can also provide alerts when network bandwidth usage exceeds predefined thresholds.
- Network flow analysis: WhatsUp Gold can perform network flow analysis to identify network traffic patterns, monitor application usage, and detect potential security threats.
- Cloud monitoring: WhatsUp Gold can monitor cloud resources, including virtual machines, databases, and cloud services, to identify performance issues and ensure optimal cloud performance.
Overall, WhatsUp Gold's network performance monitoring tool provides real-time visibility and insights into network performance, allowing businesses to optimize their networks and provide a better experience for their end-users.
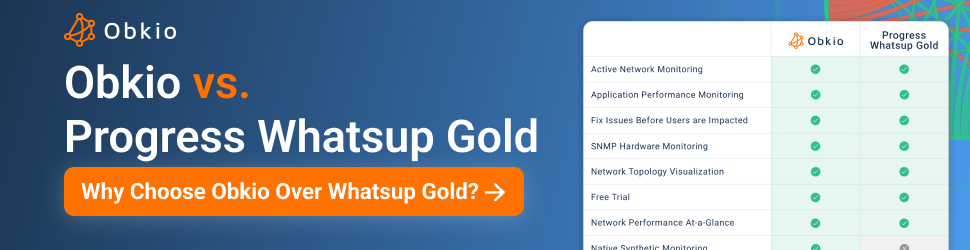
2.8.2 Progress WhatsUpGold Pricing
Progress WhatsUp Gold does not provide public pricing information on their website. It's important to note that pricing may vary depending on the package and vendor, and businesses are encouraged to contact Progress directly or authorized resellers for accurate and up-to-date pricing information.
2.8.3 Progress WhatsUpGold Customer Services
Progress WhatsUp Gold provides several customer service options to support its users, including:
- Technical support: Progress offers technical support to its users, including email, phone, and live chat support. Users can contact the support team to get help with any issues they are experiencing.
- Knowledge base: Progress WhatsUp Gold provides a comprehensive knowledge base that includes user guides, troubleshooting guides, and best practices to help users get started with the platform and resolve issues on their own.
- Professional services: Progress offers professional services to help users with customized integrations, deployment, and configuration management. These services include consulting, training, and custom development.
- Community support: Progress WhatsUp Gold has an active community of users who provide support, advice, and guidance through online forums, user groups, and social media channels.
- Training and certification: Progress offers training and certification programs to help users become experts in using the platform. The programs cover various topics, including network monitoring, application monitoring, and network security.
Overall, Progress WhatsUp Gold provides a range of customer service options to support its users, including technical support, knowledge base, professional services, community support, and training and certification programs. Users can choose the level of support that best fits their needs and budget.
2.8.4 Progress WhatsUpGold User Interface


2.8.5 Progress WhatsUpGold User Reviews
"The monitoring service is very complete with each update is improving without any doubt, the user interface is easy to understand, all options are distributed very well in the upper tabs of the program."
"It has a user-friendly and intuitive interface. It allows users to determine and scan performance from a glance. It has quick and timely alerts that help users identify and fix network problems before end users realize there's an issue."
2.8.6 Progress WhatsUpGoldDemo
Part 3: Best 4 Open-Source Network Monitoring Tools for Effective Network Performance Monitoring
Let's be real, traditional IT management platforms can be like the big, bulky SUVs of the network management world - sure, they get the job done, but they're not exactly nimble or cost-effective. And when it comes to network performance monitoring, sometimes you need a sports car, not a tank.
That's where open-source network monitoring tools come in. These tools are like the Ferraris of network monitoring - sleek, speedy, and built for performance. Plus, they won't break the bank like some of those other tools out there.
In this section, we'll rev up our engines and explore the top 8 open-source network monitoring tools that offer effective network performance monitoring capabilities. These tools have gained popularity for their ease of use, affordability, and flexibility, and they have a strong community of developers and users who contribute to their continued improvement. So, strap on your seatbelt, and let's take these babies for a spin to see what makes them stand out and how they can help organizations improve their network performance.
3.1 Nagios XI
Nagios XI is an enterprise-level network monitoring tool that provides real-time visibility into network infrastructure, services, and applications.
It is a commercial product that builds upon the open-source Nagios Core monitoring engine and provides additional features and capabilities.

Nagios XI offers a range of features, including:
- Network discovery and mapping: Nagios XI can automatically discover and map the network topology, providing a visual representation of the network infrastructure.
- Real-time network monitoring: Nagios XI can monitor network performance metrics, including response time, bandwidth utilization, and device availability, providing real-time alerts and notifications when issues are detected.
- Application performance monitoring (APM): Nagios XI can monitor the performance of various applications, including web applications, databases, and other custom applications. It can monitor application response times, database query performance, and other application-specific metrics.
- Network security: Nagios XI can monitor network security, including intrusion detection, malware detection, and vulnerability scanning.
- Reporting and analytics: Nagios XI provides customizable reporting and analytics features, allowing users to generate reports and analyze network performance data.
Overall, Nagios XI provides a comprehensive network monitoring solution that allows businesses to optimize network performance, improve network security, and reduce downtime. The platform is widely used by enterprises, service providers, and IT professionals to monitor and manage their IT infrastructure.
3.1.1 Nagios XI Positioning
agios XI is a commercial version of the open-source Nagios Core monitoring software. It is designed to provide comprehensive monitoring of IT infrastructure, including servers, applications, services, and network devices.
Nagios XI is positioned as an enterprise-level monitoring solution that offers a broad range of features and capabilities, such as customizable dashboards, powerful reporting, and scalability for large environments. It is used by organizations of all sizes and industries, including government agencies, healthcare, education, and finance.
In terms of market positioning, Nagios XI competes with other enterprise-level monitoring solutions, such as SolarWinds, Zabbix, and PRTG Network Monitor. Nagios XI has a strong following in the open-source community and is widely regarded as a reliable and cost-effective monitoring solution. However, its commercial licensing model may not be as appealing to some users as compared to the free and open-source Nagios Core.
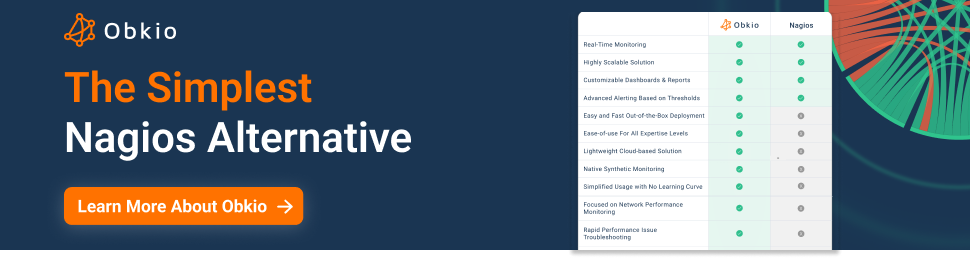
3.1.2 Nagios XI Pricing
Nagios XI is free for up to 7 nodes after the trial, allowing users to test how it can be used to accommodate your enterprise needs. For more pricing details, make sure to review their website and reach out to their sales team.
3.1.3 Nagios XI Customer Services
Nagios XI is a comprehensive IT infrastructure monitoring and alerting solution. As part of its offerings, Nagios provides a range of support options to help customers maximize the value of their investment and ensure their systems are running smoothly.
Nagios XI support options include:
- Email Support: Nagios provides email support to all customers, regardless of the support plan they choose. This allows customers to submit support requests at any time, and receive a response within one business day.
- Phone Support: Nagios offers phone support as part of its standard and enterprise support plans. This enables customers to speak directly with Nagios support experts and get real-time assistance with any issues they are experiencing.
- Chat Support: Nagios also provides chat support to customers on its enterprise support plan. This option allows customers to quickly connect with Nagios support experts via chat, enabling them to resolve issues in real-time.
- Remote Assistance: Nagios support experts can also provide remote assistance to customers. This allows Nagios to troubleshoot and resolve issues directly on the customer's system, saving time and minimizing disruption to the customer's operations.
- Training and Consulting: Nagios also offers training and consulting services to customers who want to get the most out of their Nagios XI solution. This includes customized training programs, on-site consulting, and assistance with Nagios integration and configuration.
Overall, Nagios XI support provides a range of options to help customers get the assistance they need, when they need it. Whether it's email, phone, chat, or remote assistance, Nagios support experts are available to help customers keep their systems running smoothly and efficiently.
Overall, it appears that Nagios is committed to providing its customers with multiple options for support and training.
3.1.4 Nagios XI User Interface


3.1.5 Nagios XI User Reviews
"A good comprehensive monitoring tool for SMBs. I love the simplicity of the tool and one of the key things I like personally is the Eagle Eye view."
"It's relialable, scalable and efficient. Allows a lots of custumization that grant you the possibility to monitor whatever you want."
3.1.6 Nagios Demo
3.2 LibreNMS
LibreNMS is a free and open-source network monitoring system that provides comprehensive monitoring capabilities for networks of all sizes. It is a fork of the Observium project and was created in response to the introduction of a restrictive new license for Observium. LibreNMS is written in PHP and uses a MySQL database to store data.
LibreNMS offers a wide range of features for monitoring networks, including automatic discovery of devices and services, monitoring of network performance metrics such as bandwidth usage and packet loss, event logging, alerting, and visualization of network topology. It supports a variety of network devices and vendors, including Cisco, Juniper, HP, Dell, and many others.

One of the key advantages of LibreNMS is its ease of use and installation. It can be installed on a variety of operating systems, including Linux, macOS, and FreeBSD, and comes with an intuitive web-based interface that makes it easy to configure and customize. LibreNMS also offers a vibrant community of users and developers, who contribute to the project and provide support to users.
Overall, LibreNMS is a powerful and flexible network monitoring system that offers a range of features and benefits for network administrators and IT teams. It is an excellent alternative to commercial network monitoring solutions, providing comparable features and capabilities at no cost.
3.2.1 LibreNMS Positioning
LibreNMS offers a wide range of network performance monitoring features, including but not limited to:
- Device discovery and mapping: LibreNMS can automatically discover and map your network devices, including routers, switches, and servers.
- Real-time monitoring: It provides real-time monitoring of network performance metrics such as CPU load, memory usage, disk usage, and network bandwidth utilization.
- Alerting and notifications: LibreNMS allows you to set up custom alerts and notifications based on predefined conditions. You can receive alerts via email, SMS, Slack, or other messaging platforms.
- Graphing and reporting: LibreNMS provides detailed graphing and reporting capabilities for network performance metrics. You can generate custom reports or use pre-built templates for network availability, device inventory, and more.
- Fault management: LibreNMS can help you troubleshoot network issues by providing detailed logs and event tracking for devices and interfaces.
- Network visualization: With LibreNMS, you can visualize your network topology and track the status of network devices and connections in real-time.
Overall, LibreNMS is a powerful network performance monitoring tool that can help you proactively monitor, troubleshoot, and optimize your network infrastructure.
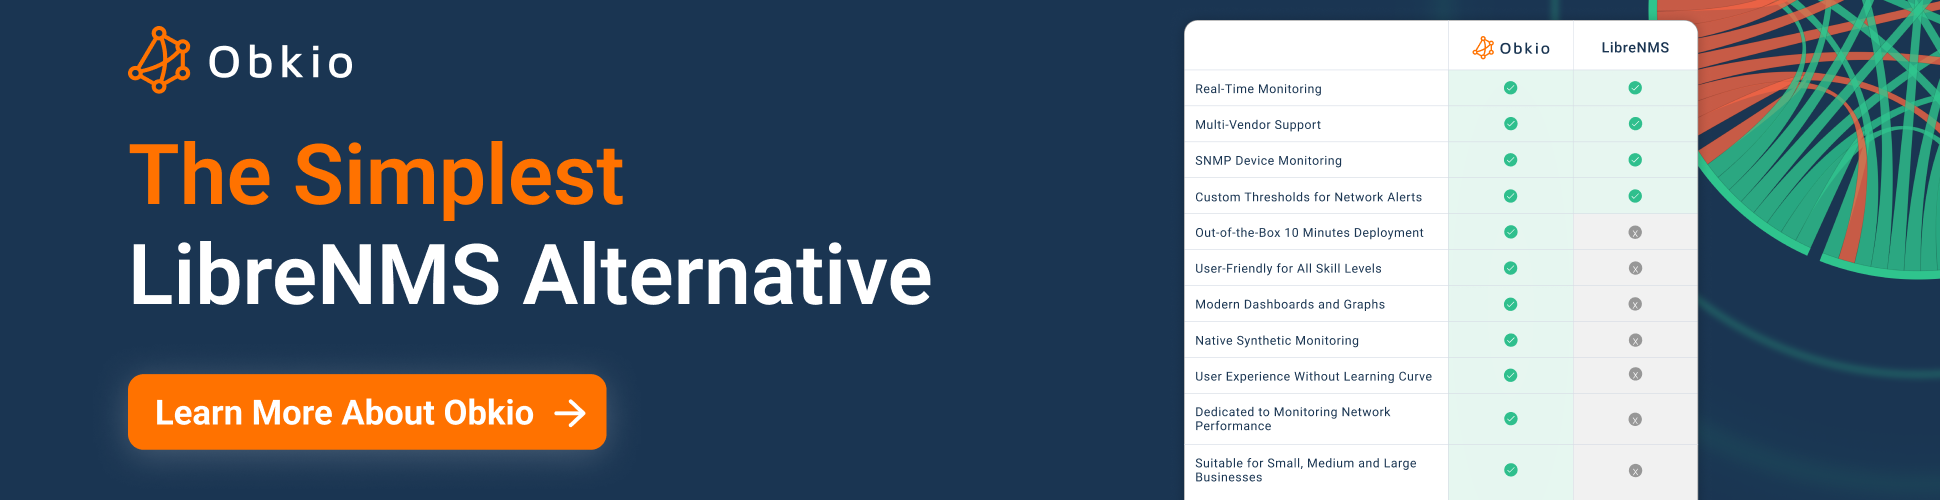
3.2.2 LibreNMS Pricing
LibreNMS is open source and available for free to download and use. However, some resellers offer pre configured and managed versions of the tool at a price.
3.2.3 LibreNMS Customer Services
LibreNMS offers support through various channels. They have an active community forum where users can ask questions and get help from other users and developers.
Additionally, certain vendors offer professional support plans for organizations that need more comprehensive assistance. These support plans include access to priority support, assistance with installation and configuration, and help with troubleshooting and resolving issues.
The cost of these support plans varies based on the level of support needed and the number of devices being monitored.
3.2.4 LibreNMS User Interface


3.2.5 LibreNMS User Reviews
"What I like about Librenms is that I can add any device ( I have not found one that did not work) to its SNMP puller and get device information very easily. I can also add ssh and telnet information to Librenms to login into the network or server equipment."
"LibreNMS is easy to install and configure since it's an open-source solution to monitor network equipment and servers."
3.2.6 LibreNMS Demo
3.3 Zabbix
Zabbix is an open-source network monitoring tool that is designed to monitor and track the performance and availability of network services, servers, applications, and devices. It provides a centralized monitoring solution that allows users to collect and analyze data from multiple sources, including SNMP devices, JMX applications, and IPMI-enabled servers.
Zabbix features a flexible and customizable alerting system that can notify users of any issues or problems via various methods, such as email, SMS, and instant messaging. It also includes a powerful reporting engine that can generate custom reports and visualizations to help users better understand their network performance and identify areas for improvement.

Zabbix is a free and open-source network monitoring tool that can be downloaded and installed on a variety of platforms, including Linux, Windows, and macOS. It also offers paid professional support services, training, and consulting for enterprise users who require additional assistance.
3.3.1 Zabbix Positioning
Zabbix offers comprehensive network performance monitoring that includes real-time monitoring, data collection, alerting, and reporting. It supports monitoring of network devices such as routers, switches, firewalls, servers, and virtual machines. It can also monitor various network protocols such as TCP/IP, SNMP, ICMP, and others.
Zabbix can monitor network performance metrics such as bandwidth utilization, packet loss, latency, CPU and memory usage, disk space usage, and other performance indicators. It can also monitor network services such as HTTP, FTP, DNS, and others. Zabbix provides customizable dashboards and reports to help network administrators visualize and analyze network performance data. Additionally, Zabbix allows for proactive monitoring with advanced alerting features such as threshold-based alerts and anomaly detection.
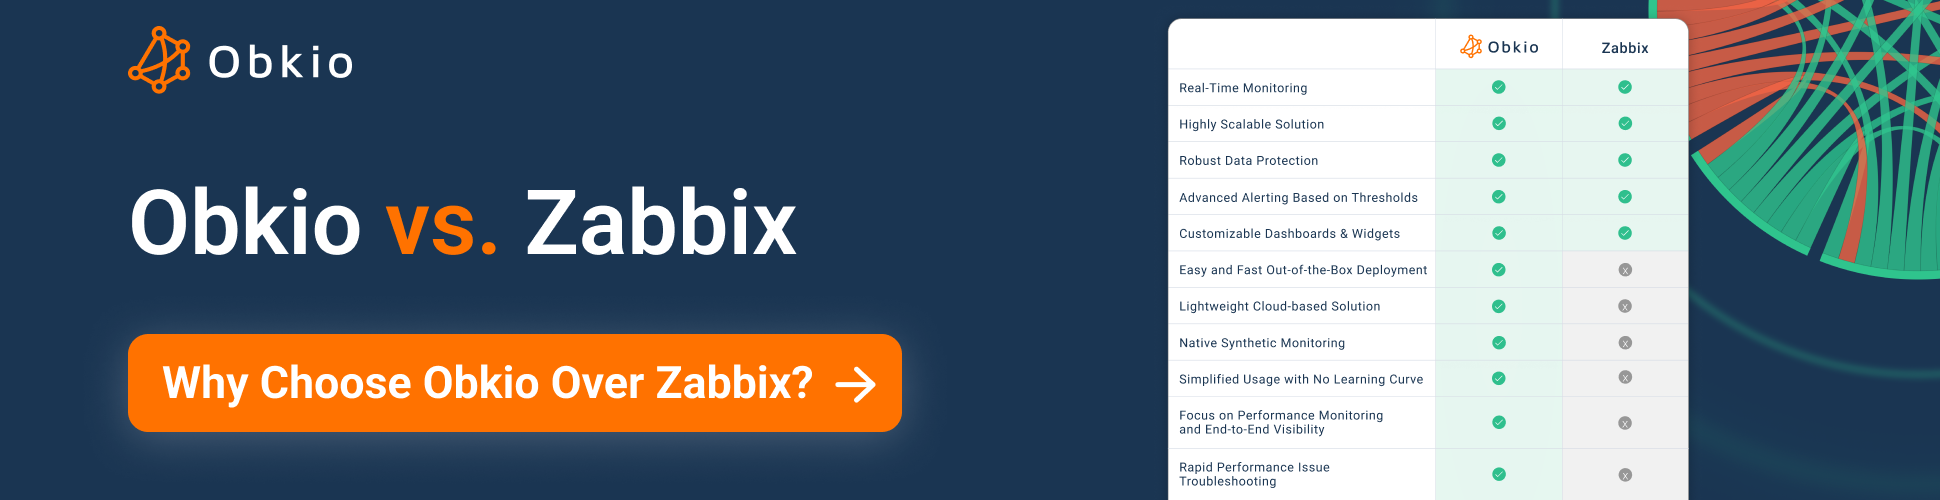
3.3.2 Zabbix Pricing
Zabbix is released under the GPL license, thus is free for commercial and non-commercial use. There are no limitations on the number of monitored devices, you can use Zabbix to monitor many thousands of devices absolutely free.
3.3.3 Zabbix Customer Services
Zabbix offers several types of support options.
Firstly, there is the community support, which is free of charge and includes a user forum, documentation, and knowledge base.
Secondly, Zabbix offers professional support services, which include technical support, tool updates, and access to the Zabbix support team. The cost of professional support varies depending on the number of monitored devices and the level of support required.
Zabbix also offers training courses, including online self-paced courses and on-site training, for an additional fee.
Additionally, Zabbix has a partner network that provides consulting, implementation, and customization services for customers who require more specialized support. The cost of these services is negotiated directly with the partners.
3.3.4 Zabbix User Interface


3.3.5 Zabbix User Reviews
"Zabbix is an effective and high performance monitoring solution, it is flexible and very customizable thanks to its open source nature, with Zabbix we can monitor and track the performance of our network infrastructure and its different devices.
"Zabbix is an excellent network monitoring software that provides us with a centralized solution to monitor multiple elements of our network infrastructure (health and integrity)."
3.3.6 Zabbix Demo
3.4 OpenNMS
OpenNMS is a free and open-source enterprise-grade network management tool that helps network administrators monitor and manage their network infrastructure. It provides a comprehensive set of tools for managing networks, including fault and performance management, traffic analysis, and service assurance.
OpenNMS supports a wide range of network protocols and devices, making it suitable for managing networks of all sizes and complexities. It also includes a powerful event and alarm management system, which can notify administrators of any network issues in real-time.

One of the key features of OpenNMS is its extensibility. It can be easily customized and integrated with other tools and systems, making it a flexible solution for managing complex network environments.
OpenNMS offers two versions of its network management platform: OpenNMS Horizon and OpenNMS Meridian. While both versions share many of the same features, OpenNMS Meridian is designed for enterprise environments and includes advanced features and professional support services, while OpenNMS Horizon is a community-driven, open-source version of the platform. The key differences between the two versions lie in their features, support, licensing, and upgrades. Understanding these differences can help network administrators determine which version is the best fit for their organization's needs.
- Features: OpenNMS Horizon is a community-driven, open-source network management platform that includes a comprehensive set of features for managing networks, including fault and performance management, traffic analysis, and service assurance. OpenNMS Meridian, on the other hand, is the enterprise version of OpenNMS and includes advanced features, such as Flows/Streaming telemetry, Sentinel, and ALEC, along with professional support and services.
- Support: OpenNMS Horizon is community-supported and relies on the community for support and maintenance. In contrast, OpenNMS Meridian includes professional support services, including installation consulting and faster SLA response times.
- Licensing: OpenNMS Horizon is available under the GPLv3 license, which means that it's free to download, use, and modify. OpenNMS Meridian is available under a commercial license and requires a subscription for access to enterprise features and support.
- Upgrades: OpenNMS Horizon is updated regularly, and the latest version is available for download on the OpenNMS website. OpenNMS Meridian includes regular updates and upgrades, along with professional support services to assist with installation and maintenance.
Overall, while OpenNMS Horizon provides a robust set of features and is suitable for many network management needs, OpenNMS Meridian is designed for enterprise environments and includes advanced features and support services to ensure high availability and performance of critical network infrastructure.
3.4.1 OpenNMS Positioning
OpenNMS offers network performance monitoring as one of its core features. It provides various types of network performance monitoring, including:
Resource Utilization Monitoring: OpenNMS can monitor the resource utilization of devices and interfaces in real-time, including CPU, memory, disk, and network usage.
Latency Monitoring: OpenNMS can monitor network latency and response time between devices and applications.
Bandwidth Monitoring: OpenNMS can monitor network bandwidth usage, including throughput, traffic volume, and packet loss.
Service Monitoring: OpenNMS can monitor the availability and performance of network services and applications, including HTTP, DNS, SMTP, and FTP.
Flow Monitoring: OpenNMS can monitor network traffic flows, including source and destination IP addresses, protocols, and ports.
Threshold Monitoring: OpenNMS can monitor network devices and interfaces against predefined thresholds and generate alerts when these thresholds are breached.
Overall, OpenNMS provides a comprehensive set of network performance monitoring capabilities that help network administrators identify and troubleshoot network issues in real-time.
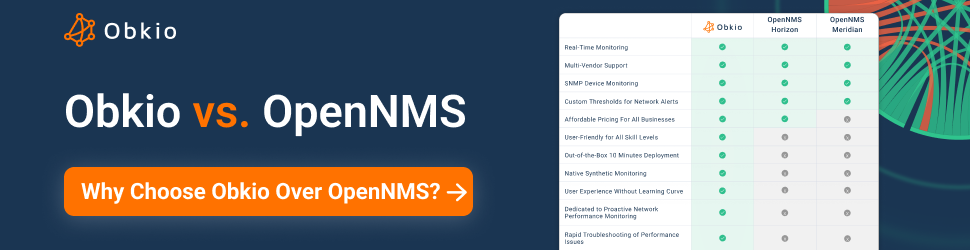
3.4.2 OpenNMS Pricing
OpenMSN offers pricing for OpenNMS Meridian, the enterprise version of OpenNMS that includes advanced features and professional support on their website. It's important to note that OpenNMS Horizon, the community version of OpenNMS, is available for free and can be downloaded and used by anyone. However, if you require enterprise-grade network management capabilities and support, OpenNMS Meridian may be a better fit for your organization.
3.4.3 OpenNMS Customer Services
OpenNMS Meridian offers a range of customer services to support its enterprise customers, including installation consulting, professional support, and faster SLA response times. OpenNMS Meridian also includes advanced features such as Flows/Streaming telemetry, Sentinel, and ALEC that are not available in OpenNMS Horizon.
It's important to note that OpenNMS Horizon is free and doesn't include the same level of services as OpenNMS Meridian. While OpenNMS Horizon has a strong community of users and contributors that can provide support and assistance, enterprise customers may require more comprehensive support and services that are only available through OpenNMS Meridian subscriptions.
3.4.4 OpenNMS User Interface


3.4.5 OpenNMS User Reviews
"It's very easy to configure. Onboarding a server is pretty much easy. Just give IP address/Hostname and provision. That's it."
"The usage of powerful SNMP protocol, often no so appreciated, gives an amazing way to monitor and collecting data and alerts from different kind of devices. ONMS helps enterprise architecture to have all in control."
Part 4: All-in-One Network Solutions: Best 6 Application Performance Monitoring (APM) Tools with Network Performance Monitoring Tools or Modules
When it comes to managing the performance of complex environments across multiple layers, all-in-one observability platforms are the superheroes of the IT world. These platforms offer advanced features for monitoring, troubleshooting, and optimizing infrastructure and application performance, including cloud-native architectures and microservices. And while these platforms do offer network performance monitoring (NPM) capabilities, it's important to note that they are primarily focused on providing insights to application owners and operators.
In this section, we'll explore the best 6 application performance monitoring (APM) tools with network performance monitoring tools or modules that offer all-in-one solutions for observability. These tools have earned their reputation for their ability to provide detailed insights into both application and network performance, making them a valuable addition to any organization's network management strategy. Let's take a closer look at what makes these 6 all-in-one network solutions stand out and how they can help organizations ensure their application and network performance is optimized for success.
4.1 Datadog
This section aims to provide a specific focus on the network performance monitoring functions of Datadog. However, as Datadog is a comprehensive software solution offering multiple capabilities, it's important to note that some limitations may exist in terms of the specific details that can be covered.
Datadog is a cloud monitoring and analytics platform that provides real-time insights into the performance of applications, infrastructure, and logs. With Datadog, businesses can monitor their entire cloud infrastructure, including servers, databases, and containers, to identify issues and optimize performance.

The platform integrates with over 450 technologies and offers customizable dashboards, alerts, and visualizations to help businesses track and analyze their data. In addition to monitoring and analytics, Datadog offers features such as security monitoring, APM, and log management, providing businesses with a comprehensive solution for managing their cloud environments.
Datadog is used by companies of all sizes, from startups to Fortune 500 enterprises, across a range of industries, including finance, healthcare, and e-commerce.
4.1.1 Datadog Positioning
Network Performance Monitoring (NPM) is a feature offered by Datadog that provides real-time visibility into the health and performance of network infrastructure. With NPM, businesses can monitor the performance of their network devices, including switches, routers, and firewalls, and identify issues that may impact network performance.
The feature includes tools for network mapping, traffic analysis, and network flow analysis, allowing businesses to gain a comprehensive view of their network environment and identify potential bottlenecks or vulnerabilities.
Datadog's NPM also includes features for network troubleshooting and remediation, including root cause analysis and packet capture, to help businesses quickly resolve issues and minimize downtime.
By leveraging NPM within the Datadog platform, businesses can gain a complete understanding of their entire cloud infrastructure, from applications to network performance, and optimize performance across the board.
4.1.2 Datadog Pricing Model
Datadog offers a range of pricing plans for their cloud monitoring and analytics platform to meet different businesses and use cases. Their plans are based on a consumption-based pricing model, which means that customers only pay for the resources they use, such as the number of hosts or containers monitored, and the amount of data ingested and retained.
4.1.3 Datadog Customer Service
Datadog offers a range of customer service offerings to help their customers get the most out of their cloud monitoring and analytics platform. These services include technical support, training and certification programs, and professional services.
Technical support is available to all Datadog customers, with access to a team of experts who can assist with issues related to installation, configuration, and troubleshooting. Customers can choose from different support plans to match their needs, including Standard, Pro, and Enterprise support.
Datadog also offers training and certification programs to help customers build their expertise in cloud monitoring and optimize their use of the platform. These programs include on-demand courses, live instructor-led training, and certification exams.
For businesses that need additional assistance with their Datadog deployments, Datadog offers professional services such as consulting, implementation, and optimization services. These services are designed to help businesses get up and running quickly with their cloud monitoring solutions and to maximize their return on investment.
4.1.4 Datadog User Interface


4.1.5 Datadog User Reviews
"It is ideal for monitoring cloud products and can be used not only for monitoring the life and death of common servers and networks but also for monitoring serverless services (PaaS)."
"The best part of Datadog is how it evolves so quickly. Every week you seem to find an improvement and a new feature on the UI. They are doing a really good job on adding more features around security, which are updated regularly."
"Datadog has a comprehensive and user-friendly interface that simplifies daily use in monitoring and analytics. There is no need to write code to set up and configure the service in the organization."
4.1.6 Datadog Demo
4.2. AppDynamics
Cisco is now refering to ThousandEyes for their Network Monitoring. Some functionalities are still within AppDynamics and this is why we included both solutions. We might revise the article to combine AppDynamics and ThousandEyes in a future date.
AppDynamics is a software company that provides application performance management (APM) and IT operations analytics solutions. The company's platform helps organizations monitor and optimize their applications, infrastructure, and user experience in real-time, providing visibility into the performance and behavior of their applications and services.
AppDynamics allows users to monitor their applications across multiple platforms and technologies, including cloud, on-premises, and mobile environments. It can monitor the performance of web applications, databases, servers, and other components of an IT system, providing insights into application behavior, identifying potential problems and helping to quickly diagnose and resolve issues.
In addition to performance monitoring, AppDynamics offers features such as transaction tracing, code-level visibility, anomaly detection, and machine learning-based analytics. These features help organizations to better understand the impact of application performance on end-users, as well as to optimize resource allocation, reduce downtime, and improve the overall user experience.
4.2.1 AppDynamics Positioning
AppDynamics, a leading application performance monitoring (APM) tool provider, has recently announced that they will be incorporating ThousandEyes, a network performance monitoring tool, into their platform.
This decision comes as a response to the growing demand for comprehensive visibility into application and network performance, particularly as more businesses are moving their operations to the cloud.
With ThousandEyes, AppDynamics users will have access to a more complete view of their IT environment, including real-time insights into network behavior and potential issues.
This move is expected to enhance AppDynamics' ability to provide end-to-end visibility into application and network performance, and ultimately help businesses improve the performance and reliability of their digital services.
4.2.2 AppDynamics Pricing Model
AppDynamics recently changed their pricing model to a consumption-based model, which allows customers to pay only for the resources they use rather than a fixed amount based on the number of nodes or applications monitored. Be sure to check their website or reach out to their sales time for more details.
4.2.3 AppDynamics Customer Service
AppDynamics offers a range of customer service offerings to help their customers get the most out of their APM solutions. These services include technical support, training and certification programs, and professional services.
Technical support is available to all AppDynamics customers, with access to a team of experts who can assist with issues related to installation, configuration, and troubleshooting. Customers can choose from different support plans to match their needs, including standard, premium, and elite support.
AppDynamics also offers training and certification programs to help customers build their expertise in APM and optimize their use of the platform. These programs include on-demand courses, live instructor-led training, and certification exams.
For businesses that need additional assistance with their APM deployments, AppDynamics offers professional services such as consulting, implementation, and optimization services. These services are designed to help businesses get up and running quickly with their APM solutions and to maximize their return on investment.
Overall, AppDynamics' customer service offerings are designed to provide comprehensive support to their customers throughout their APM journey, from initial deployment to ongoing maintenance and optimization.
4.2.4 AppDynamics User Interface

4.2.5 AppDynamics User Reviews
"We have found root cause analysis and code inspection very helpful and detailed.Web based and national customer support are very responsive, efficient and highly competent."
"The transaction snapshots are what I like the most because it helps us narrow down where we should be looking for issues, especially when it's an adjacent application or service."
"One UI for all the components - APM, Analytics and EUM.SaaS offering takes the burden off having to host your own Controller."
4.2.6 AppDynamics Demo
4.3. Dynatrace
This section aims to provide a specific focus on the network performance monitoring functions of Dynatrace. However, as Dynatrace is a comprehensive tool solution offering multiple capabilities, it's important to note that some limitations may exist in terms of the specific details that can be covered.
Dynatrace is a leading application performance management (APM) tool company that offers a suite of tools for monitoring, analyzing, and optimizing the performance of software applications and the underlying infrastructure.
Their platform provides end-to-end visibility into the performance of applications, cloud infrastructure, and networks, enabling organizations to proactively identify and resolve performance issues before they impact end-users.

Dynatrace uses advanced analytics and artificial intelligence to automatically detect anomalies and identify the root cause of issues, reducing the time and effort required for troubleshooting and improving overall application performance.
Their solutions are used by businesses of all sizes across a wide range of industries to deliver better digital experiences for their customers and employees.
4.3.1 Dynatrace Positioning
Dynatrace is positioned as a leading player in the digital experience management space, offering a comprehensive tool intelligence platform that goes beyond network performance monitoring to provide end-to-end visibility into the entire application stack, from the front-end user experience to the back-end infrastructure.
Dynatrace's platform leverages AI and automation to provide real-time insights into application performance, user behavior, and business impact. It can identify and troubleshoot performance issues across complex, multi-cloud environments, and provides actionable insights to help teams optimize their tool development and delivery processes.
4.3.2 Dynatrace Pricing Model
Dynatrace pricing varies based on a number of factors, such as the number of hosts or cloud instances being monitored, the level of automation and intelligence required, and the level of support and services needed. Dynatrace offers a range of pricing tiers and plans, starting with a free trial option, and pricing is typically customized based on each customer's unique needs and usage.
Dynatrace pricing can vary based on a number of factors such as the level of services and support needed, the size and complexity of the environment being monitored, and the length of the contract.
4.3.3 Dynatrace Customer Service
Dynatrace ONE is Dynatrace's comprehensive support program that provides customers with access to a range of support services and resources to help them maximize the value of their Dynatrace investment.
With Dynatrace ONE, customers have access to a dedicated customer success manager (CSM) who serves as their primary point of contact for support and guidance, as well as a team of technical support specialists who can help with any technical issues or questions that arise.
Some of the key features of Dynatrace ONE support include:
- 24/7 technical support: Customers have access to technical support specialists around the clock to help with any issues or questions.
- Proactive monitoring and alerts: Dynatrace's AI-powered platform can proactively monitor for issues and alert customers before they become critical.
- Customized guidance and training: Customers receive customized guidance and training from their dedicated CSM to help them maximize the value of Dynatrace for their specific use case.
- Community and knowledge resources: Dynatrace provides access to a community of peers and a knowledge base with documentation, best practices, and tips to help customers get the most out of their Dynatrace investment.
Overall, Dynatrace ONE support is designed to provide customers with the resources and guidance they need to be successful with Dynatrace, from implementation and onboarding to ongoing support and optimization.
According to Dynatrace's website, pricing for Dynatrace ONE support starts at $13,000 USD per year for a Standard package, but pricing may vary based on your specific needs and usage.
4.3.4 Dynatrace User Interface


4.3.5 Dynatrace User Reviews
"What I like most about Dynatrace is that it provides live alerts and synthetic monitoring of online or cloud-based applications with proper, real-time tracking and monitoring that has strong predictive analytics on the data."
"I love the ability to have real-time alerts and synthetic monitoring of online or cloud-based applications, as well as proper tracking and monitoring."
"Dynatraces support services such as Business Insights and Dynatrace One are exceptional. They help you analyze your application data, are responsive when you need their expertise, and proactive in offering suggestions on how to best use Dynatrace features."
4.3.6 Dynatrace Demo
4.4 Splunk
Splunk is a software platform for searching, analyzing, and visualizing machine-generated data in real-time. It is used for monitoring, troubleshooting, and analyzing large-scale IT operations, security events, and business processes. Splunk collects data from various sources, such as servers, applications, network devices, and sensors, and provides a centralized platform for indexing, searching, and correlating this data.
Splunk can be used for a wide range of use cases, including application monitoring, log analysis, security information and event management (SIEM), fraud detection, and business analytics. Its powerful search and visualization capabilities allow users to quickly identify patterns, trends, and anomalies in their data, enabling them to make better-informed decisions.
Splunk also provides a range of tools and services to help users manage their deployments, including machine learning and artificial intelligence capabilities, alerting and notification features, and a large and active community of users and contributors.
4.4.1 Splunk Positioning
Splunk NPM (Network Performance Monitor) is a network performance monitoring solution provided by Splunk that helps organizations monitor and manage the performance of their network infrastructure. It provides a comprehensive set of tools for monitoring network performance, including real-time network visibility, intelligent alerting, and deep network analytics.
Splunk NPM allows network administrators to monitor key performance metrics such as network latency, throughput, packet loss, and response times. It also provides detailed network topology maps and dashboards, which allow administrators to quickly identify performance issues and troubleshoot network problems.

In addition, Splunk NPM includes a range of advanced features, such as customizable network baselines, automated discovery and classification of network devices, and integration with other Splunk apps and solutions. It also includes machine learning and artificial intelligence capabilities to help identify patterns and anomalies in network traffic and improve network performance.
Overall, Splunk NPM provides a comprehensive network performance monitoring tool that can help organizations optimize the performance and availability of their network infrastructure.
4.4.2 Splunk Pricing
The Splunk Observability Cloud pricing list includes a range of options for organizations to choose from, depending on their specific needs. The pricing list covers offerings for infrastructure monitoring, application performance monitoring, real-time user monitoring, synthetic monitoring, automated incident response, and predictive event and service management.
4.4.3 Splunk Customer Services
Splunk offers a range of customer services to support its customers, including:
Technical Support: Splunk provides technical support to help customers troubleshoot issues and optimize their Splunk deployment. This includes access to a knowledge base, product documentation, and online forums, as well as direct access to Splunk support engineers.
Professional Services: Splunk offers professional services to help customers with deployment planning, architecture design, and implementation. Splunk's professional services team includes experienced consultants who can provide customized solutions to meet specific customer needs.
Training and Certification: Splunk offers a range of training and certification programs to help customers build expertise in using Splunk. These programs include online and instructor-led training, as well as certification exams to validate skills and knowledge.
Community Support: Splunk has a large and active community of users and contributors who can provide support and assistance through online forums, user groups, and other channels.
Overall, Splunk provides a range of customer services to help its customers get the most out of their Splunk deployment and ensure that their critical IT infrastructure is performing optimally.
4.4.4 Splunk User Interface


4.4.5 Splunk User Reviews
"Splunk Enterprise is a great solution for the organization collecting data from different services and can be used to do a lots of tasks like searching,visualizing and analyzing data."
"Splunk provides great features for log aggregator, searching , you can monitor things like your infrastructure, can create different dash boards for your infra, application and many more!"
4.4.6 Splunk Demo
4.5 New Relic
New Relic is a cloud-based network observability platform that provides real-time insights into the performance and health of digital systems. It allows organizations to monitor their applications, infrastructure, and customer experiences in real-time, providing actionable insights to improve performance and optimize customer experiences.
New Relic offers a range of observability tools, including application performance monitoring (APM), infrastructure monitoring, serverless monitoring, browser monitoring, mobile monitoring, and synthetic monitoring. These tools provide real-time visibility into the performance and health of applications, infrastructure, and customer experiences.

In addition, New Relic provides a suite of analytics tools, including event data, metric data, and trace data, that enable organizations to analyze and understand the behavior of their systems and applications. This data can be used to identify issues, optimize performance, and improve the overall customer experience.
Overall, New Relic provides a comprehensive platform for observability that helps organizations to proactively monitor, troubleshoot, and optimize the performance of their digital systems.
4.5.1 New Relic Positioning
New Relic does offer network performance monitoring as a part of its observability platform. It has partnered with Kentik to provide customers with a tool to visualize all their data in one place, allowing them to see how network and overall system performance impact each other.
With this tool, customers can identify performance issues more quickly and focus troubleshooting efforts at the right layer, with the right team. This results in faster detection of issues and a reduction in Mean Time to Resolution (MTTR).
4.5.2 New Relic Pricing
New Relic provides a range of options for organizations to monitor and optimize their IT infrastructure and applications. The pricing structure is flexible, allowing organizations to choose the plan that best fits their needs and budget. Reach out to New Relic sales team for more information.
4.5.3 New Relic Customer Services
New Relic offers various types of support for its customers, including online community support, self-service resources, technical support, and customer success services.
Customers can access a comprehensive knowledge base, forums, and user groups to find solutions to common issues and connect with other users.
Technical support is available for customers who need more assistance with their New Relic implementation, and there are different levels of support available depending on the customer's needs.
Finally, customer success services offer personalized support and guidance to help customers achieve their business goals using New Relic.
4.5.4 New Relic User Interface


4.5.5 New Relic User Reviews
"It is super useful for engineering needs as it provides end-to-end visibility of the system overall. You can monitor performance, use it to troubleshoot and diagnose any problems, and it does well with alerts and notifications when something is starting to fail."
"New Relic is a must have infrastructure monitoring tool that offers an unparalleled level of detail for businesses. With New Relic, users can dive deep into their infrastructure and applications, gaining valuable insights and fine-grained control."
4.5.6 New Relic Network Performance Monitoring Demo
4.6 Elastic Observability
Elastic Observability is a collection of tools and techniques used to monitor, troubleshoot, and optimize the performance of complex systems and applications. It is built on the Elastic Stack and includes several components that provide deep insights into the behavior of systems and applications.

Elastic Observability includes the following components:
- Elastic APM (Application Performance Monitoring): This tool helps to monitor the performance of applications and services by collecting and analyzing data related to transaction traces, errors, and other key metrics.
- Elastic Logs: This tool enables the collection, centralization, and analysis of log data from various sources, allowing users to troubleshoot issues and gain insights into system behavior.
- Elastic Metrics: This tool collects and visualizes metrics data from various sources, such as servers, applications, and infrastructure components.
- Elastic Uptime: This tool monitors the availability and responsiveness of websites, APIs, and other network services.
Together, these tools provide a comprehensive view of system behavior, allowing users to identify issues, troubleshoot problems, and optimize performance. Elastic Observability is used in a wide range of industries, including IT, finance, healthcare, and more.
4.6.1 Elastic Observability Positioning
Elastic Observability is a solution offered by Elastic that provides comprehensive monitoring and analysis capabilities for various aspects of an application or system's performance.
APM stands for Application Performance Monitoring and is one of the key features of Elastic Observability. It enables developers and IT operations teams to monitor the performance of their applications in real-time, identify issues, and troubleshoot them quickly. This includes monitoring the performance of individual application components, identifying errors, tracing requests across various components, and analyzing application performance metrics.
Synthetic monitoring is another feature of Elastic Observability that enables teams to simulate user interactions with an application or website to monitor its performance. Synthetic monitoring can help teams identify issues before they impact real users and ensure that critical business workflows are functioning correctly.
User Experience Monitoring (UEM) is a feature that allows teams to monitor user interactions with an application or website. This includes tracking user behavior, identifying errors, and measuring user satisfaction. UEM helps teams understand how users interact with their applications and how they can optimize the user experience.
In addition to APM, synthetic monitoring, and UEM, Elastic Observability also offers network performance monitoring capabilities. This includes monitoring network traffic, identifying network performance issues, and troubleshooting them quickly.
4.6.2 Elastic Observability Pricing
Elastic Observability is a set of features offered by Elastic Stack to monitor and analyze the performance of various applications and systems. Elastic offers four different pricing tiers for their observability products, namely Standard, Gold, Platinum, and Enterprise. The pricing may vary based on the customer's specific needs and usage.
4.6.3 Elastic Observability Customer Services
Elastic offers customer service to its users. Elastic provides support through various channels, including email, phone, and community forums. Elastic's support team is available to assist users with product-related questions, technical issues, and troubleshooting. Elastic also provides documentation, training, and resources to help users get started with their products and to learn how to use them effectively.
Elastic offers different levels of support, including Standard, Gold, Platinum, and Enterprise. These levels of support differ in terms of the level of access to support, response times, and the number of support contacts that are available to the user. Users can choose the level of support that best meets their needs.
Additionally, Elastic offers professional services to help users with tasks such as implementation, optimization, and customization. These services are designed to help users get the most out of Elastic's products and to meet their specific business needs.
Overall, Elastic is committed to providing high-quality customer service and support to its users, and has a range of resources available to help users get the most out of its products.
4.6.4 Elastic Observability User Interface


4.6.5 Elastic Observability User Reviews
"User-Friendly Interface - It has a very intuitive and user-friendly interface that allows both professionals and novice users to quickly get started with monitoring and analyzing their applications and infrastructure."
"Dashboards and visualization feature in Kibana is really great. There are tons of ways you can visualize and analyse your data."
4.6.6 Elastic Observability Demo
Part V: Best 6 Packet Capture Based Technologies for High-Level IT Security Network Monitoring
When it comes to high-level IT security network monitoring, packet capture-based technologies offer a powerful solution for data analysis and threat detection. These technologies specialize in capturing and analyzing network traffic at a granular level, providing valuable insights into network activity and potential security threats.
However, packet capture-based technologies can be complex and resource-intensive, requiring specialized expertise for data analysis and significant hardware resources for data collection and storage. This means that these solutions may not be accessible or scalable for most companies.
In this section, we'll explore the best 6 packet capture-based technologies that offer high-level IT security network monitoring capabilities. These solutions have earned their reputation for their ability to provide detailed insights into network activity and identify potential security threats, making them a valuable addition to any organization's network security strategy. Let's take a closer look at what makes these 6 packet capture-based technologies stand out and how they can help organizations ensure their network security.
5.1 Ixia/Keysight Network Performance Monitoring Tool
Keysight Network Monitoring (Hawkeye or previously IX Chariot) is a solution provided by Keysight Technologies, a leading technology company that provides electronic design and test solutions. Keysight Network Monitoring is a software-based network monitoring solution that enables IT teams to monitor and troubleshoot network performance issues in real-time.
Keysight Network Monitoring offers a range of features, including network traffic analysis, packet capture and analysis, network performance monitoring, and application performance monitoring. These features enable IT teams to monitor the performance of their networks and applications, identify issues, and troubleshoot them quickly.

The solution can monitor network traffic at various levels of granularity, from packet-level analysis to application-level analysis. It can identify performance issues and security threats, and provide insights into network utilization, response times, and user behavior.
Keysight Network Monitoring is designed to be scalable and flexible, with the ability to monitor networks of all sizes, from small local networks to large distributed networks. It can be deployed in physical, virtual, and cloud environments, and is compatible with a wide range of network devices and protocols.
Overall, Keysight Network Monitoring is a powerful network monitoring solution that provides IT teams with the tools they need to monitor and optimize network performance, improve application performance, and ensure the security of their networks.
5.1.1 Ixia/Keysight Positioning
Keysight Technologies primarily targets Fortune 100 companies and federal organizations with its solutions, including Keysight Network Monitoring.
Fortune 100 companies are some of the largest and most influential companies in the world, and they often have complex IT infrastructure and networks that require sophisticated monitoring and analysis tools. Keysight's solutions, including network monitoring, can help these organizations optimize their network performance and improve their business operations.
Similarly, federal organizations often have complex IT infrastructure and networks, and they have strict requirements for security and compliance. Keysight's solutions can help these organizations monitor their networks for security threats and ensure compliance with regulations and policies.
By targeting these types of organizations, Keysight is able to focus on high-value customers with significant budgets and complex network monitoring needs. Additionally, serving these types of organizations often leads to strong customer relationships and long-term partnerships.
Keysight Hawkeye is a network performance monitoring and analytics solution offered by Keysight Technologies. It is designed to help IT teams monitor and troubleshoot network performance issues in real-time.
Hawkeye provides end-to-end visibility into network performance, from the user to the application to the network. It uses advanced analytics and machine learning to identify performance issues and anomalies, and provides actionable insights to help IT teams quickly identify and resolve network problems.
One of the key features of Hawkeye is its ability to perform active monitoring of the network and application performance. This means that it can simulate user transactions and monitor the performance of applications and services in real-time. It can also monitor network infrastructure components, such as routers, switches, and firewalls, to identify issues that may be impacting network performance.
Hawkeye also provides advanced analytics capabilities, including correlation analysis and anomaly detection. These capabilities help IT teams identify patterns and trends in network and application performance data, and provide insights into the root causes of performance issues.
Overall, Keysight Hawkeye is a powerful network performance monitoring and analytics solution that can help IT teams quickly identify and troubleshoot performance issues, improve the performance of their networks and applications, and enhance the overall user experience.
5.1.2 Ixia/Keysight Pricing
Please note that pricing for Keysight Hawkeye and Ixia Chariot solutions may not be easily accessible and can vary based on several factors, including the number of endpoints, features, and licenses. It's recommended that you contact Keysight directly for more detailed pricing information and to discuss your specific requirements.
5.1.3 Ixia/Keysight Customer Services
Keysight Technologies offers a range of customer service and support options to its users. These include:
Technical support: Keysight provides technical support to its users through various channels, including phone, email, and online chat. Keysight's technical support team can help users with product-related questions, technical issues, and troubleshooting.
Online resources: Keysight offers a range of online resources to help users get started with its products and to learn how to use them effectively. These include product documentation, user manuals, video tutorials, and community forums where users can share knowledge and ask questions.
Training: Keysight offers training programs and courses to help users develop the skills and knowledge they need to use its products effectively. These training programs can be delivered online or in-person, and cover a range of topics related to Keysight's products and solutions.
Professional services: Keysight also offers professional services to help users with tasks such as implementation, optimization, and customization. These services are designed to help users get the most out of Keysight's products and to meet their specific business needs.
Overall, Keysight is committed to providing high-quality customer service and support to its users. Keysight's customer service offerings are designed to help users get the most out of its products and to ensure that they can use them effectively to achieve their business objectives.
5.1.4 Ixia/Keysight User Interface

5.1.5 Ixia/Keysight User Reviews
"It gives you all details on one single page. Saves a lot of time does all the work for you when it comes to analytics."
"Ixia has plenty of features that we can use to test network equipment. Supporting almost all the protocol traffic is a great thing."
5.1.6 Ixia/Keysight Demo
5.2 Viavi Observer Solutions
Viavi Solutions is a global provider of network test, monitoring, and assurance solutions for communication service providers, enterprises, network equipment manufacturers, government and military organizations, and avionics manufacturers.
The company's solutions help customers optimize and maintain their network performance, quality, and security. Viavi's portfolio includes products for fiber and cable testing, mobile network testing, cloud and data center testing, network monitoring and assurance, and more.

5.2.1 Viavi Observer Positioning
Viavi Solutions offers a range of network monitoring solutions that enable network operators and enterprises to monitor and troubleshoot their networks in real-time. These solutions provide end-to-end visibility into network performance, user experience, and security, and help organizations detect and resolve network issues before they impact users. Some of the network monitoring solutions offered by Viavi Solutions include:
- Observer Platform: A comprehensive network performance management solution that combines flow-based, packet-based, and agentless monitoring technologies to provide visibility into network, application, and user performance.
- NITRO Mobile: A network monitoring solution for mobile service providers that provides real-time visibility into the radio access network, core network, and service delivery platforms.
- DPI for Security: A deep packet inspection (DPI) solution that enables network operators and enterprises to detect and prevent security threats, such as malware and ransomware, in real-time.
- UC&C Monitoring: A monitoring solution for unified communications and collaboration (UC&C) applications that provides end-to-end visibility into voice and video quality, network performance, and user experience.
- Service Assurance: A solution that provides real-time monitoring and analytics for cloud-based and hybrid IT environments, enabling organizations to ensure service delivery and optimize performance.
Overall, Viavi Solutions' network monitoring solutions help organizations to improve network performance, reduce downtime, and enhance the user experience, while also providing critical security capabilities to protect against cyber threats.
5.2.2 Viavi Observer Pricing
Viavi Solutions does not publicly disclose pricing for its Observer Platform network performance management solution, as pricing may vary depending on factors such as the specific features and capabilities required, the size and complexity of the network being monitored, and the length of the contract term. We recommend contacting Viavi Solutions directly to discuss your specific needs and to request a quote.
5.2.3 Viavi Solutions Customer Services
Viavi Solutions offers a range of customer service offerings to support its customers in using and maintaining its products and solutions. These offerings include:
- Technical Support: Viavi Solutions provides technical support services to help customers troubleshoot issues with their products and solutions. This includes access to a global team of technical experts, online resources such as knowledge bases and forums, and software updates and upgrades.
- Training and Education: Viavi Solutions offers training and education services to help customers get the most out of their products and solutions. This includes instructor-led training, e-learning courses, and certification programs.
- Professional Services: Viavi Solutions provides professional services to help customers design, implement, and optimize their network infrastructure. This includes consulting services, network assessments, and project management services.
- Customer Care: Viavi Solutions has a customer care team that is available to assist customers with billing inquiries, order tracking, and other non-technical issues.
- Community and User Groups: Viavi Solutions facilitates online communities and user groups where customers can connect with other users, share best practices, and exchange ideas and information.
Overall, Viavi Solutions is committed to providing high-quality customer service and support to help its customers succeed in their network testing, monitoring, and assurance initiatives.
5.2.4 Viavi Solutions User Interface


5.2.5 Viavi Solutions User Reviews
"The solution performed as advertised and the account and support teams have done an excellent job making sure we get value from the product."
"The product works extremely well on diagnosing the network traffic and the support team is very knowledgeable with it."
5.2.5 Viavi Solutions Demo
5.3 Gigamon
Gigamon is a leading provider of network visibility and analytics solutions that help organizations optimize their network performance, security, and monitoring. The company's products and solutions provide visibility into network traffic, enabling customers to gain insights and take action on network issues in real-time.
Gigamon's portfolio includes a range of hardware and software solutions, including:
Network TAPs: Gigamon offers a variety of network TAPs that enable organizations to capture and analyze network traffic for monitoring, security, and compliance purposes.
Network Packet Brokers: Gigamon's network packet brokers provide a central point of control for network traffic, allowing organizations to optimize their network performance and security.
Visibility Fabric: Gigamon's Visibility Fabric is a software-defined platform that provides a scalable and flexible architecture for network visibility and analytics.
Application Intelligence: Gigamon's application intelligence solutions enable organizations to monitor and analyze their application traffic, helping them to improve the user experience and ensure application performance and availability.
Cloud and Virtualization: Gigamon's cloud and virtualization solutions provide visibility and analytics for cloud-based and virtualized environments, allowing organizations to maintain network performance, security, and compliance in these environments.

Gigamon is headquartered in Santa Clara, California, and has offices around the world. The company serves a range of industries, including telecommunications, financial services, healthcare, government, and more.
5.3.1 Gigamon Positioning
Gigamon offers a range of network monitoring solutions that enable organizations to gain visibility into their network traffic, analyze network behavior, and detect and respond to network security threats. Some of the network monitoring solutions offered by Gigamon include:
- Network TAPs: Gigamon's network TAPs enable organizations to capture and analyze network traffic in real-time. This allows them to gain visibility into network behavior, monitor network performance, and troubleshoot issues.
- Network Packet Brokers: Gigamon's network packet brokers provide a central point of control for network traffic, allowing organizations to optimize their network performance, improve security, and reduce costs.
- Traffic Intelligence: Gigamon's traffic intelligence solutions enable organizations to analyze their network traffic and gain insights into user behavior, application usage, and network performance. This helps them to identify and resolve network issues, improve application performance, and enhance the user experience.
- Threat Detection: Gigamon's threat detection solutions provide real-time visibility into network activity, enabling organizations to detect and respond to security threats such as malware, ransomware, and other cyber attacks.
- Cloud and Virtualization: Gigamon's cloud and virtualization solutions provide visibility and analytics for cloud-based and virtualized environments, allowing organizations to maintain network performance, security, and compliance in these environments.
Overall, Gigamon's network monitoring solutions are designed to help organizations improve their network performance, optimize network traffic, and enhance their security posture.
5.3.2 Gigamon Pricing
Gigamon offers prices for various products and licenses and can vary based on your business'. We recommend reaching out to their sales team for more detailed pricing options.
5.3.3 Gigamon Customer Services
Gigamon offers various technical support programs for its customers, ranging from basic to elite support levels. The basic support level, called Basic Product Support and Software Maintenance, provides 9x5 response during customer business hours and defect isolation or assistance with configuration and other "how to" questions. This level also includes full access to the latest software release updates via the VÜE Community website and return to factory and replacement for confirmed hardware defects.
The Enhanced Product Support and Software Maintenance level includes advance hardware replacement for confirmed hardware defects and is best suited for Gigamon products installed outside business-critical customer environments requiring improved hardware replacement or reduced spares stock objectives.
The Elite Product Support and Software Maintenance level provides 24x7 response to customer issues and is best suited for Gigamon products installed in mission-critical customer business environments. This level includes "anytime access" to technical support professionals and subject matter experts with reduced response time objectives.
Gigamon also offers hardware replacement services, including Advance Hardware Replacement (AHR) for confirmed hardware defects. AHR provides either same-day or next-business-day shipping services, depending on local time completion of return material authorization (RMA). Simplified hardware returns using select regional depots are also available internationally.
Overall, Gigamon's technical support programs are designed to help customers quickly resolve technical issues with their products and maintain their network infrastructure. The programs offer a range of benefits, including 24x7 access to technical support professionals, access to subject matter experts, and full access to the latest software release updates via the VÜE Community website.
5.3.4 Gigamon User Interface


5.3.5 Gigamon User Reviews
"It is a best NDR solution for empowering security team to detect and respond to threats. Gives complete report of compromised devices and that too priority wise."
"I like is their real time threat detection , user friendly interface and cost effectiveness."
5.3.6 Gigamon Demo
5.4 Netscout nGeniusOne
Netscout nGeniusOne is a network performance management and analytics platform that provides end-to-end visibility into network traffic, applications, and services. It is designed to help IT teams proactively manage and optimize their network performance, reduce downtime, and quickly troubleshoot and resolve network issues.
The nGeniusOne platform uses advanced analytics and machine learning algorithms to analyze network traffic and provide insights into network behavior, application usage, and end-user experience. It captures and aggregates data from a range of sources, including physical and virtual networks, cloud environments, and third-party monitoring tools.

With nGeniusOne, IT teams can monitor network performance in real-time, identify and diagnose issues faster, and optimize network resources. The platform provides a range of features and capabilities, including:
- End-to-end visibility: nGeniusOne provides end-to-end visibility into network traffic, applications, and services, enabling IT teams to quickly identify and troubleshoot issues.
- Advanced analytics: The platform uses advanced analytics and machine learning algorithms to analyze network traffic and provide insights into network behavior, application usage, and end-user experience.
- Real-time monitoring: nGeniusOne provides real-time monitoring of network performance, allowing IT teams to quickly identify and resolve issues before they impact users.
- Collaboration and sharing: The platform enables IT teams to collaborate and share data across teams and departments, facilitating faster problem resolution.
- Scalability: nGeniusOne is highly scalable and can be deployed across large and complex network environments, providing a single view of network performance across the organization.
Overall, Netscout nGeniusOne is a comprehensive network performance management and analytics platform that provides IT teams with the tools they need to proactively manage and optimize their network performance, reduce downtime, and quickly troubleshoot and resolve network issues.
5.4.1 Netscout nGeniusOne Positioning
Netscout is a leading provider of communication service provider (CSP) solutions, offering a range of tools and technologies designed specifically for the needs of telecommunications service providers. The company's expertise in this area is demonstrated by its partnerships with major CSPs around the world, as well as its work with industry standards bodies to develop and promote best practices for network performance management and optimization.
Netscout's CSP solutions include advanced analytics and reporting capabilities, real-time monitoring and alerting, and a range of tools for troubleshooting and resolving network issues. These solutions are specifically tailored to the unique challenges faced by CSPs, such as the need to monitor and manage complex, distributed networks and ensure the quality and reliability of services delivered to customers.
As a result, Netscout is well-positioned to help CSPs improve their network performance, reduce downtime, and optimize their operations.
5.4.2 Netscout nGeniusOne Pricing
Pricing for Netscout nGeniusOne can vary based on factors such as product configuration, deployment model, and level of support. Contacting Netscout directly is the best way to receive accurate pricing information based on specific needs.
5.4.3 Netscout nGeniusOne Customer Services
Netscout nGeniusOne offers a range of customer service and support options to ensure that its customers have the resources and assistance they need to optimize their network performance. Some of the key customer service offerings from Netscout nGeniusOne include:
- Technical support: Netscout nGeniusOne provides technical support to customers 24 hours a day, seven days a week. Customers can access support via phone, email, or through Netscout's online support portal.
- Training and certification: Netscout nGeniusOne offers training and certification programs to help customers gain expertise in using the platform effectively. This includes both in-person and online training options, as well as certification exams to validate knowledge and skills.
- Professional services: Netscout nGeniusOne offers a range of professional services to help customers optimize their use of the platform and address specific network performance challenges. This includes consulting services, customization and integration support, and performance assessments.
- Community and knowledge base: Netscout nGeniusOne maintains an online community and knowledge base where customers can connect with other users, share best practices, and access a range of resources to help them get the most out of the platform.
- Customer success: Netscout nGeniusOne is committed to ensuring the success of its customers and offers a range of resources to help them achieve their network performance goals. This includes ongoing support, access to Netscout's network of partners and industry experts, and regular updates and enhancements to the platform to address evolving customer needs.
Overall, Netscout nGeniusOne's customer service offerings are designed to ensure that customers have the resources, support, and expertise they need to successfully manage and optimize their network performance.
5.4.4 Netscout nGeniusOne User Interface


5.4.5 Netscout nGeniusOne User Reviews
"The fact that it's able to capture and store packets from the wires is very useful for troubleshooting with our vendors, when issues do come up."
"It reduces troubleshooting time because you can get a much better view into the communications path between servers, database servers, web servers, and understand what's going on."
5.4.6 Netscout Demo
5.5 Extrahop Revealx
ExtraHop's specialty is in network detection and response (NDR). NDR is a category of security solutions that provide real-time monitoring and analysis of network traffic to detect and respond to security threats and anomalous behavior.
ExtraHop's NDR platform, Reveal(x), is designed to provide complete visibility into network activity, detect threats and anomalies using advanced machine learning and behavioral analysis, and enable rapid response to security incidents. The platform offers a range of features and capabilities, including real-time network traffic analysis, automated incident response workflows, and integration with other security tools and platforms.

In addition to NDR, ExtraHop also offers application performance monitoring (APM) solutions, which provide visibility and insights into the performance of applications and IT systems. ExtraHop's APM solutions are designed to help organizations identify and troubleshoot issues that may impact application performance, and optimize application and infrastructure performance for better user experiences.
5.5.1 Extrahop Revealx Positioning
ExtraHop Reveal(x) is a network detection and response (NDR) platform that helps organizations monitor and secure their IT environments. The platform uses real-time network traffic analysis and machine learning to provide visibility and insights into network activity, detect threats and anomalies, and respond quickly to security incidents.
ExtraHop Reveal(x) offers a range of features and capabilities to help organizations improve their security posture, including:
- Automatic discovery of devices and assets on the network
- Real-time monitoring of network traffic and behavior
- Advanced threat detection using machine learning and behavioral analysis
- Automated response and investigation workflows
- Integration with third-party security tools and platforms
- Compliance reporting and auditing capabilities
- Application performance monitoring and troubleshooting tools
Overall, ExtraHop Reveal(x) is designed to help organizations improve their security posture and reduce the risk of data breaches and cyber attacks by providing real-time visibility into network activity, detecting threats and anomalies quickly, and enabling rapid response to security incidents.
5.5.2 Extrahop Revealx Pricing
ExtraHop's Reveal(x) platform offers a range of network detection and response solutions, including agentless continuous traffic monitoring, L2-L7 analysis, and daily record capacity. The platform is available as SaaS sensors on AWS, with different tiers of capabilities to suit a variety of business needs.
The different tiers of capabilities allow organizations to choose the right solution for their specific needs and budget, with the flexibility to pay on a monthly basis.
5.5.3 Extrahop Revealx Customer Services
ExtraHop offers a range of customer services to help organizations get the most out of their network monitoring solutions.
Some of their key customer service offerings include:
- Technical Support: ExtraHop provides technical support services to help customers troubleshoot issues and resolve problems with their network monitoring solutions. This includes phone and email support, as well as access to online resources such as a knowledge base, user forums, and video tutorials.
- Professional Services: ExtraHop offers professional services to help customers with the implementation, configuration, and customization of their network monitoring solutions. This includes consulting services, training and education, and project management services.
- Customer Success: ExtraHop's customer success team works closely with customers to understand their business needs and help them achieve their network monitoring goals. This includes regular check-ins, performance reviews, and access to best practices and industry expertise.
- Community: ExtraHop has a strong user community that includes customers, partners, and industry experts. The community provides a platform for collaboration, knowledge sharing, and support, with resources such as user groups, forums, and events.
Overall, ExtraHop is committed to providing its customers with comprehensive support and services to help them maximize the value of their network monitoring solutions and achieve their business objectives.
5.5.4 Extrahop Revealx User Interface


5.5.5 Extrahop Revealx User Reviews
"Overall, RevealX is easy to use and provides great visibility into the network."
"ExtraHOP provides great visibility for performance and security issues in our environment. Many of the detections, dashboards, and device groups provide easy starting points for learning to use extraHOP."
5.5.6 Extrahop Revealx Demo
5.6 Accedian Skylight
Accedian is a company that provides network performance monitoring and assurance solutions for communication service providers and enterprises. The company was founded in 2005 and is headquartered in Montreal, Canada, with offices around the world. Accedian's products and services help customers monitor, troubleshoot, and optimize the performance of their networks, applications, and services.
Some of the company's key offerings include network performance monitoring software, virtualized network probes, and network analytics solutions.

Accedian serves customers in various industries, including telecommunications, financial services, healthcare, and government.
5.6.1 Accedian Skylight Positioning
Skylight by Accedian is a real-time network and application performance monitoring and analytics platform. It provides end-to-end visibility into the performance of hybrid, multi-cloud, and on-premises networks and applications. Skylight uses advanced analytics, machine learning, and AI techniques to monitor and analyze the performance of network traffic and application transactions, providing insights into the user experience, application performance, and network health.
Skylight is designed to help organizations optimize their network and application performance by identifying and resolving issues quickly, reducing downtime, and improving user satisfaction. The platform can be deployed on-premises, in the cloud, or as a hybrid solution, and is available as a software-based or virtualized solution. Skylight supports a wide range of network technologies and protocols, including SD-WAN, MPLS, Wi-Fi, and 5G. The platform is used by enterprises and service providers in various industries, including financial services, healthcare, retail, and government.
5.6.2 Accedian Skylight Pricing
Accedian's Skylight Platform's pricing information is not publicly available. The pricing for Skylight Platform is typically determined based on a variety of factors and could be discussed directly with their sales team.
5.6.3 Accedian Skylight Customer Services
Accedian offers a range of customer services to help ensure that their customers can effectively use and maintain their network performance monitoring solutions. Some of the key customer services offered by Accedian include:
- Technical Support: Accedian's technical support team is available to assist customers with any questions or issues they may have with their network monitoring solutions. Technical support is available through email, phone, and an online support portal, and Accedian offers various service level agreements (SLAs) to ensure timely and effective support.
- Training and Certification: Accedian offers training and certification programs to help customers get the most out of their network monitoring solutions. These programs include both online and in-person training, and cover topics such as product installation, configuration, and troubleshooting.
- Professional Services: Accedian offers a range of professional services to help customers optimize their network performance monitoring solutions. These services include network assessment templates and design, installation and deployment, and ongoing maintenance and support.
- Customer Success Management: Accedian's customer success management team works closely with customers to ensure that they are achieving their desired business outcomes with their network monitoring solutions. This includes regular check-ins, proactive monitoring and reporting, and ongoing optimization and improvement.
Overall, Accedian's customer services are designed to help customers effectively use and maintain their network performance monitoring solutions, and to ensure that they are getting the most out of their investment.
5.6.4 Accedian Skylight User Interface


5.6.5 Accedian Skylight User Reviews
"As per my usage and observation this is one of the best monitoring and also helps to analysis application for network and its up/down traffic."
"Skylight excels in helping businesses manage their operations efficiently."
5.6.6 Accedian Skylight Demo
Empowering Businesses to Make Informed Decisions: A Comprehensive Guide to Network Monitoring Software
In conclusion, our aim was to provide businesses with a comprehensive understanding of the various network monitoring software available on the market today.

By categorizing these solutions and presenting them in an easy-to-understand format with user interface, demos, and pricing information, we hope to have helped you make informed decisions on the best tool to meet their specific network monitoring needs.
Our guide provides an unbiased list of network monitoring software solutions, free from any influence or bias from websites who may charge exorbitant fees for listing their products. Throughout this guide, we have strived to remain neutral in our presentation of each network monitoring software solution, providing factual information to help businesses make informed decisions. In a world where promotional information can be hard to distinguish from genuine reviews, we understand the importance of presenting an unbiased and neutral perspective to our readers.
We understand that choosing the right solution can be a daunting task, but with our guide, we hope that we helped you a bit.
If you're interested in learning more about network monitoring, feel free to test our app without any obligation or pressure from us. We're here to help and provide useful information, not to harass or push sales.
- 14-day free trial of all premium features
- Deploy in just 10 minutes
- Monitor performance in all key network locations
- Measure real-time network metrics
- Identify and troubleshoot live network problems
This page is compiled from the information available on the software’s official website. We have made every attempt to ensure the accuracy and reliability of the information provided in this article. However, the information is provided “as is” without warranty of any kind. Obkio is not liable for any inaccuracies in the article due to changes made on their websites or any development made to their products after the date of publication of this article. Please refer to their websites for more information.

