




 Obkio Blog


 Subscribe
Table of Contents
Table of Contents
Most ISP problems don't show up as low speed. They show up as calls that break up every afternoon, a cloud app that times out at one branch, or a connection that drops for 30 seconds and recovers before anyone can test it. By the time someone runs a speed test, the results look fine, and ISP support asks for evidence you don't have.
To monitor your ISP's performance effectively, measure latency, jitter, packet loss and throughput continuously, not just by performing one-off speed tests. Measure from each of your locations to points inside and beyond your ISP's network, so you can tell a problem on your own network from a problem with your provider. Then keep a record of every degradation, with dates, metrics and the hop where it started, so your ISP has something concrete to act on.
Continuous monitoring solves this by measuring all the time, so the data is already there when something goes wrong. A network monitoring solution like Obkio does it from every site without the scripts and spare hardware a DIY setup needs.
This article covers which ISP performance metrics to track, how to set up monitoring step by step, and how the main tool options compare.
Why Isn't a Speed Test Enough to Monitor Your ISP? 
A speed test measures one moment, to one server, and only download and upload speed. Most ISP problems are intermittent and show up as latency, jitter or packet loss, which a speed test either doesn't measure or misses because it wasn't running when the problem happened.
Speed tests are useful for one thing: checking whether you're getting the bandwidth you pay for. As a way to monitor your ISP, they fall short in four ways:
They only capture one moment: A test takes about 30 seconds. If the problem happens at 4:52 p.m. and the test runs at 5:10 p.m., the results look normal.
They only test one path: The test server is usually close to you, and often hosted inside your ISP's own network. A clean result doesn't tell you how traffic performs on the path to your cloud apps, your VoIP provider or your other sites.
They measure capacity, not quality: Download and upload speed tell you how much the connection can carry. They don't show the packet loss, jitter or latency spikes that make calls choppy and apps time out. Learn more about the difference in Network Speed vs. Bandwidth vs. Throughput.
They can't run constantly: A speed test saturates the link to measure it, so running one every few minutes would slow down everyone in the office.
A typical situation that happens is that VoIP calls at a branch office break up every evening between 5 and 7 p.m. Someone runs a speed test the next morning at 10 a.m. and gets the full speed on the contract. The ISP sees the result and closes the ticket. The problem was real, but the test ran at the wrong time and measured the wrong thing.
Evening slowdowns like this are often peak-hour congestion on the ISP's side, explained in Why Is My Internet Slow at Night?
Speed tests still have a place in ISP monitoring. Scheduled speed tests run at set times show whether your throughput holds up across the day. The gaps between tests are covered by continuous monitoring, which tracks latency, jitter and packet loss every second without saturating the link.

Internet slows down at night when your ISP’s network, or your own, runs out of capacity at peak hours. Here’s how to find the cause & prove it to your ISP.
Learn more

What ISP Performance Metrics Should You Track?
Track six metrics: latency, jitter, packet loss, throughput, availability and, if your teams rely on calls, MOS. Together they show whether your connection is up and whether it's good enough for the applications running over it.
Your ISP sells you bandwidth, but bandwidth only tells you how much the connection can carry. Whether it works well for your users depends on what happens to the traffic along the way. A connection can deliver its full contracted speed and still drop 3% of packets every afternoon: fine on a speed test, voices cutting out on a Teams call.
Measuring all six metrics also tells you what kind of problem you're dealing with. Packet loss and jitter that rise at the same time every day suggestcongestion. Latency that jumps suddenly and stays high suggests a routing change. Short, repeated drops point to an unstable line.
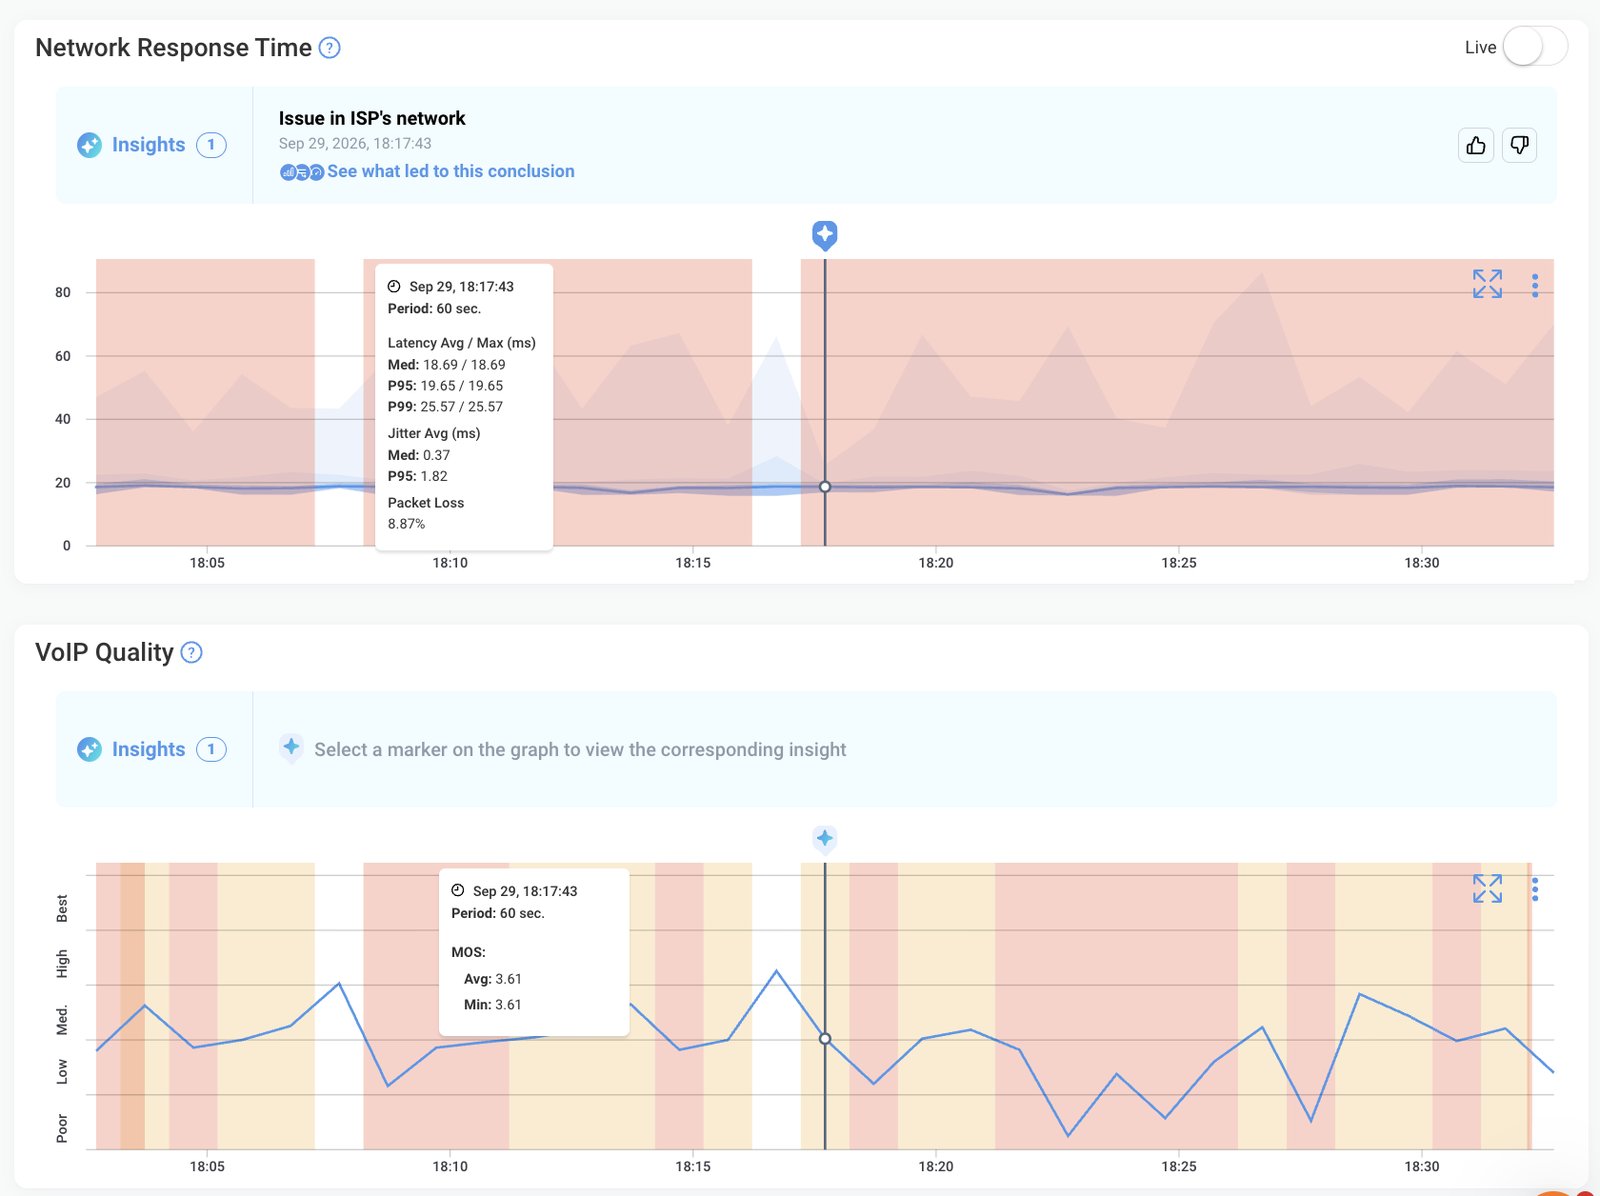
Here's what each metric tells you and when it's a warning sign:
- Latency: how long traffic takes to reach a destination and come back. Warning sign: sustained latency above 100 ms on a WAN path, or sudden jumps above your normal baseline.
- Jitter: how much latency varies from one packet to the next. Warning sign: jitter above 30 ms, which is usually when calls start to sound choppy.
- Packet loss: the share of packets that never reach their destination. Warning sign: loss above 1%, or any loss that lasts during calls and video meetings. See what counts as acceptable packet loss for each type of application.
- Throughput: how much data the connection actually carries. Warning sign: throughput that stays well below your contracted speed, especially at the same times every day.
- Availability (uptime): whether the connection is up. Warning sign: repeated short drops, even if each one lasts only a few seconds.
- MOS (Mean Opinion Score): an estimate of call quality on a scale of 1 to 5, calculated from latency, jitter and packet loss. Warning sign: a MOS below 3.5, where people start to notice robotic voices and words cutting out.
Thresholds are a starting point, not the full picture. A connection that normally runs at 20 ms and jumps to 80 ms every evening has a problem, even though 80 ms is under the warning line. That's why the step-by-step section below starts with setting a baseline for each location.
How to Monitor Your ISP's Performance, Step by Step
The six steps below take you from "the Internet feels slow" to a clear answer about where the problem is. Each step builds on the one before it, so if you already have part of this in place, start where you are.
Rule out your own network first, then set up continuous monitoring from each location, monitor the full path beyond your ISP, and track performance over time. When something degrades, use automated diagnostics to find where it started and share the data with your ISP.
Step 1. Rule Out Your Own Network First
Before you blame your ISP, make sure the problem isn't on your own network. Wi-Fi, a congested LAN or an overloaded firewall can all look exactly like an ISP issue.
A large share of "slow Internet" complaints start inside the building. A weak Wi-Fi signal, interference or a laptop roaming between access points causes packet loss and latency spikes that users experience as a bad connection. So does a firewall running out of CPU, or one person uploading a large file and filling the link for everyone else.
A few quick tests separate the two sources:
- Test from a wired device plugged in as close to your router or firewall as possible. If the problem disappears, it's on your LAN or Wi-Fi.
- Compare several devices and locations. If one user or one floor has issues and others don't, the ISP is unlikely to be the cause.
- Check your firewall and router. Look at CPU, memory and bandwidth usage at the time of the problem. A saturated device or link is your network's issue, not your provider's.
- Check other sites. If several offices on the same ISP slow down at once, that points to your provider. If only one does, look at that site's equipment and its local line.
For a full walkthrough of these checks, see How to Identify LAN Issues and How to Troubleshoot ISP Issues.
Manual tests only work while the problem is happening. The next step sets up continuous network monitoring, so you have the data on both sides of your gateway whenever an issue occurs.
Step 2. Set Up Continuous Monitoring from Each Location
Continuous monitoring works by sending small amounts of synthetic traffic between two points and measuring performance. Because the traffic is generated by the monitoring tool, not by users, it runs all the time, at a volume small enough that it never slows the connection the way a speed test does.
One way to set this up is withObkio, a SaaS network performance monitoring solution built for IT teams and MSPs who need to see performance across every location. Instead of relying on scripts or a single test server, it uses Monitoring Agents deployed at your sites and on the Internet to measure the network from end to end, and keeps the full history in one place.
Install a monitoring agent at each office or site, and have it exchange test traffic with agents out on the Internet. You get a constant measurement of latency, jitter and packet loss on the path through your ISP, including when nobody is looking.
With a solution like Obkio, the setup has two sides:
- Monitoring Agents at your locations: Deploy one at each office, branch or site, as a hardware, software or virtual agent. Install it on a wired connection close to your firewall, so the measurements reflect your Internet connection and not someone's Wi-Fi.
- Public Monitoring Agents on the Internet. Pair each site's agent with Public Monitoring Agents hosted in AWS, Azure and Google Cloud, or with agents hosted by ISPs in the Public Monitoring Agents Directory: These give you destinations on the far side of your ISP, so you're measuring the full path your traffic actually takes.
Agents exchange synthetic traffic every 500 ms, so short drops and spikes that last a few seconds show up in the data instead of disappearing between manual tests. Each session tracks latency, jitter, packet loss and VoIP quality (MOS) in both directions, and keeps the history, so you can go back to the exact moment users complained.
If you have several sites, add sessions between them too. Site-to-site results help you see whether a problem affects one location, one ISP or your whole network.
See your ISP's performance from every site, continuously.


Step 3. Monitor the Path, Not Just the Endpoint
When a monitoring session shows packet loss between your office and a cloud region, the packet loss could be happening at your firewall, on your ISP's local line, deep inside your ISP's network, or at a peering point with another provider. Each of those has a different owner and a different fix. The path is what tells them apart.
Monitoring between two points tells you that performance dropped. Traceroutes tell you where. Track the route from each site through your ISP to the destination, and look for the hop where latency or packet loss starts.
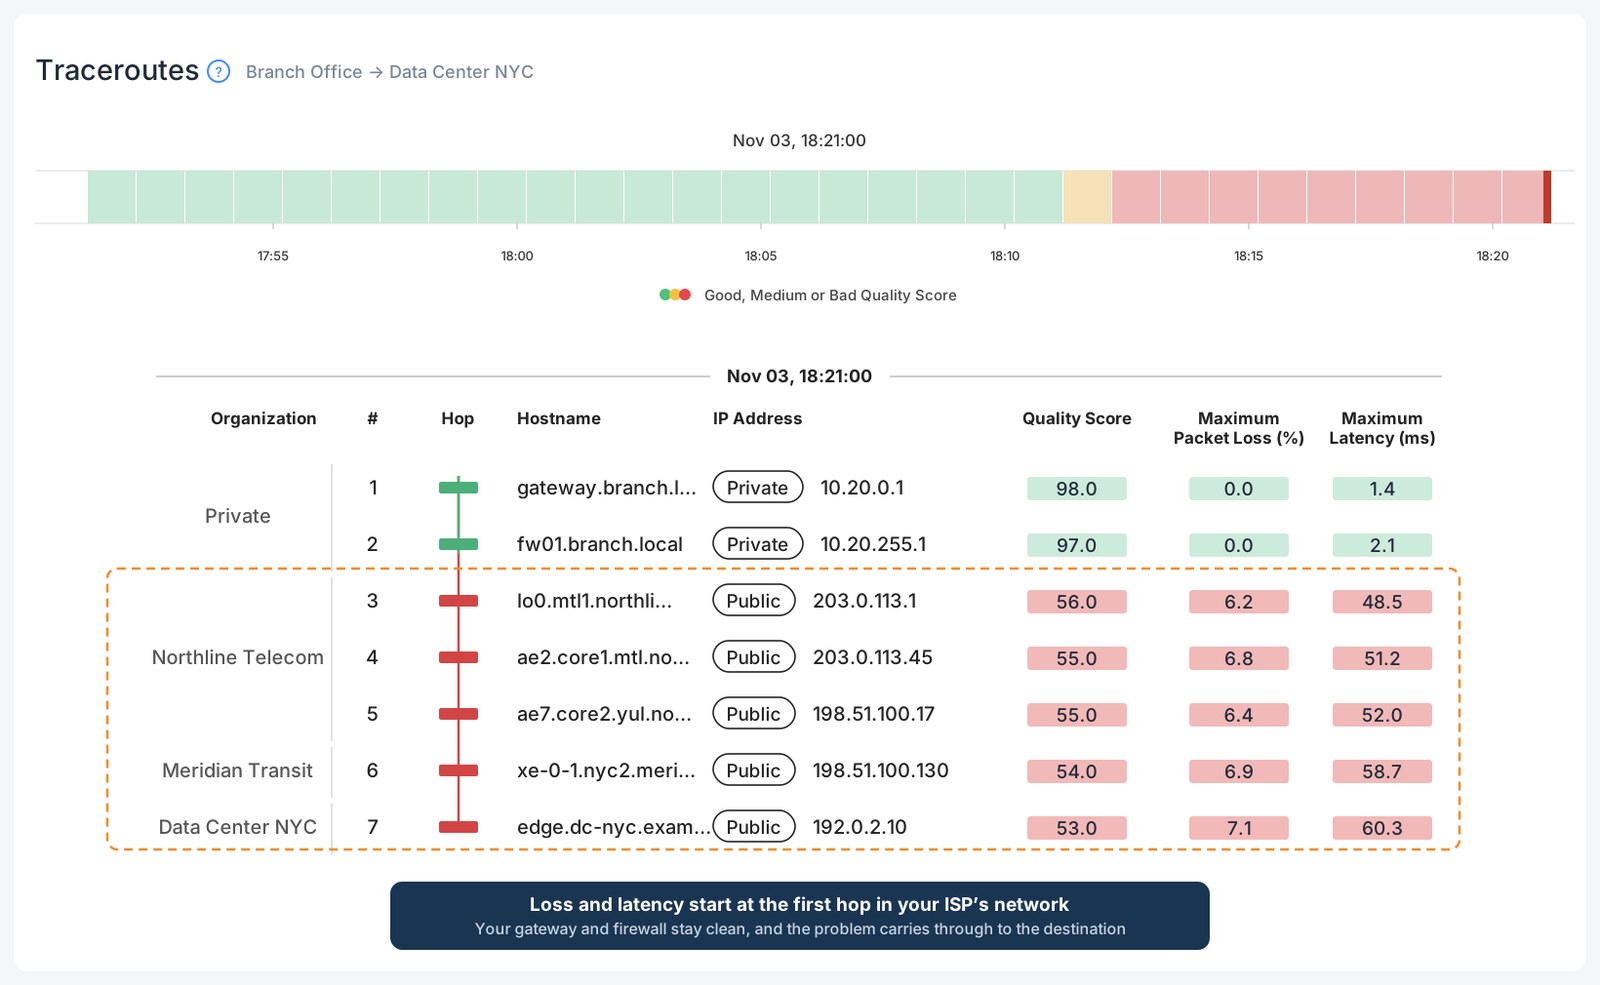
Visual Traceroutes show every hop between your Monitoring Agent and the destination, with the latency and packet loss measured at each one. They run automatically alongside your monitoring sessions, so when an issue appears in the session graphs, the route data from the same moment is already there.
When you read the path, a few patterns tell you most of what you need:
- Loss or latency that starts at one hop and continues to the destination is real. The problem begins at or just before that hop.
- Loss at a hop in the middle that disappears at the next hop is usually not a problem. Many routers deprioritize replies to traceroute probes, so they show loss that isn't affecting your traffic. See why some routers drop packets or show high latency in traceroutes.
- A jump right after your gateway, at your ISP's first hop, often points to the local line between your site and your provider. See ISP local loop issues.
- A jump between two networks further out suggests congestion at a peering or transit point, between your ISP and the next provider on the path.
Why a one-off traceroute or MTR often misses the problem
Running traceroute or MTR by hand has the same weakness as a speed test: it only shows the moment you run it. If the issue lasted 10 minutes at 3 p.m., a test at 4 p.m. shows a clean path. Routes also change throughout the day, and the path back to you can be different from the path out, so a single test from one side can point you at the wrong network. Internet traffic is often asymmetrical, which is why route data from both directions, collected over time, is far more reliable than a single run.
Step 4. Track ISP Performance at Peak Hours and Over Time
A single bad measurement doesn't tell you much. A pattern does. After a week or two of continuous monitoring, each site has a baseline: its normal latency, jitter and packet loss toward each destination. Once you know what normal looks like, it becomes easy to spot when performance moves away from it, and how often.
Build a baseline for each location, then compare performance across the day and the week. Problems that come back at the same time are the easiest to tie to your ISP and the hardest to catch with one-off tests.
Compare the same network metrics across different periods:
- Business hours versus evenings: Latency and packet loss that rise every day between 5 and 9 p.m. usually point to congestion on your ISP's network, when residential traffic peaks on shared infrastructure. See Why Is My Internet Slow at Night?
- Weekdays versus weekends: If degradation follows your office hours instead of residential peaks, the cause is more likely your own usage filling the link.
- Before and after a change: A new circuit, a router replacement or a change on your ISP's side often shows up as a step change in the baseline, sometimes for the better, sometimes not.
- Week over week: Slow creep, like latency rising a few milliseconds every week, never triggers an alert but shows up clearly in a longer view.
Monitoring history also changes the conversation with your ISP. Instead of "the Internet was slow yesterday," you can point to the exact times, the metrics and how often it happened over the last month.
With Obkio, the session graphs keep this history for each site, and you can zoom from a month down to the minute an issue started. Alerts are also based on historical data rather than only static thresholds, so you're notified when a location drifts from its own normal, not just when it crosses a fixed number.
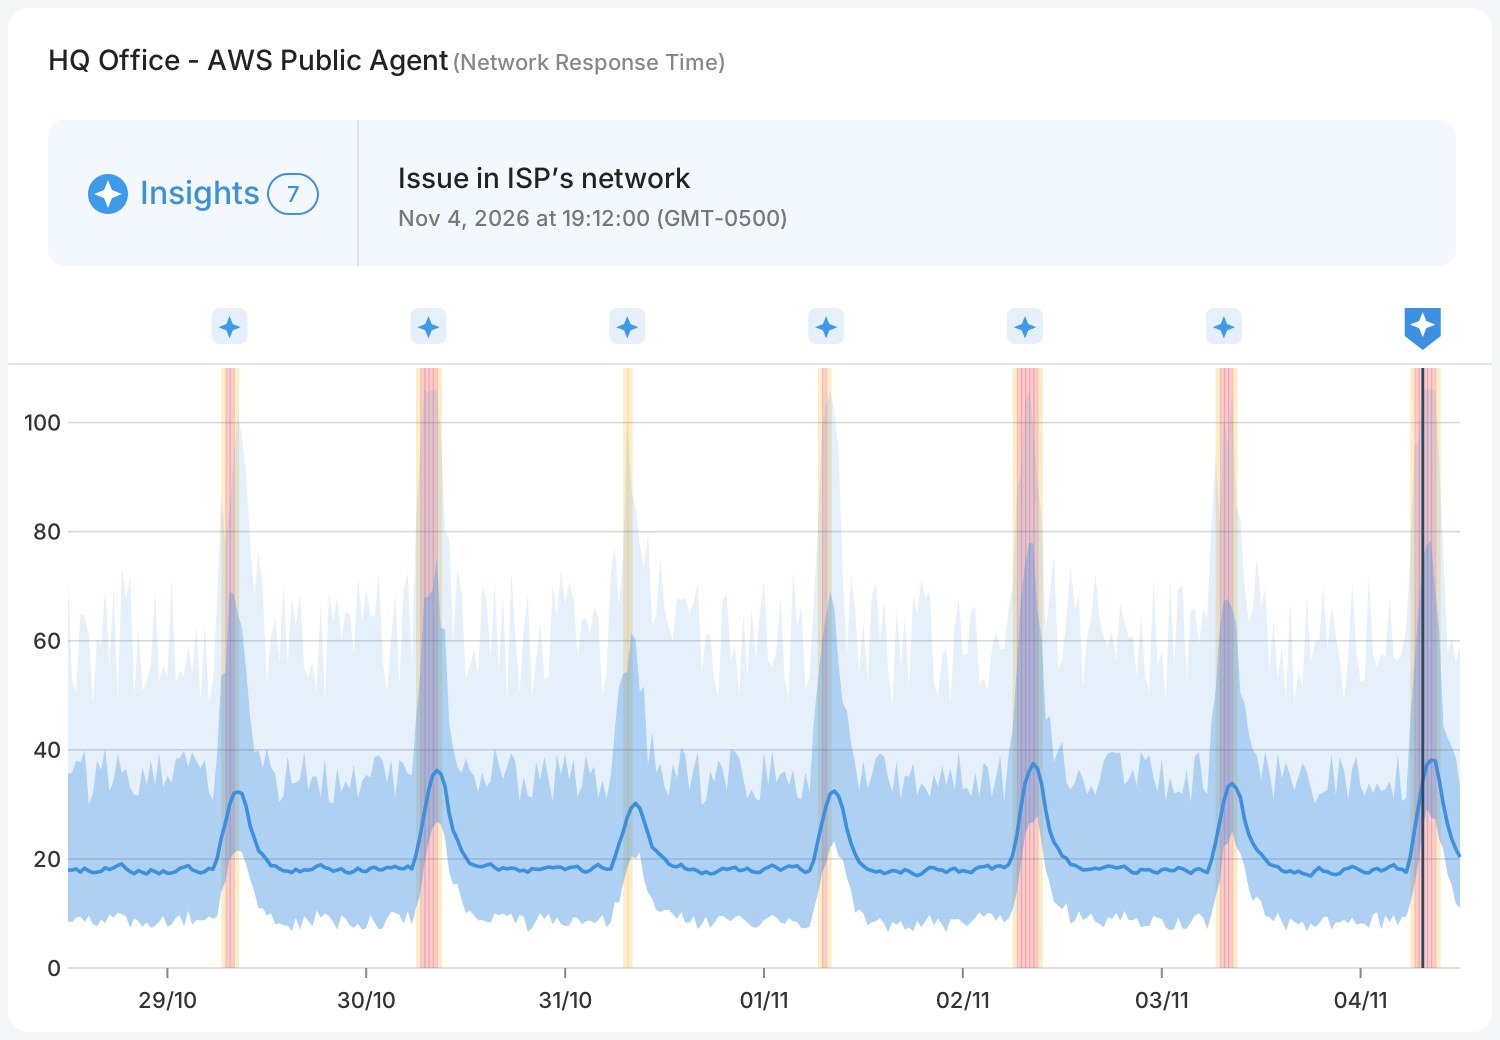
Tip: The same history you use to spot patterns also shows whether your ISP is meeting its SLA. Compare availability, latency and packet loss each month against what your contract promises, and see SLA Monitoring for automated SLA reports.
How to tell if your ISP is throttling your connection
A common test is to compare performance with and without a VPN: if a specific service is fast through the VPN and slow without it, your ISP may be shaping that traffic. Continuous data makes the pattern much easier to confirm, since throttling tends to follow a schedule or a type of traffic. For the full method, see Is Your ISP Throttling Your Business Internet?

Is your ISP throttling your Internet? Learn how to tell ISP throttling from congestion, test it step by step, prove it to your ISP with data & stop it.
Learn more
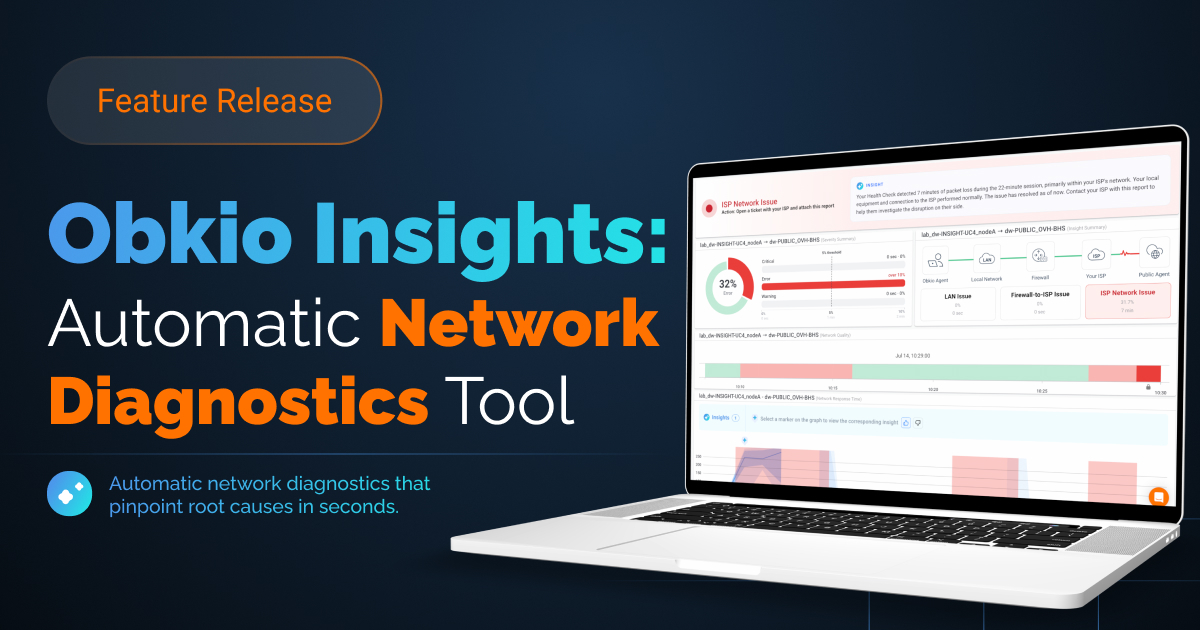
Step 5. Let Obkio Insights Find the Root Cause of ISP Performance Issues
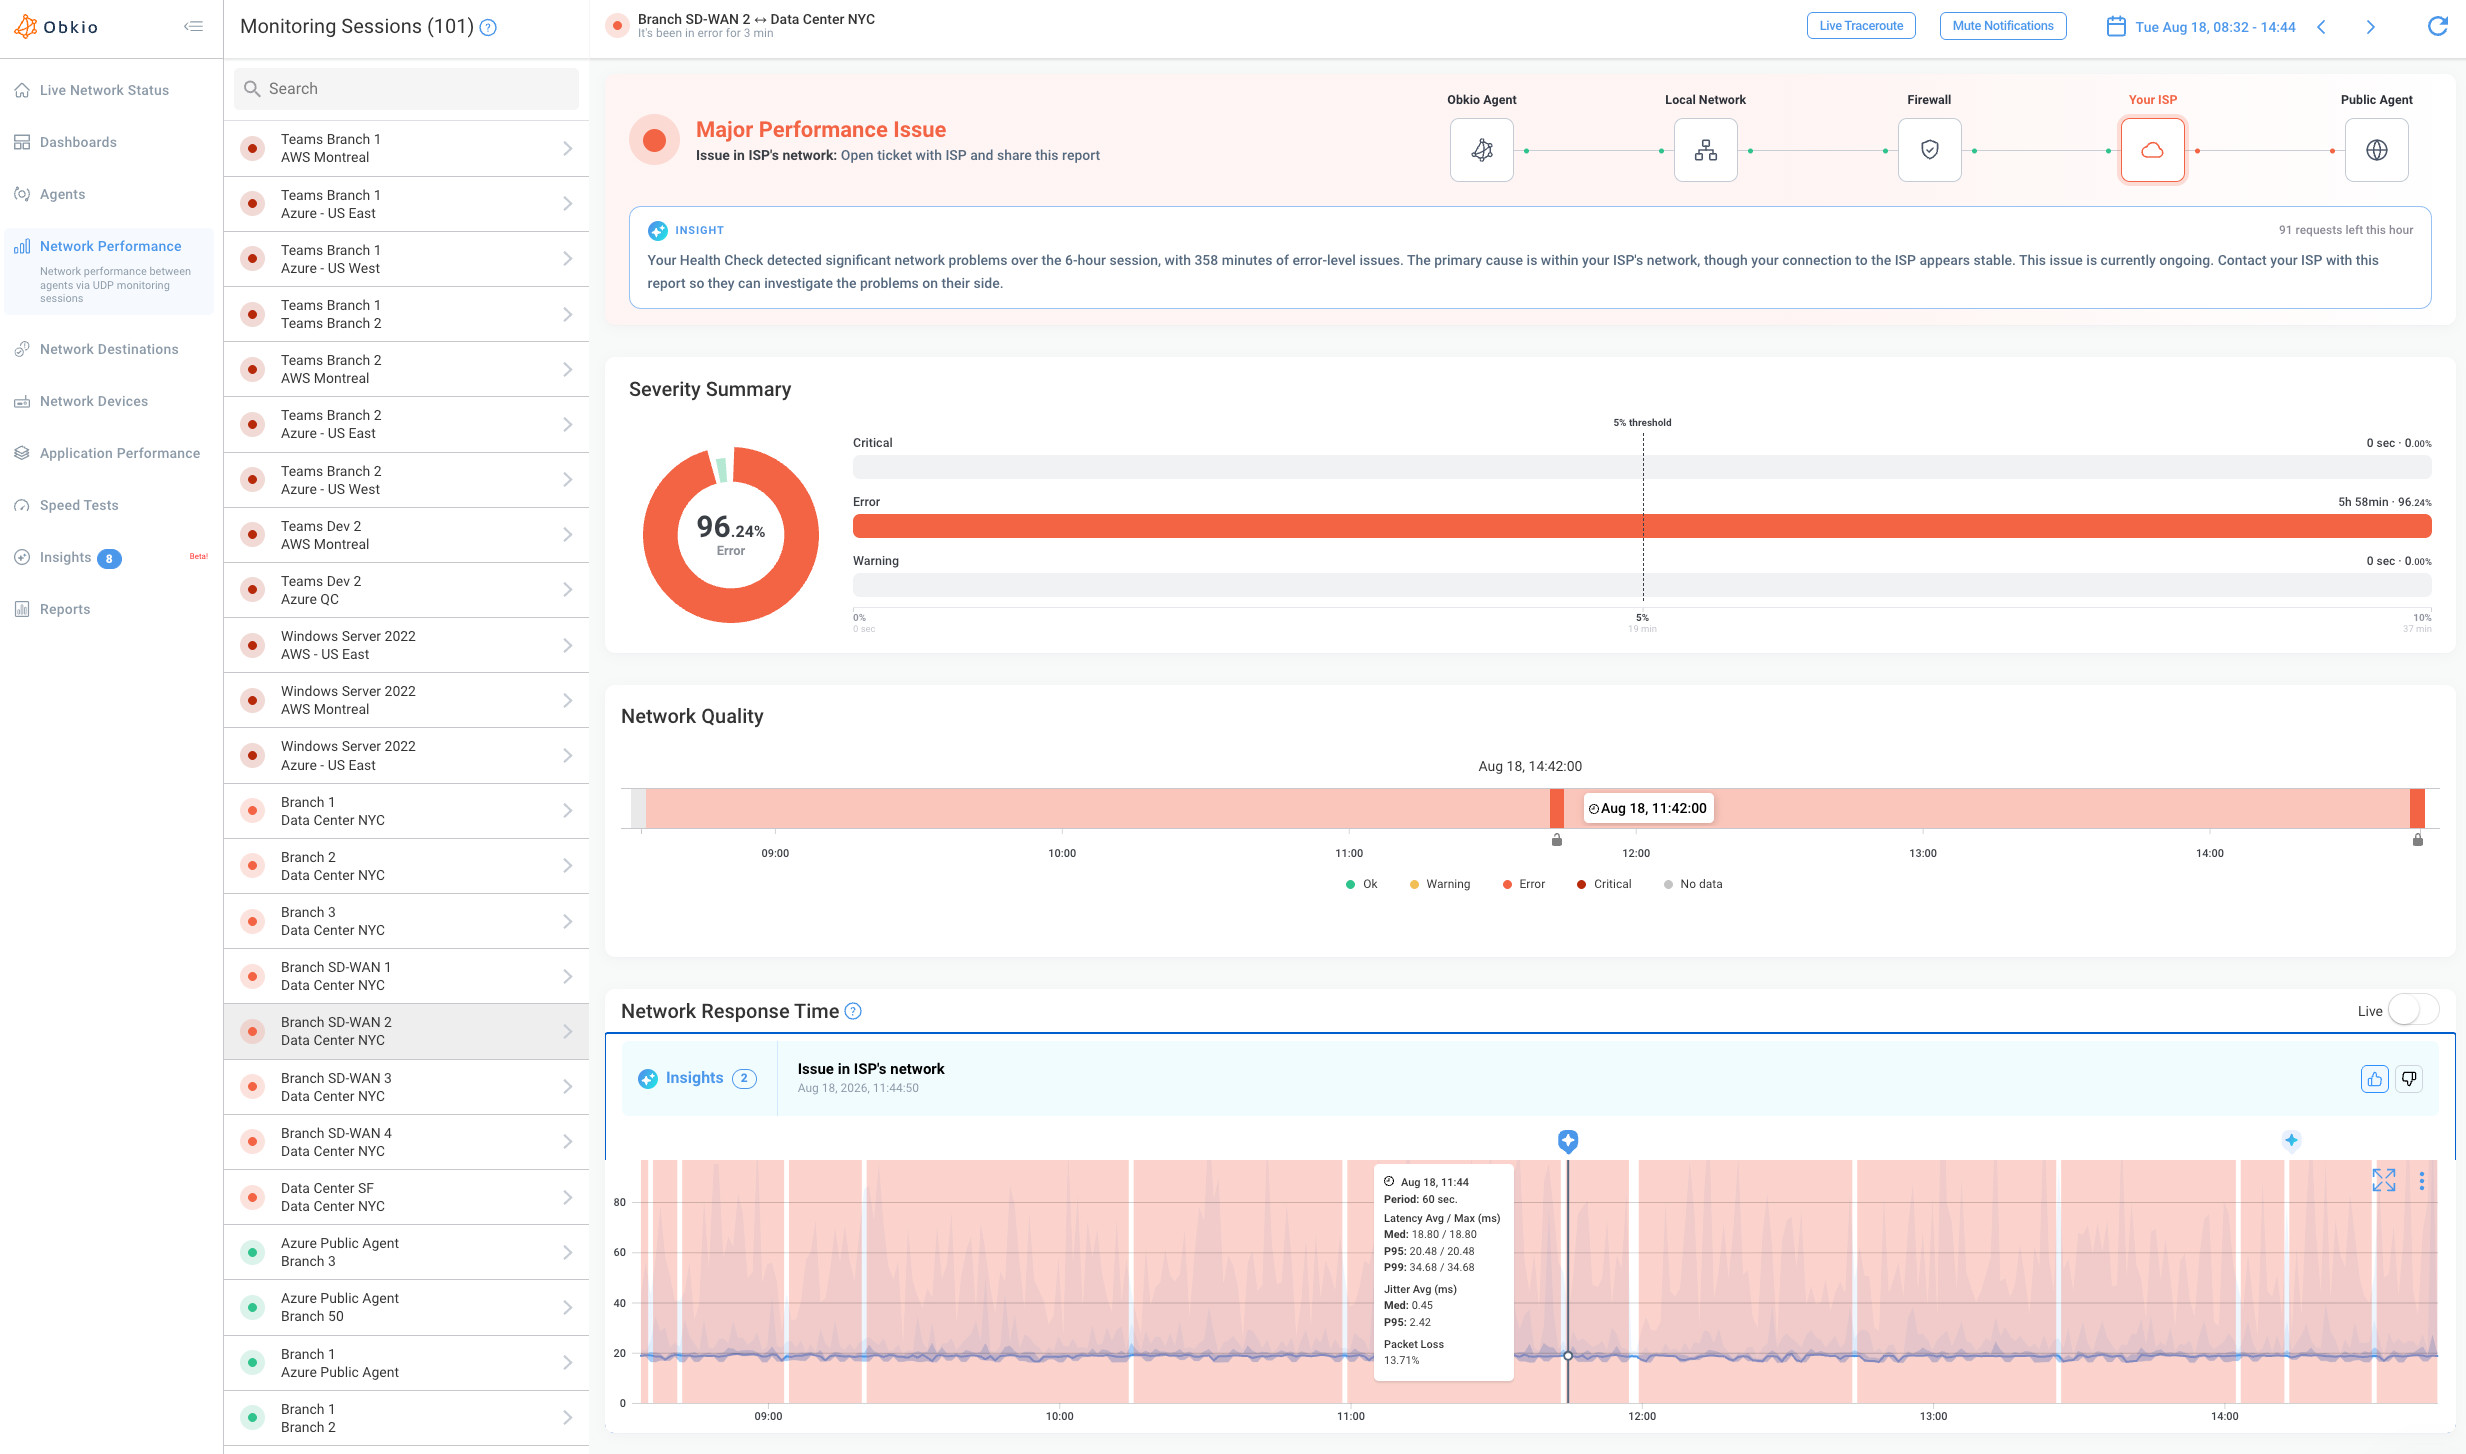
Instead of reading graphs and traceroutes yourself, let automated diagnostics do the correlation. Obkio Insights analyzes your monitoring data and tells you whether an issue looks like your local network, your firewall, your ISP or something further out.
Steps 2 to 4 give you all the data you need. The hard part is reading it: lining up a spike in a session graph with the traceroute from the same minute, checking whether the firewall was overloaded at the time, and working out which network the problem actually starts in. That takes time and experience, and it usually happens while users are waiting.
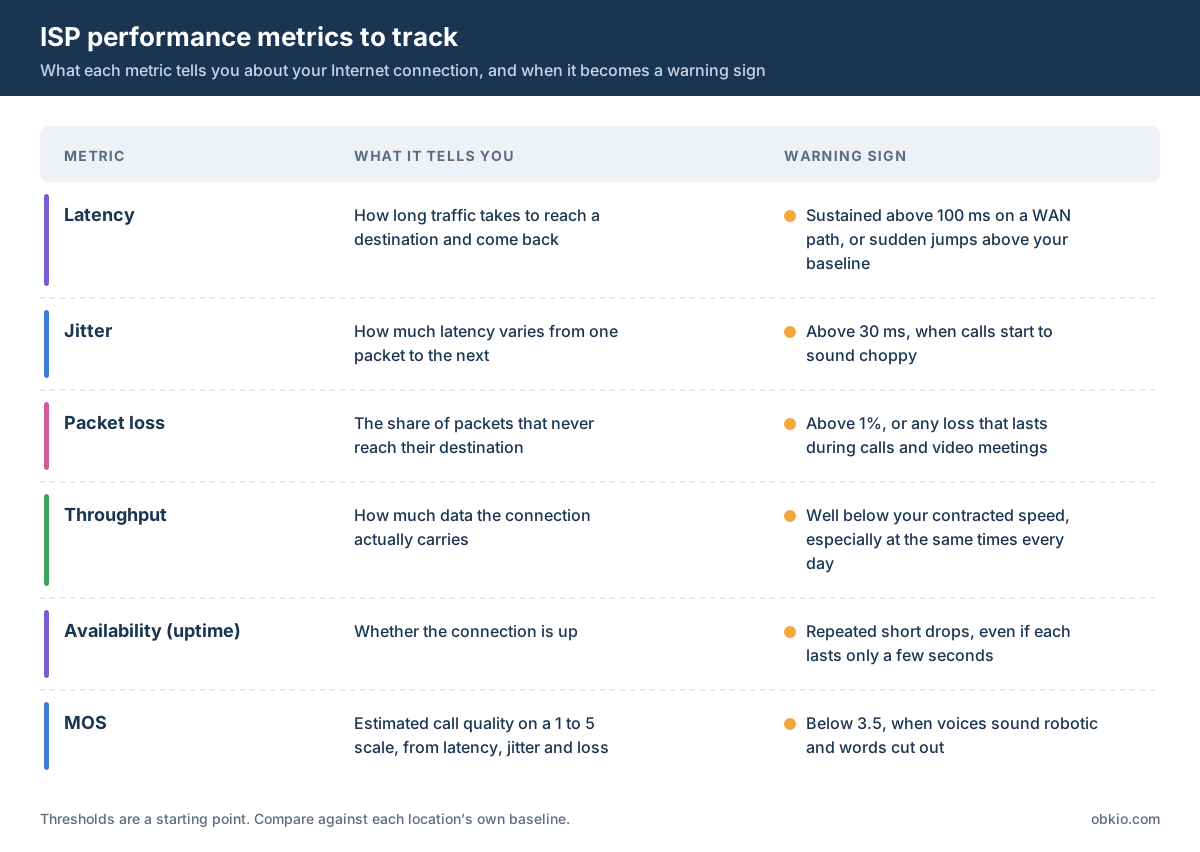
Obkio Insights automates that work. It cross-references your network performance sessions, traceroutes and device data to identify the likely root cause of each issue, and names it in plain language. When the problem is on your provider's side, you get an Insight like "Issue in ISP Network," based on how the degradation shows up in your sessions and where it starts on the path, after your own network ends.
Insights is just as useful when the problem isn't your ISP. If the data points to a saturated link, an overloaded firewall or a problem on your LAN, it says so, so you can fix it yourself instead of opening a ticket that will bounce back. And if your network and your ISP both look healthy, that's a clear answer too: the issue is more likely with the application or the destination.
Step 6. Share the Data with Your ISP
When the problem is on your ISP's side, send them the monitoring data itself, not a screenshot. A shareable link gives their support team read-only access to the same session you're looking at, with no account or login needed.
ISP support teams ask for evidence, and screenshots rarely get a ticket very far. They show one moment; they can't be explored, and they start an email back-and-forth that slows everything down.
Shareable links solve this by giving your ISP direct, read-only access to a Network Monitoring Session. Anyone with the link can open it without an Obkio account. The page shows:
- The session status and Severity Summary
- The Network Quality, Network Response Time and VoIP Quality graphs
- Traceroutes in both directions
Your ISP's engineers can change the date range to any period, so they can look at last Tuesday's evening drops for themselves instead of taking your word for it. Your organization's name isn't shown on the page, and shared pages aren't indexed by search engines.
You stay in control of access. Pick an expiry when you create the link, from 1 day up to 2 years (7 days by default), extend or shorten it later, and revoke it once the ticket is closed.
Tip: Shareable links are turned off by default. An Administrator needs to enable them in your organization settings before anyone can create one. See the shareable links documentation for the steps.
Sending the link is the start of the escalation, not all of it. For what to include in the ticket, how to escalate when support stalls, and a ready-to-use email template, see How to Prove Your ISP Is the Problem and download the ISP escalation toolkit.
Which Tool Should You Use to Monitor Your ISP Performance?
Speed tests and DIY ping scripts can show that something is wrong, and device monitoring shows what your own equipment is doing. To see your ISP's performance from end to end, over time and with the path included, you need continuous synthetic monitoring between agents.
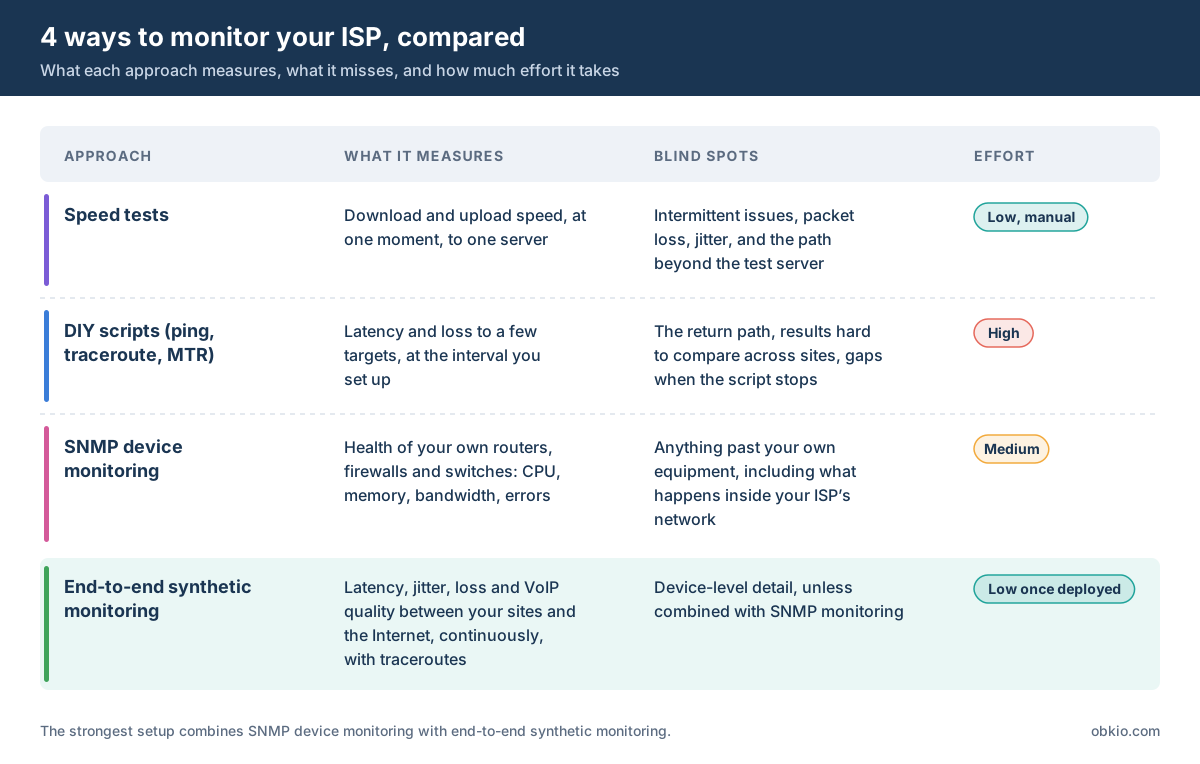
Most teams start with what they already have and add tools as problems get harder to explain. Here's how the four common approaches compare:
Speed tests
- Measures: download and upload speed, at one moment, to one server.
- Blind spots: intermittent issues, packet loss, jitter, and the path beyond the test server.
- Effort: low, but manual.
DIY scripts (ping, traceroute, MTR on a schedule)
- Measures: latency and loss to a few targets, at whatever interval you set up.
- Blind spots: the return path, results that are hard to compare across sites, and gaps whenever the script or the machine running it stops.
- Effort: high. You build, store, graph and maintain everything yourself.
-
- Measures: the health of your own routers, firewalls and switches, including CPU, memory, interface bandwidth and errors.
- Blind spots: anything past your own equipment. It can show your link is full, but not what happens to your traffic inside your ISP's network.
- Effort: medium. Setup on each device, then ongoing tuning.
End-to-end synthetic monitoring
- Measures: latency, jitter, packet loss and VoIP quality between your sites and points on the Internet, continuously, with traceroutes for the path.
- Blind spots: device-level detail, unless combined with SNMP monitoring.
- Effort: low once agents are deployed.
Each has a place. A speed test is a quick sanity check, and SNMP monitoring tells you whether your own equipment is the bottleneck. But only end-to-end monitoring shows how your ISP performs from your users' side, all day, every day.
The strongest setup combines the last two. Obkio does both: Network Device Monitoring watches your firewalls and routers over SNMP, while Monitoring Agents measure the path through your ISP. When an issue appears, you can see in one place whether your equipment or your provider is the cause. For a broader look at the options, see the best network monitoring tools.
How to Monitor Multiple ISP Performance Across Multiple Sites
Multi-site organizations rarely have a single ISP. Branches end up on whatever provider was available locally, critical sites often have a backup link, and SD-WAN spreads traffic across two or more circuits at once. Each of those connections can fail or degrade on its own, so each one needs to be monitored on its own.
Monitor every site and every circuit separately, against the same set of destinations. That turns your monitoring data into a side-by-side comparison of your ISPs, and makes it clear when a problem affects one link, one provider or your whole network.
A few practices make multi-ISP monitoring much more useful:
- Measure each circuit separately: If a site has a primary and a backup link, make sure each one is monitored on its own. Otherwise, a failover can hide a degraded circuit, or a backup link can sit broken for weeks until the day you actually need it. See how to monitor network failover.
- Use the same destinations everywhere: When every site tests toward the same cloud regions and Public Monitoring Agents, the results are directly comparable. A provider that adds 30 ms more latency than the others to the same destination shows up immediately.
- Group sites by provider: If several offices on the same ISP degrade at the same time while sites on other providers stay healthy, that's strong evidence the problem is on that ISP's network.
- Give each site its own dashboard: A network-wide view shows which location has a problem. A per-site view shows what's happening there.
Tracking every ISP this way also gives you leverage beyond troubleshooting. Months of data on availability, latency, and packet loss per provider show whether each ISP is meeting its SLA, and give you real numbers when it's time to renegotiate a contract or switch providers. See how to monitor Internet SLAs for what to track.
If your sites run on SD-WAN, the same approach applies to every underlay circuit. Monitoring each one shows when your SD-WAN is routing around a bad link, and when it isn't. See SD-WAN monitoring, and for a full multi-site setup, how to monitor network performance for multi-site businesses.

Unlock the secrets of Internet SLA monitoring, optimize your online experience, and hold your ISP accountable. Empower your Internet journey!
Learn more
Frequently Asked Questions About Monitoring ISP Performance
How often should I monitor my ISP's performance?
Continuously. Most ISP problems are intermittent, so tests run once a day or on demand usually miss them. Continuous monitoring measures latency, jitter and packet loss every few hundred milliseconds, so short drops and peak-hour slowdowns show up in the data, along with the exact time they started.
Why does a speed test look fine when calls still break up?
A speed test measures how much bandwidth your connection has, not how stable it is. Calls break up because of packet loss, jitter and latency spikes, which a speed test either doesn't measure or misses if it runs at the wrong moment. Continuous monitoring tracks those metrics all day.
What does it mean when packet loss starts after my router?
If packet loss or latency starts at the first hop past your router or firewall and continues to the destination, the problem is likely on your ISP's side, often the local line. If the loss appears at only one hop in the middle and disappears at the next, it's usually a router deprioritizing traceroute replies, not a real problem.
What is a good latency for a business Internet connection?
For most business traffic, latency under 50 ms is good, and up to 100 ms is acceptable on a WAN path. Real-time applications like VoIP and video calls are more sensitive. More important than any single number is your own baseline: a sudden or recurring jump above normal is the real warning sign.
Can I monitor my ISP's performance for free?
You can run free speed tests and ping or traceroute scripts, but they only capture moments and take effort to maintain across sites. For continuous, end-to-end monitoring with traceroutes and automated diagnostics, you can start for free with Obkio and deploy your first agents in minutes.
Start Monitoring Your ISP's Performance
Monitoring your ISP comes down to one shift: measuring all the time instead of testing after something breaks. Rule out your own network first, then put agents at each site, watch the full path through your provider and build a baseline you can compare against. When performance drops, automated diagnostics tell you where the problem started, and a shareable link puts the same data in front of your ISP.
The result is that the next time users say the Internet is slow, you already know whether it's your network, your provider or something further out, and you have the data to back it up.

How long does it take your team today to know whether a slowdown is your network or your ISP? With continuous monitoring in place, the answer is already in the data before the first ticket comes in.


