

 Obkio Blog


 Subscribe
Table of Contents
Table of Contents
ISP congestion happens when part of your Internet provider's network carries more traffic than it can handle, so latency, jitter and packet loss rise inside their network, not yours. You'll notice slowdowns and choppy calls, often at peak hours. You prove it by showing that quality drops after your gateway, on the ISP's side of the path.
Your Internet circuit isn't anywhere near full, and your firewall looks healthy. Yet pages crawl, file uploads stall, and Microsoft Teams calls break up, often at the same times of day. You call your provider and hear the usual answer: everything looks fine on our end.
Sometimes that's true. Often it isn't. Your ISP's network is shared, and when a node, backbone link or peering point runs out of capacity, every customer behind it slows down. Nothing on your side has changed, and your own monitoring may not show anything wrong.
This article covers what ISP congestion is, how to confirm the problem really sits in your provider's network, and what to send your ISP so they act on it.
What is ISP Congestion? 
ISP congestion is a slowdown caused by a segment of your Internet provider's network receiving more traffic than its capacity, so packets queue or get dropped before they leave the ISP. It shows up as higher latency, jitter and packet loss on traffic that crosses that segment, even when your own connection has bandwidth to spare.
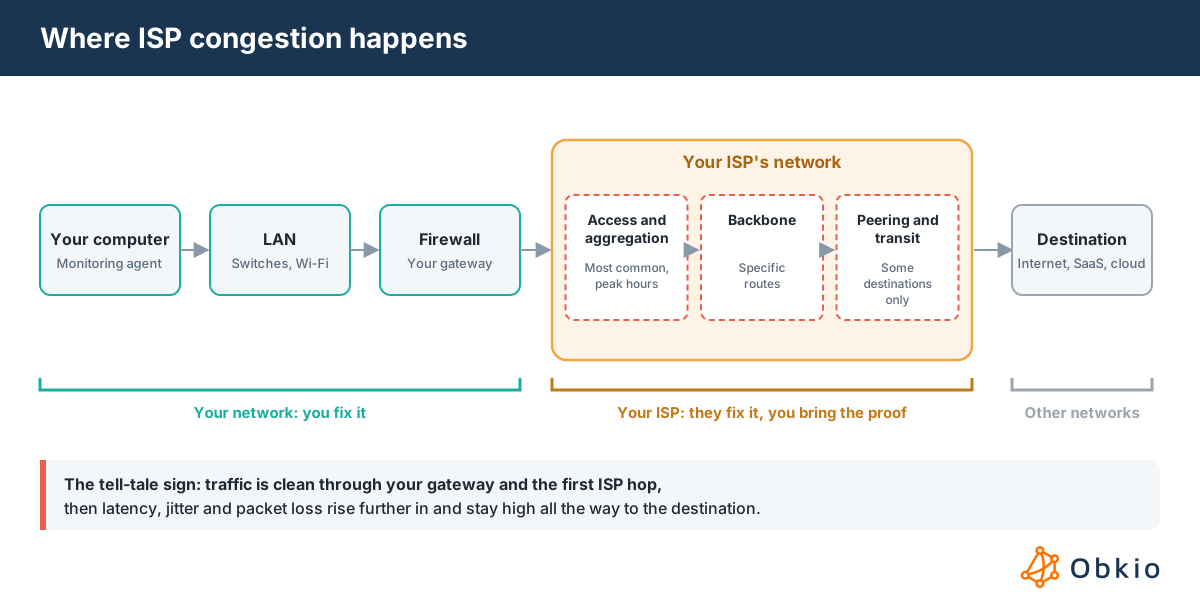
ISPs size their networks on the assumption that not every customer uses their full bandwidth at once. When actual demand exceeds that assumption, the shared links fill up. Congestion can build in three places inside a provider's network:
- Access and aggregation: the nodes that collect traffic from many customers in an area before handing it to the core. This is the most common spot, and the one most tied to peak hours.
- The backbone: the high-capacity links between the ISP's regional and core sites. Congestion here affects many areas at once, but usually only for traffic taking a specific route.
- Peering and transit links: the points where your ISP hands traffic to other networks. If one of these is full, only destinations reached through that link slow down, which is why one SaaS app can lag while everything else works.
ISP Congestion vs. Congestion on Your Own Internet Circuit
Both ISP congestion and local congestion feel identical to users: everything is slow. The difference is where the traffic jam sits, and that decides who has to fix it.
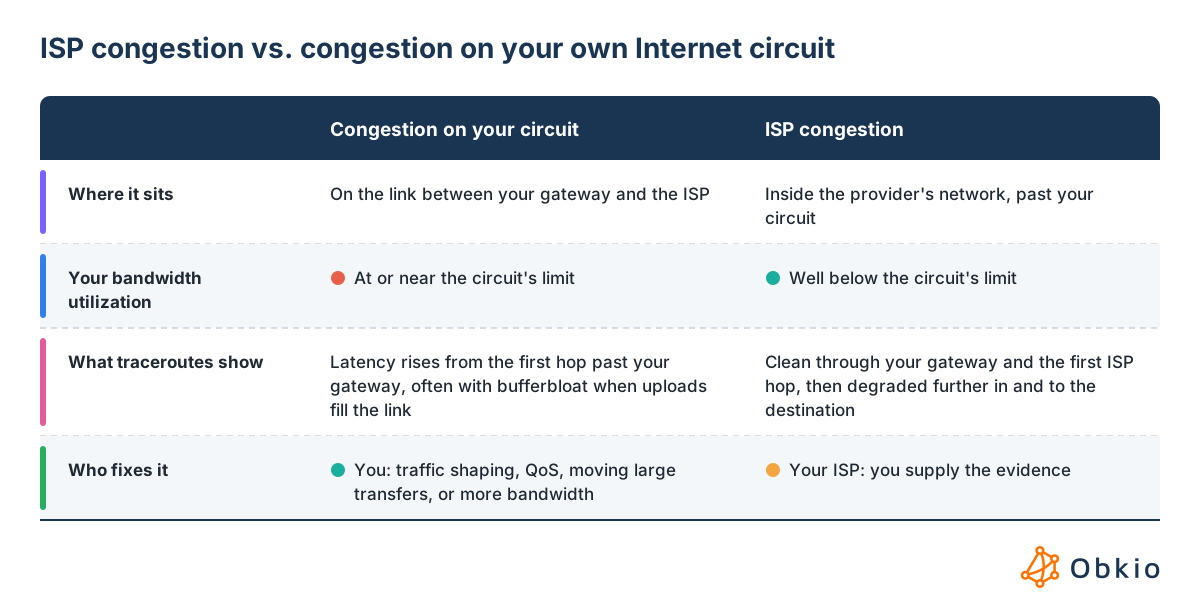
Congestion on your own Internet circuit:
- Sits on the link between your gateway and the ISP
- Your bandwidth utilization is at or near the circuit's limit
- Latency rises from the first hop past your gateway, often with bufferbloat when uploads fill the link
- You fix it: traffic shaping, QoS, moving large transfers, or more bandwidth
ISP congestion:
- Sits inside the provider's network, past your circuit
- Your bandwidth utilization stays well below the circuit's limit
- Traceroutes look clean through your gateway and the first ISP hop, then degrade further in and stay degraded to the destination
- Your ISP fixes it: you supply the evidence
If you aren't sure which one you're dealing with, start by checking your own circuit utilization. Our guide to Internet congestion covers the causes that sit on your side of the line.

Learn what causes Internet congestion, how to detect it on your network, and how to fix it before users notice.
Learn more

What Causes ISP Congestion?
ISP congestion comes down to one thing: demand on a shared segment of the provider's network exceeds its capacity. What changes is why demand outgrew capacity, and that affects when the congestion shows up and which traffic it hits.
1. Oversubscription in access and aggregation
ISPs sell more total bandwidth than their shared infrastructure can carry at once, on the assumption that customers rarely peak at the same moment. That model works until usage patterns shift: more customers join a node, remote work moves traffic into residential and business areas during the day, or a provider delays capacity upgrades.
When the aggregation link behind your area fills, every customer on that node slows down, regardless of the plan they pay for.
2. Peak-hour demand
ISP congestion caused by oversubscription is usually predictable. It builds when most customers are online at once, like business hours on business-heavy nodes, and evenings on mixed and residential ones.
If your slowdowns follow the same schedule every day, it's a strong sign the bottleneck is shared capacity, not your equipment. We cover the evening pattern in more detail in Why is my Internet slow at night?
3. Backbone saturation
Backbone links carry aggregated traffic between the ISP's regional and core sites. They're sized with more headroom than access links, so saturation here is less common, but it hits harder: a large event, a fibre cut that reroutes traffic, or growth that outpaces upgrades can congest a backbone path for every region that relies on it.
Because only traffic taking that path is affected, some destinations slow down while others stay normal.
4. Peering and transit congestion
Your traffic usually leaves your ISP's network to reach the destination, either through a direct peering link with the destination's network or through a transit provider. These handoffs are a frequent bottleneck, especially when the two networks disagree on who should pay for more capacity.
The result is congestion on one route only: a specific SaaS app, cloud region or content provider lags while everything else works.
5. Routing changes and failures
When a link or router fails inside the ISP's network, or the provider changes its routing, traffic shifts onto other paths. If the backup path has less capacity or is already busy, ISP congestion appears suddenly, often with a jump in latency because the new path is longer. These events tend to start abruptly rather than build gradually, and they can last until the original path comes back.
What Are Signs of ISP Congestion?
ISP congestion doesn't announce itself. Users report the same things they'd report for any network problem: the Internet is slow, it cuts out, calls are bad. What separates ISP congestion from a problem on your side is the pattern behind those complaints.
What users notice:
- Slow: pages, file transfers and SaaS apps take longer to load, even though nothing changed on your network
- Cuts out: connections stall or drop for a few seconds, then recover
- Bad calls: Teams, Zoom and VoIP calls get choppy, robotic or drop, usually before anything else feels slow, because real-time traffic can't recover from delay and loss the way a download can
The clues that point to ISP congestion:
- Your circuit isn't full: Latency, jitter and packet loss rise while your bandwidth utilization stays well below the circuit's limit. If your own link were the bottleneck, utilization would be near the top.
- It follows a schedule: Degradation starts and ends around the same times each day, typically business hours or evenings, when the shared capacity behind your node is busiest.
- Everyone on that ISP is affected: Users at the same site all feel it, on wired and Wi-Fi alike. If you have a second ISP or another site on a different provider, that connection stays normal.
- Only some destinations are slow: One SaaS app or cloud region lags while others work fine, which points to a congested peering or transit route rather than your connection as a whole.
- Nothing changed on your side: No new devices, no configuration changes, no firewall alerts, and your gateway's CPU and memory look normal.
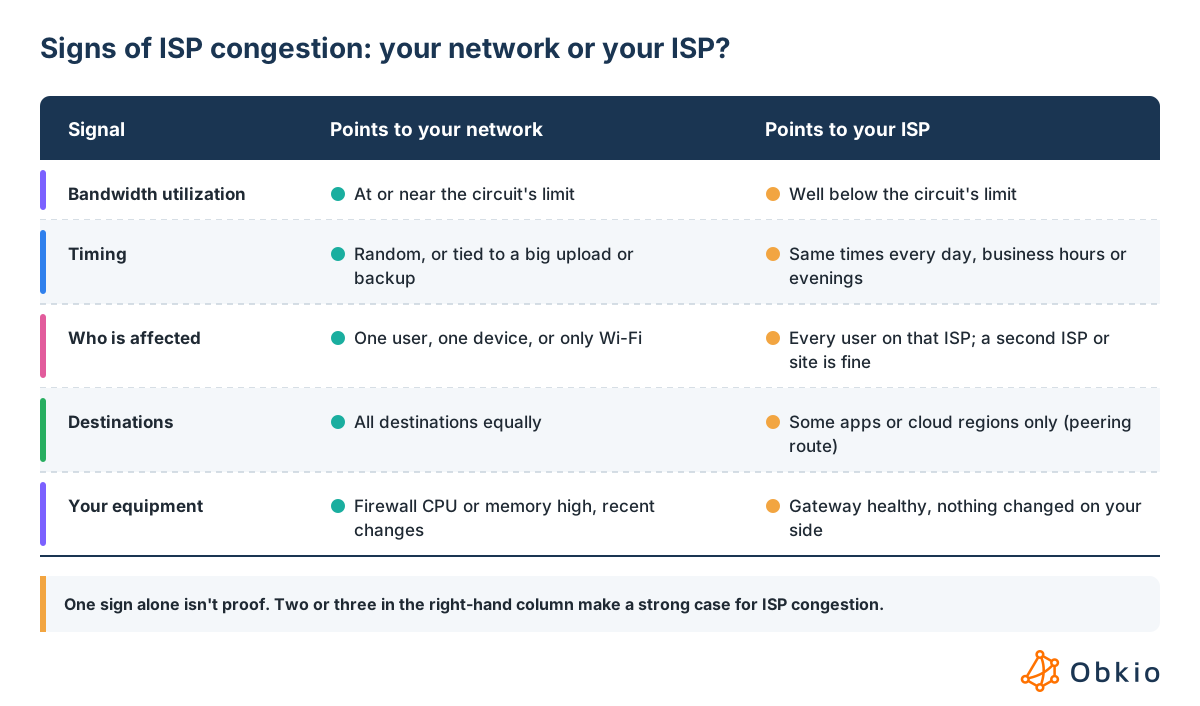
One of these alone isn't proof. Two or three together make a strong case that the problem sits inside your provider's network, and they tell you what to measure next.
How to Identify ISP Congestion: Step-by-Step
The goal is to prove two things: the problem isn't on your side, and the degradation starts inside your Internet service provider's network. These five steps take you from a vague "the Internet is slow" to evidence your ISP can act on.
Step 1: Rule out your own network
Start with what you control. Check your Internet circuit's bandwidth utilization during the slowdown: if it's at or near the limit, the bottleneck is your own link, often made worse by bufferbloat when uploads fill the queue. Then check your firewall: high CPU or memory, or an IDS/IPS feature capping throughput, can look exactly like ISP congestion from the user's chair.
If utilization is low and your gateway is healthy, move on.
Step 2: Measure network performance continuously, not with a speed test
A speed test saturates your own link for a few seconds and reports throughput. It doesn't show you when quality degrades, where on the path it happens, or whether it follows a pattern, and running one during congestion adds load to the problem you're measuring.
What you need is continuous measurement of latency, jitter and packet loss from inside your network to targets on the Internet, running before, during and after the slowdowns.
Obkio is a network monitoring and diagnostics solution built for this kind of end-to-end view. You install Network Monitoring Agents at your sites, as software, hardware or virtual agents. They exchange synthetic traffic with public monitoring agents hosted outside your network, measuring latency, jitter and packet loss on the full path your users' traffic takes.
You get a continuous baseline of your connection's performance instead of a single snapshot, and you can see exactly when and how it degrades.

Step 3: Look for the time pattern
With a few days of data, compare performance across the day. ISP congestion typically shows a repeatable shape: latency, jitter and loss rise around the same hours (business hours or evenings) and fall back once demand drops.
Overlay your own bandwidth utilization on the same timeline. Degradation that climbs while your utilization stays flat is the clearest early sign the bottleneck sits upstream.
Step 4: Locate the ISP congestion with traceroutes
Traceroutes show where quality changes along the path. Run them during a degradation and compare them to a baseline from a quiet period. With ISP congestion, the pattern looks like this:
- Your gateway and the first ISP hop are clean
- Latency or loss appears at a hop inside the ISP's network
- It carries through every hop after it, all the way to the destination
That last point matters. Some routers deprioritize or rate-limit the ICMP replies traceroute relies on, so a single hop can show loss or high latency even when traffic passing through it is fine. If later hops look normal, that hop isn't the problem. Only degradation that persists to the destination counts (see why some routers drop packets or show high latency in traceroutes).
Running traceroutes by hand during an intermittent slowdown is a matter of luck. Obkio's Visual Traceroute runs them continuously from the same Network Monitoring Agents, so the traceroutes from the moment of degradation are already there when you go looking.

Step 5: Compare against a second path
Confirm the result against a path that doesn't go through the congested segment:
- A second ISP: if your backup or SD-WAN link stays clean during the same window, the problem is specific to your primary provider.
- Another site: a location on a different provider that reaches the same destination normally rules out the destination itself.
- Different destinations: if only some apps or cloud regions degrade, the congestion is likely on one peering or transit route rather than your ISP's access network.
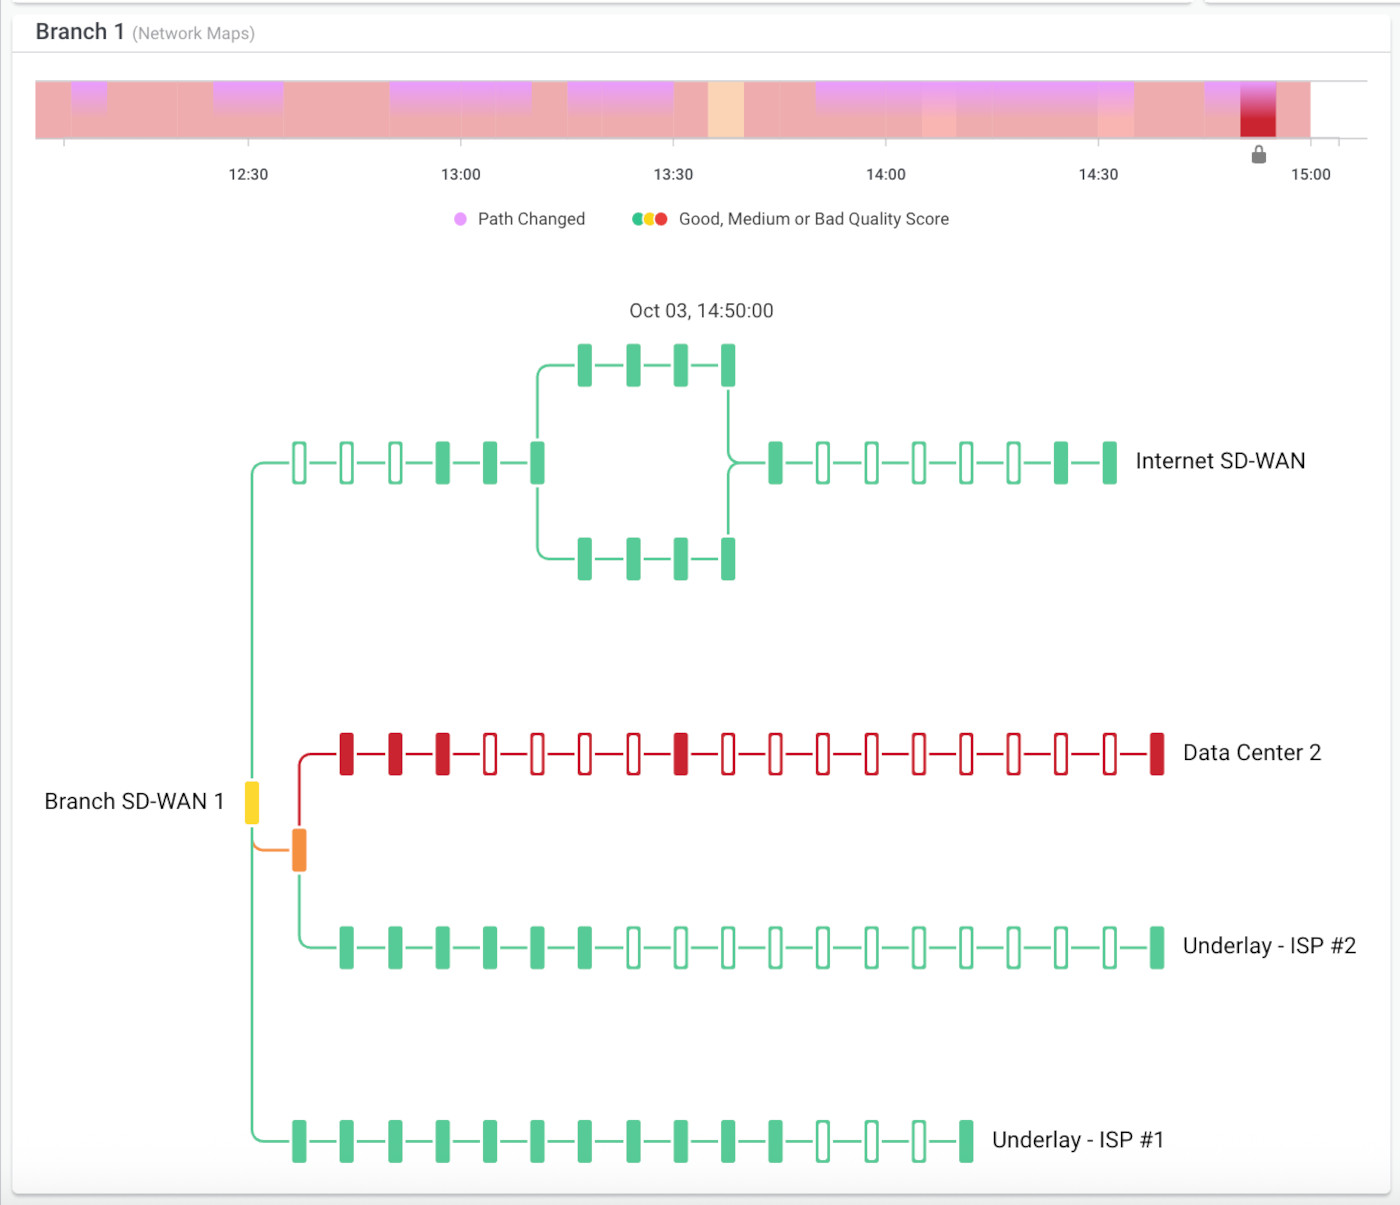
When all five steps point the same way, you have more than a suspicion: you have a timeline, a location on the path, and a control comparison. That's the evidence your ISP needs.
How Obkio Identifies ISP Congestion
The five steps above work, but doing them by hand means collecting data for days, lining up timelines, and reading traceroutes hop by hop every time users complain. Obkio does that analysis for you.
Obkio Insights names the issue
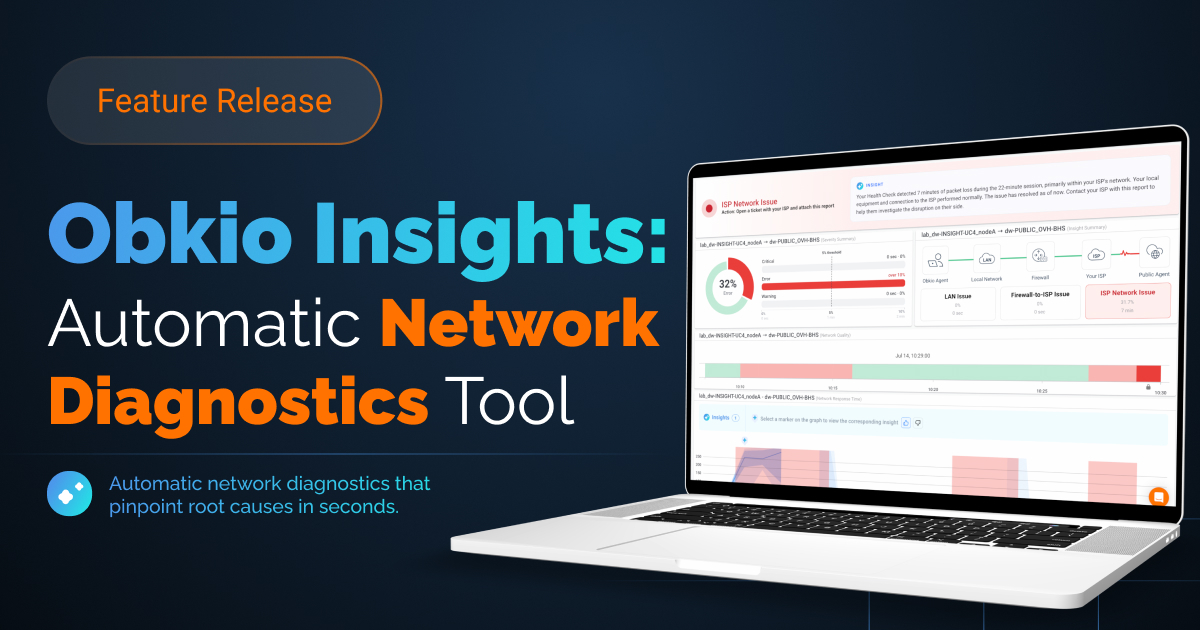
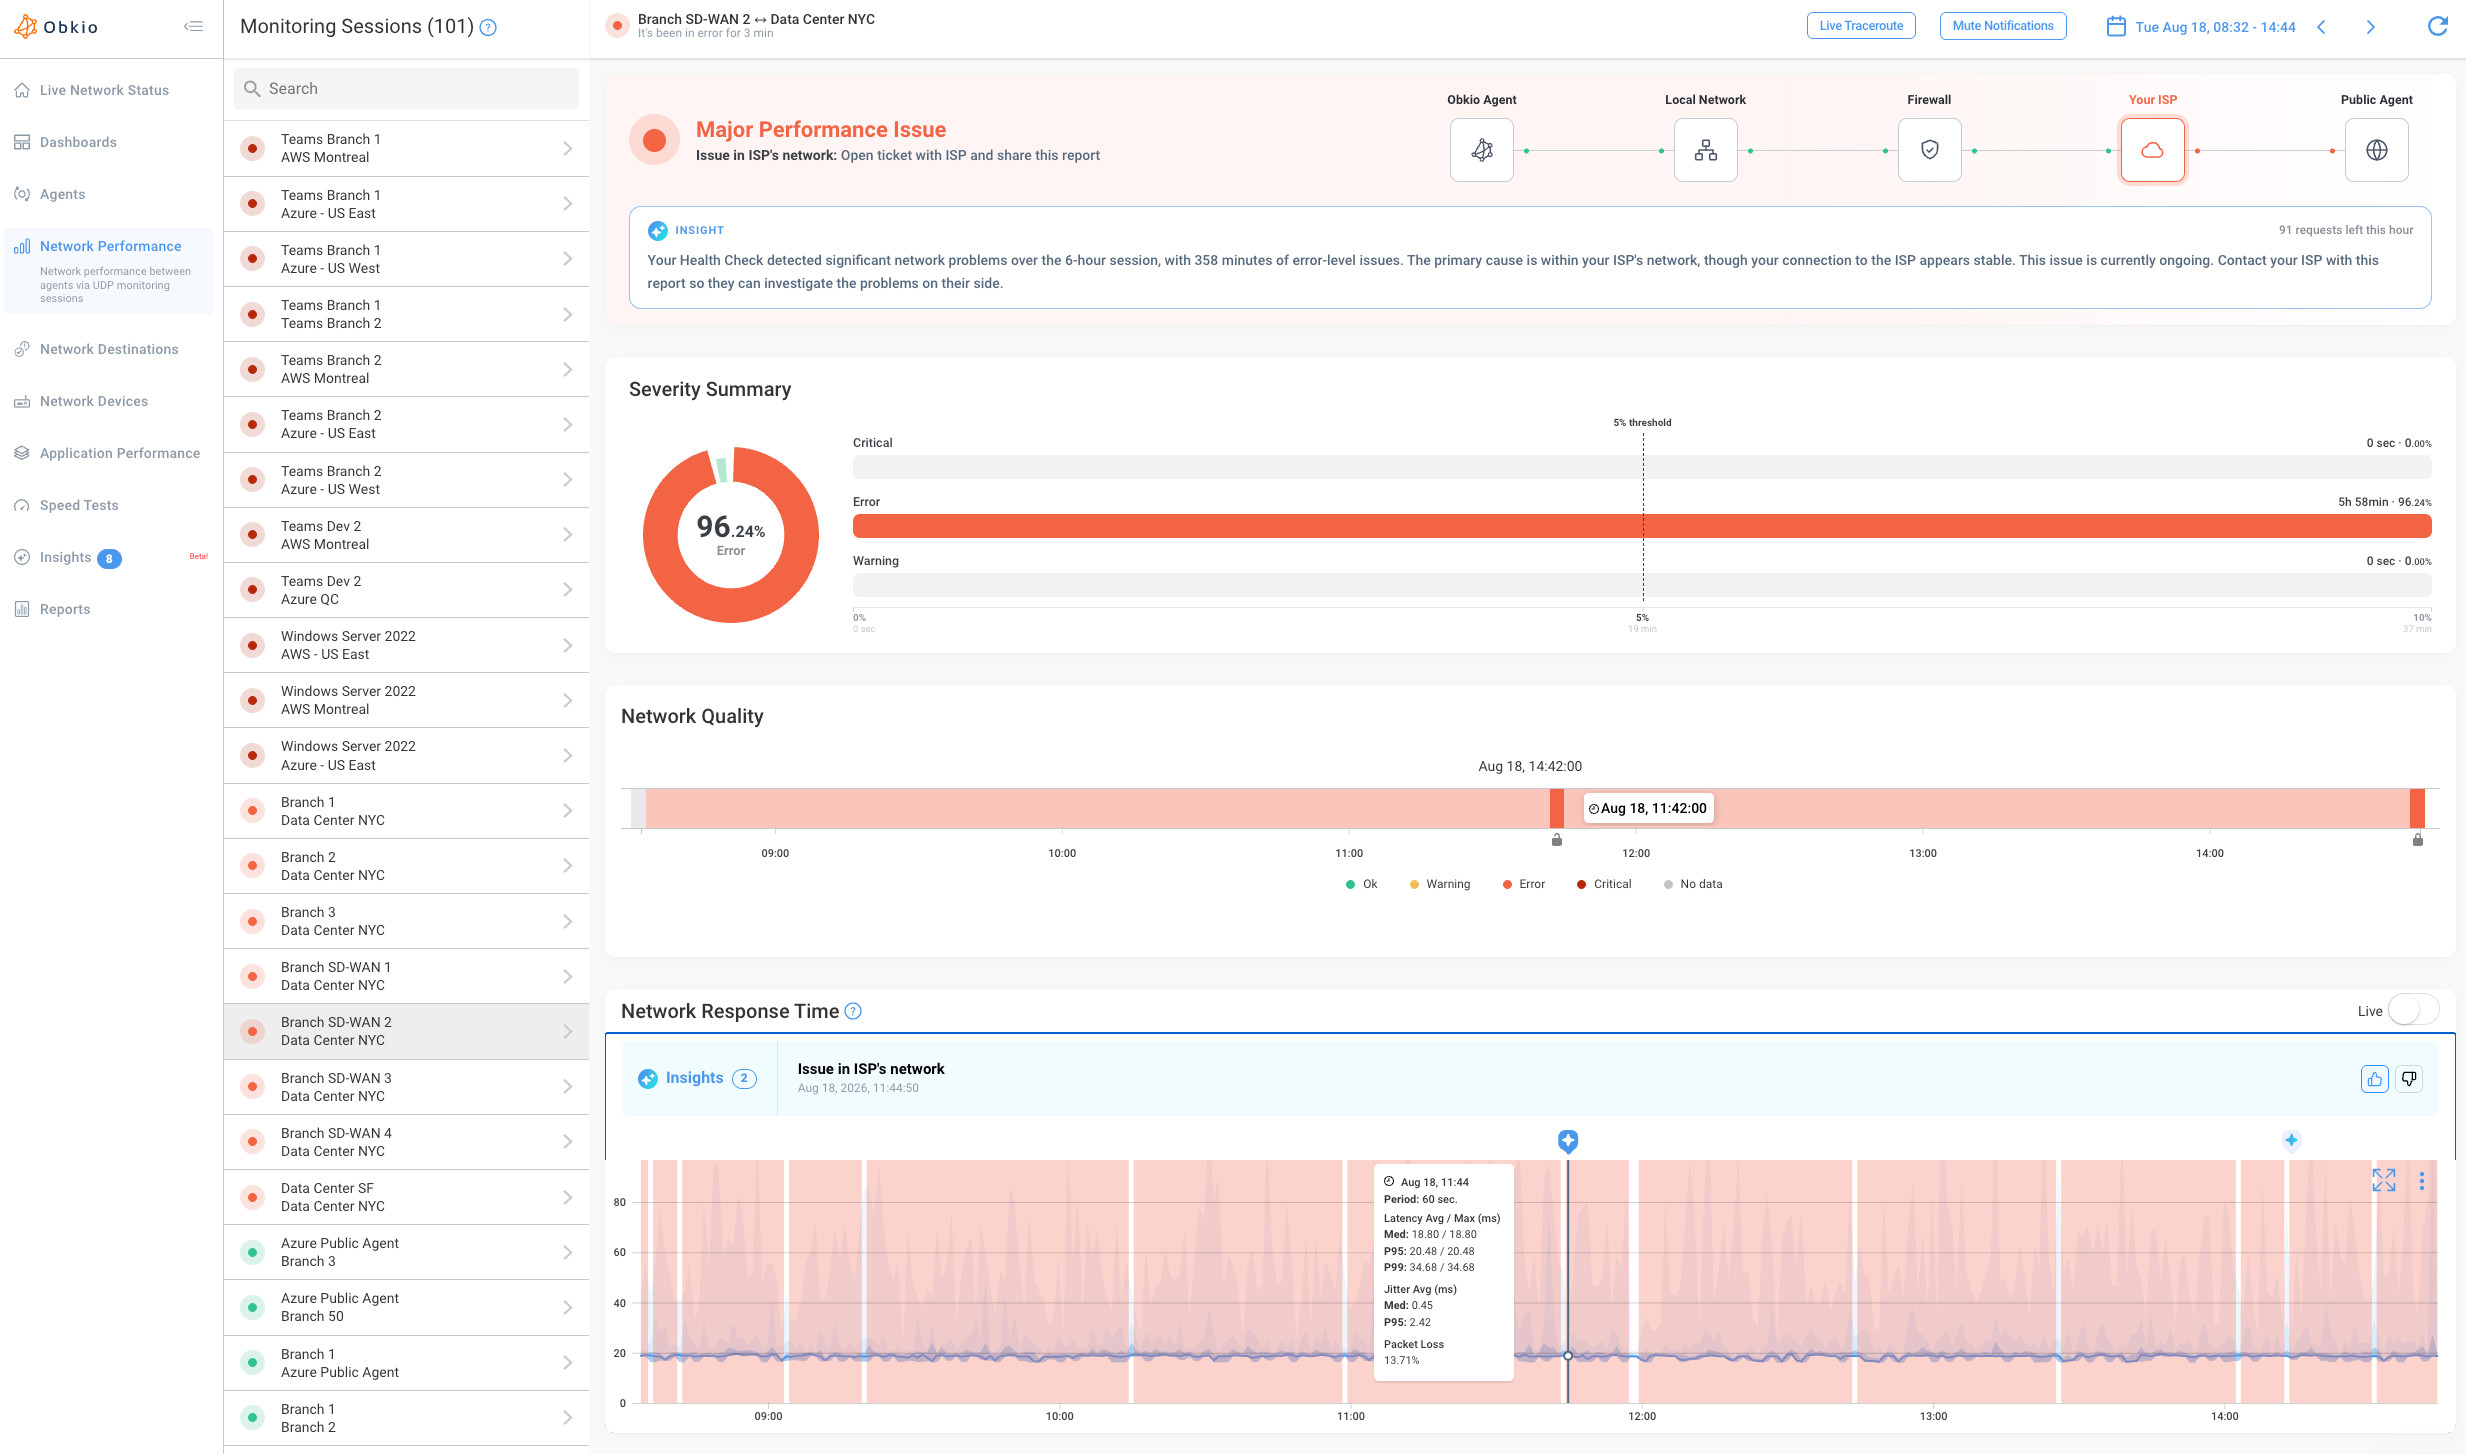
Obkio's automated diagnostics feature, Insights, analyzes the data from your monitoring sessions and traceroutes and tells you what's wrong and where. When the pattern matches ISP congestion, Insights reports it as “Issue in ISP Network”.
To reach that diagnosis, Insights checks the same things you would:
- Quality drops on the path to the Internet: latency, jitter or packet loss rise on the sessions between your agents and the public monitoring agents.
- Your side is clean: Insights confirms your local network and firewall were healthy during the degradation. If you also monitor your firewall or router over SNMP, it factors in CPU, memory and bandwidth usage to rule your own equipment in or out.
- The drop starts inside the ISP: the traceroutes show quality changing between two public IPs past your gateway, and staying degraded to the destination.
The Monitoring Session shows the full path from your agent to the public agent, with the segment where the problem was found highlighted, and how much of the degraded period Insights could attribute to the ISP.
Instead of a graph you have to interpret, you get a diagnosis with the session, timeframe and traceroutes that support it.
Share the proof with your ISP
A diagnosis only helps if your ISP accepts it. With Obkio's Shareable Links, you send your provider a link to the monitoring session where the issue happened. They don't need an Obkio account to open it. They see everything on the session page, including the traceroutes, and can adjust the time range to look at the data themselves. You set how long the link stays active.
That puts the same evidence in front of the ISP's support team that you used to reach your conclusion, which is usually what moves a ticket past "everything looks fine on our end".
Want to catch the next ISP slowdown as it happens? Start for free and deploy your first Network Monitoring Agents.
How to Get Your ISP to Fix ISP Congestion
Once the evidence points to your provider, the fix is on their side: add capacity on the congested segment, rebalance traffic, or fix a congested peering or transit route. Congestion is one of the easier ISP problems to prove, because it leaves a pattern, but only if your ticket shows that pattern.
Show the pattern, not a single episode:
A congested node degrades at the same hours every day. Send performance broken down by hour across several days, so the ISP can see degradation rising and falling with demand while your own bandwidth utilization stays flat. One bad afternoon can be explained away; a week of matching afternoons can't.
Point to where it starts:
Include the traceroute showing the hop inside their network where latency or packet loss begins and carries through to the destination. Name the hop and its IP address. If only certain destinations are affected, say so: that tells their team to look at a peering or transit route, not your access line.
Ask congestion-specific questions:
- Is the node or aggregation link serving our area over capacity at these hours?
- Is there a known peering or transit issue toward these destinations?
- When is the capacity upgrade or routing fix scheduled? Ask for a date, not "we're looking into it".
Keep monitoring after they say it's fixed:
Solutions for fixing ISP congestion usally only partially work. A reroute can move the problem rather than remove it. Check that performance holds at the hours it used to degrade, not just the next morning.
For the full process, including how to rule out your network, the email to send, and how to escalate past first-line support, see How to prove your ISP is the problem. The ISP escalation toolkit has a ready-made evidence paragraph for peak-hour slowdowns.
What to do while you wait
Capacity upgrades and routing fixes can take weeks. In the meantime, you can limit the impact on users:
- Prioritize real-time traffic: QoS rules on your firewall keep calls and video meetings ahead of bulk traffic. They can't fix congestion inside the ISP, but they make sure your own traffic doesn't add to the problem on your link.
- Fail over to a second link: If you have a backup ISP or an SD-WAN, steer critical traffic onto the clean path during peak hours.
- Move heavy transfers off-peak: Schedule backups, large syncs and updates outside the hours when congestion builds.
- Revisit your connection type: Shared, best-effort business plans are the most exposed to oversubscription. A dedicated circuit with an SLA gives you contractual performance targets and a stronger position the next time it happens.
Could It Be Something Else Besides ISP Congestion?
ISP congestion is easy to blame and hard to fix without the ISP, so it’s worth being sure before you open a ticket. Several other problems produce the same complaints: slow apps, choppy calls, connections that stall for a few seconds. Some sit on your own network, where you can fix them today. Others are still the ISP’s responsibility, but need a different conversation than “your network is congested”.
The difference shows up in the data, not in what users report. Here’s how each lookalike compares.
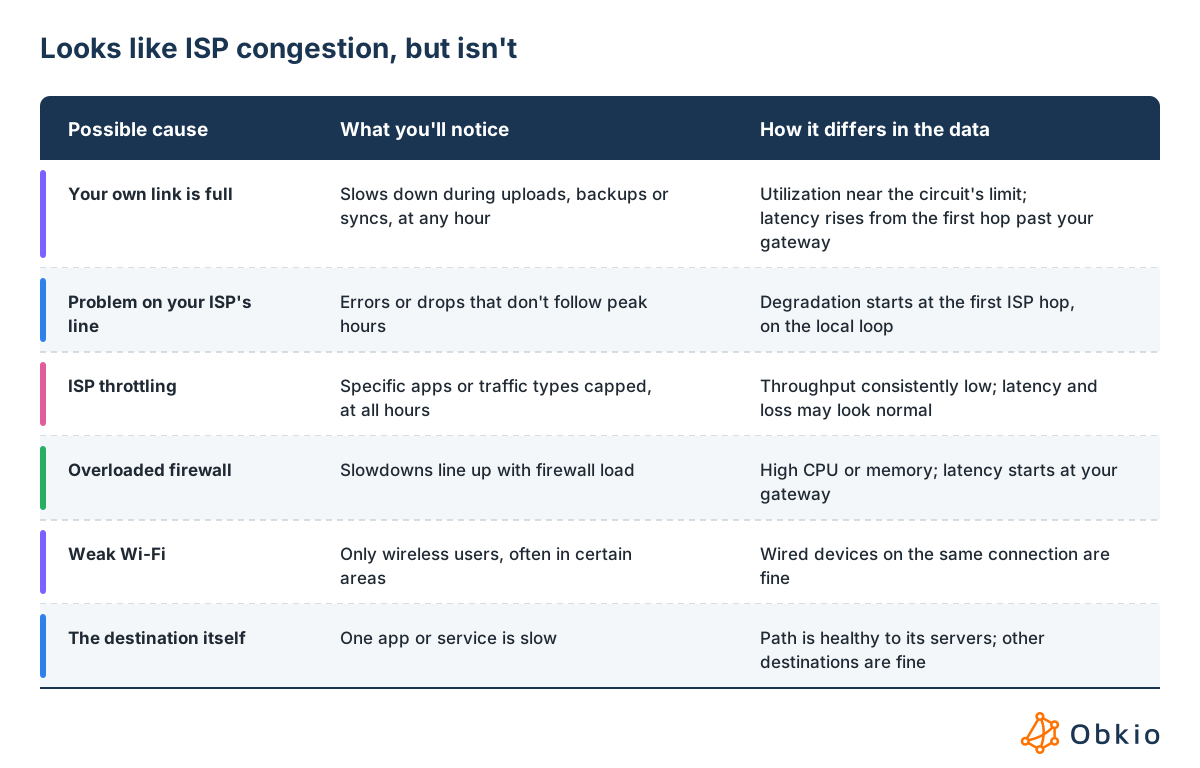
Your own link is full (bufferbloat)
- Slows down when someone uploads, backs up or syncs large files, at any hour
- Your bandwidth utilization is at or near the circuit's limit, and latency rises from the first hop past your gateway
A problem on your ISP's line
- Still the ISP's problem, but on the local loop between your site and their first equipment, not deeper in their network
- Degradation appears at the first ISP hop, often with errors or drops that don't follow peak hours, and can get worse with weather or line conditions
- Look at: ISP local loop issues
ISP throttling
- Speeds are capped for specific traffic types or once you pass a usage threshold, rather than degrading with demand
- Throughput stays consistently low for certain apps or at all hours, while latency and loss may look normal
- Look at: ISP throttling
An overloaded firewall
- High CPU or memory, often from IDS/IPS under heavy traffic, adds latency and drops packets before traffic leaves your network
- Degradation lines up with firewall load rather than the ISP's peak hours, and traceroutes show latency starting at your gateway
Weak Wi-Fi
- Only wireless users are affected, often in specific areas of the office
- Wired devices on the same connection perform normally
- Look at: Wi-Fi monitoring
The destination itself
- One app or service is slow, but the path to it is healthy all the way to its servers
- Other destinations reached through the same ISP and the same routes work normally
- Look at: the app vendor's status page, and send them a Shareable Link showing your network was healthy
If none of these fit, and your data shows degradation that follows peak hours, starts inside your ISP’s network and leaves your own circuit underused, you’re looking at ISP congestion. If one does fit, you’ve just saved yourself a ticket your ISP would have closed anyway, and you know where to look next.

Is your ISP throttling your Internet? Learn how to tell ISP throttling from congestion, test it step by step, prove it to your ISP with data & stop it.
Learn more
Frequently Asked Questions About ISP Congestion
Is my ISP throttling me, or is it congestion?
Throttling is deliberate: your ISP caps speeds for certain traffic types, or once you pass a usage threshold, so throughput stays low regardless of the time of day. Congestion is a capacity problem: latency, jitter and packet loss rise when the shared network is busy and recover when demand drops. If the slowdown follows peak hours, it's more likely congestion. See ISP throttling for how to test for it.
Does ISP congestion only happen at night?
No. Congestion happens whenever demand on a shared segment exceeds its capacity. On residential and mixed nodes, that's usually evenings. On business-heavy nodes, it's often business hours. Backbone and peering congestion can appear at any time, especially after an outage or routing change pushes traffic onto a smaller path. The tell is a repeatable pattern, whatever the hour.
Can a speed test detect ISP congestion?
Not reliably. A speed test measures throughput for a few seconds, usually to a server inside your ISP's own network, so it can miss congestion at peering points or further along the path. It also won't catch degradation that comes and goes. Continuous monitoring of latency, jitter and packet loss, combined with traceroutes, shows when congestion happens and where it starts.
Will upgrading my Internet plan fix ISP congestion?
Usually not. A faster plan raises the cap on your own circuit, but ISP congestion sits on shared capacity inside the provider's network, which every customer on that segment still competes for. An upgrade helps only if your own link was the bottleneck. A dedicated circuit with an SLA, or a second ISP for failover, does more to reduce exposure to congestion.
How do I prove packet loss to my ISP?
Show continuous measurements of packet loss with exact timestamps and duration, a traceroute where the loss starts at a hop inside the ISP's network and carries through to the destination, and evidence that your own network is healthy. A Shareable Link lets the ISP review the data themselves. See How to prove your ISP is the problem for the full process.
Does fibre get congested?
Yes, though less often at the access level. Fibre access networks are usually shared between many customers, so a heavily subscribed segment can still congest. And regardless of access technology, your traffic crosses the ISP's backbone and peering links, where congestion affects fibre customers as much as anyone else. A fibre connection with ISP congestion shows the same peak-hour pattern.
Catch ISP Congestion Before Your Users Do
ISP congestion is frustrating because it sits outside your control. Your network is healthy, your circuit has room to spare, and users still can't work. But it isn't random. It follows the provider's peak hours, starts at a specific point inside their network, and leaves a pattern in the data. That pattern is what turns "the Internet is slow" into a ticket your ISP has to act on.
The hard part is having that data when you need it. ISP congestion comes and goes, and by the time someone complains, the evidence is usually gone. The strongest cases start before the problem does, with monitoring that's already running.

With a network monitoring and diagnostics solution like Obkio, Network Monitoring Agents measure performance from your sites out past your ISP around the clock. Insights tells you when the problem is in your ISP's network, and a Shareable Link puts the evidence in front of your provider. For MSPs, the same link shows your client that the slowdown is the ISP's, not yours.
Have the proof ready the next time your ISP's network slows down.