








 Obkio Blog


 Subscribe
Table of Contents
Table of Contents
Your Internet link averages 40% utilization, yet users still complain that calls drop and SaaS apps crawl every morning at 9:00.
Averages are where bandwidth problems hide. A five-minute polling interval can smooth a 30-second saturation spike into a flat, healthy-looking line. A total-usage graph also won't tell you whether the traffic is a backup job, a compromised endpoint, or an ISP delivering less than you're paying for.
Monitoring bandwidth usage means measuring how much traffic crosses each interface and link over time, then comparing it against available capacity. With the right data, it shows you when your network is saturated, where the bottleneck sits, and what's consuming it.
This article covers how bandwidth usage is measured, the main monitoring techniques and the tools that support them, the most common bandwidth issues, and a step-by-step process for troubleshooting them.
What Is Bandwidth Usage? 
Bandwidth usage is the amount of data transmitted across a network link or interface over a given period, measured in bits per second (bps) or as a percentage of the link's total capacity, known as bandwidth utilization. Sustained bandwidth usage near capacity signals congestion, while unexpected spikes often point to specific applications, devices, or users.
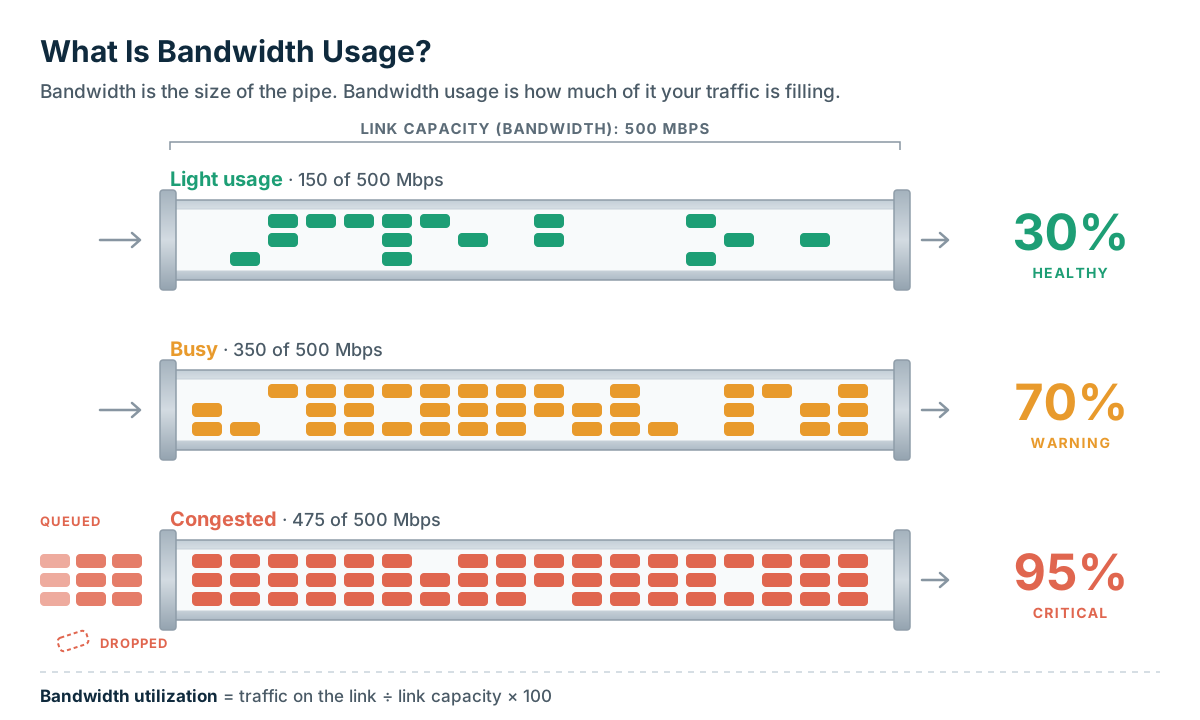
The term is used in two ways. In ISP billing and data-cap contexts, bandwidth usage usually means total data transferred, such as 2 TB per month. In network monitoring, bandwidth usage means the rate of traffic on a link at a given moment. A link can move very little data over a month and still saturate for ten minutes every morning. This guide uses the monitoring sense: rate over time
What Is Bandwidth Usage Monitoring?
Bandwidth usage monitoring is the continuous measurement of how much data traverses a network link, interface, or device over time, expressed in bits per second or as a percentage of total capacity. It helps IT teams detect congestion, identify which users and applications consume the most bandwidth, and plan capacity before performance degrades.
A speed test answers "how fast can this link go right now?" Bandwidth usage monitoring answers "how much of this link is being consumed, by what, and when?" The first is a snapshot of capacity. The second is a time series you can trend, alert on, and correlate with performance problems.
Bandwidth vs. Throughput vs. Bandwidth Usage
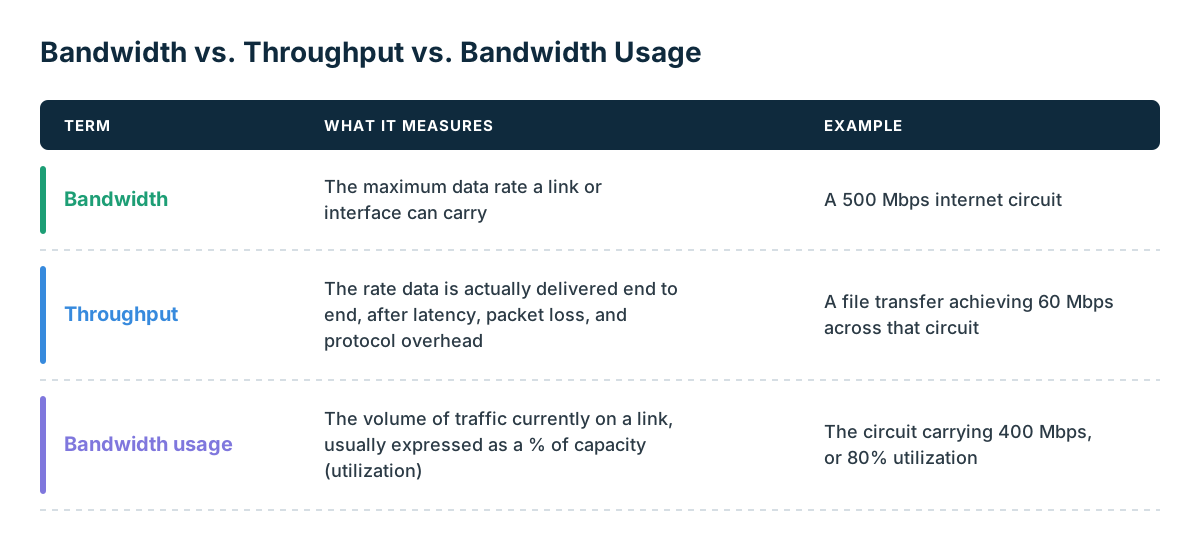
These three terms are often used interchangeably, but they measure different things:
A link can show low utilization and still deliver poor throughput if latency or packet loss is high. For a deeper breakdown of how throughput is measured and what affects it, see our guide to network throughput.
Why Should You Monitor Bandwidth Usage?
- Catch congestion before users report it: Sustained high bandwidth utilization is an early indicator of latency, jitter, and packet loss, especially for real-time traffic like VoIP and video.
- Attribute consumption: Bandwidth usage data shows which hosts, applications, or sites are driving load, so you can separate legitimate business traffic from backups running at the wrong time or unsanctioned apps.
- Verify ISP delivery: Comparing observed traffic against contracted capacity reveals ISP throttling, oversubscription, or circuits that never reach their rated speed.
- Plan capacity with evidence: Trend data allows businesses to make upgrade decisions based on real data instead of guessing, and shows whether a link needs more bandwidth or just better traffic management.
- Spot anomalies: Unexpected outbound spikes or traffic at unusual hours can point to malware, data exfiltration, or misconfigured devices.
How Is Bandwidth Usage Measured?
Bandwidth usage is measured by counting the bits that cross an interface over a fixed interval and dividing by the interval's length. Most tools do this by polling interface counters on routers, switches, and firewalls, then expressing the result as a rate (Mbps) and as a percentage of the interface's capacity.
How to Calculate Bandwidth Utilization
Bandwidth utilization is the percentage of a link's capacity in use over a measurement interval:
Bandwidth utilization (%) = (traffic in bits per second ÷ link capacity in bits per second) × 100
When the data comes from SNMP interface counters, which report octets (bytes), the calculation becomes:
Utilization (%) = (Δ octets × 8) ÷ (Δ seconds × interface speed) × 100
For example, if a 1 Gbps interface's inbound counter increases by 18.75 billion octets over a 300-second polling interval, the result is 150 billion bits ÷ 300 seconds, or 500 Mbps. That is 50% inbound utilization.
Calculate inbound and outbound separately on full-duplex links. Each direction has its own capacity, and a link can be saturated in one direction while the other sits nearly idle.
The polling interval shapes what you see. A 300-second average will flatten a 20-second burst to 100% into an unremarkable number. Shorter intervals of 60 seconds or less catch microbursts, but they generate more data to store.

How to measure bandwidth, identify issues & optimize network performance. Use Obkio's Network Performance Monitoring tool for easy bandwidth monitoring.
Learn more

What Are Key Bandwidth Usage Metrics?
- Utilization percentage: The core metric, and the one most alerts are built on. Track it per interface and per direction.
- Inbound vs. outbound traffic: Separating directions tells you what kind of problem you have. Inbound saturation often points to downloads, updates, or streaming. Outbound saturation points to backups, cloud sync, video conferencing from many users, or unexpected data leaving the network.
- Peak vs. average usage: Averages describe trends. Peaks describe user experience. A link averaging 35% that peaks at 98% every morning has a congestion problem the average won't show.
- 95th percentile: Samples over a billing period are sorted, and the top 5% are discarded. The highest remaining value becomes the billable rate. Over a 30-day month of 5-minute samples, that excludes about 36 hours of peak traffic. Many transit and burstable circuits are billed this way, and it's also a useful capacity-planning baseline because it ignores rare spikes.
- Top talkers and applications: Interface counters show how much traffic there is. Flow data (NetFlow, sFlow, IPFIX) shows who and what is generating it, broken down by host, conversation, port, and application.
- Interface discards and errors: Rising output discards on an interface are direct evidence that it is dropping packets because its queues are full. Discards confirm that high utilization is causing loss rather than just coinciding with it.
 Screenshot from Obkio
What Is Normal Bandwidth Utilization?
Normal bandwidth utilization is generally below 70% of link capacity, sustained over a measurement interval. Between 70% and 85%, latency and jitter start to rise as queues build. Above 85% sustained, most links experience congestion, packet loss, and degraded performance for real-time applications.
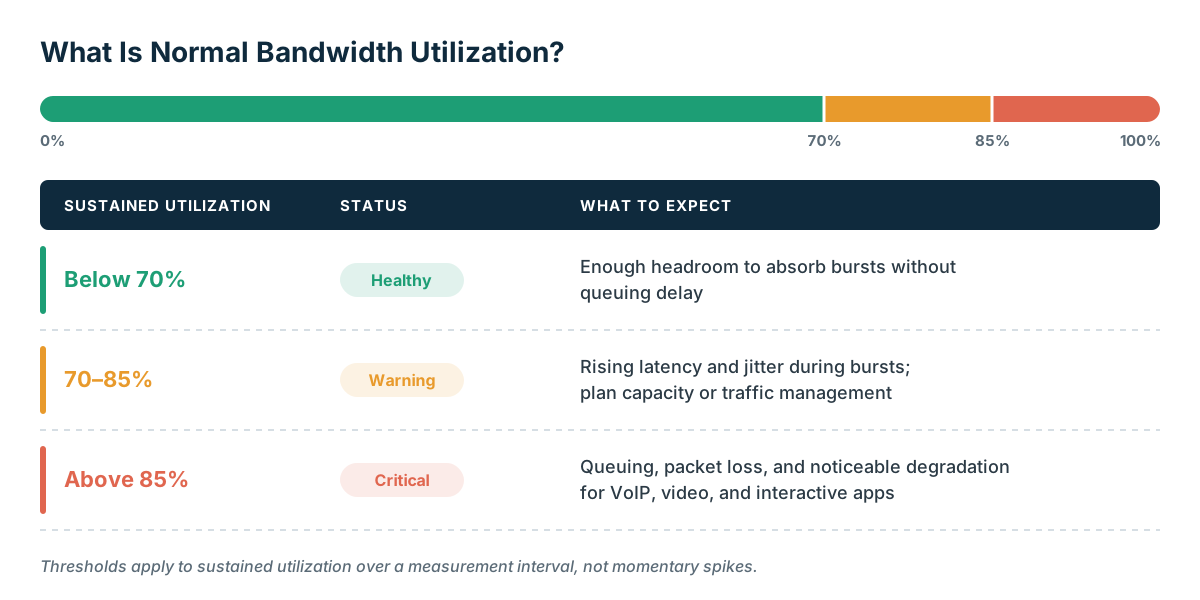
These thresholds apply to sustained utilization, not momentary spikes. Brief bursts to 100% are normal on busy links. Links that carry VoIP or video may need tighter thresholds, since real-time traffic degrades before bulk transfers do.
Monitor Bandwidth Usage with Obkio
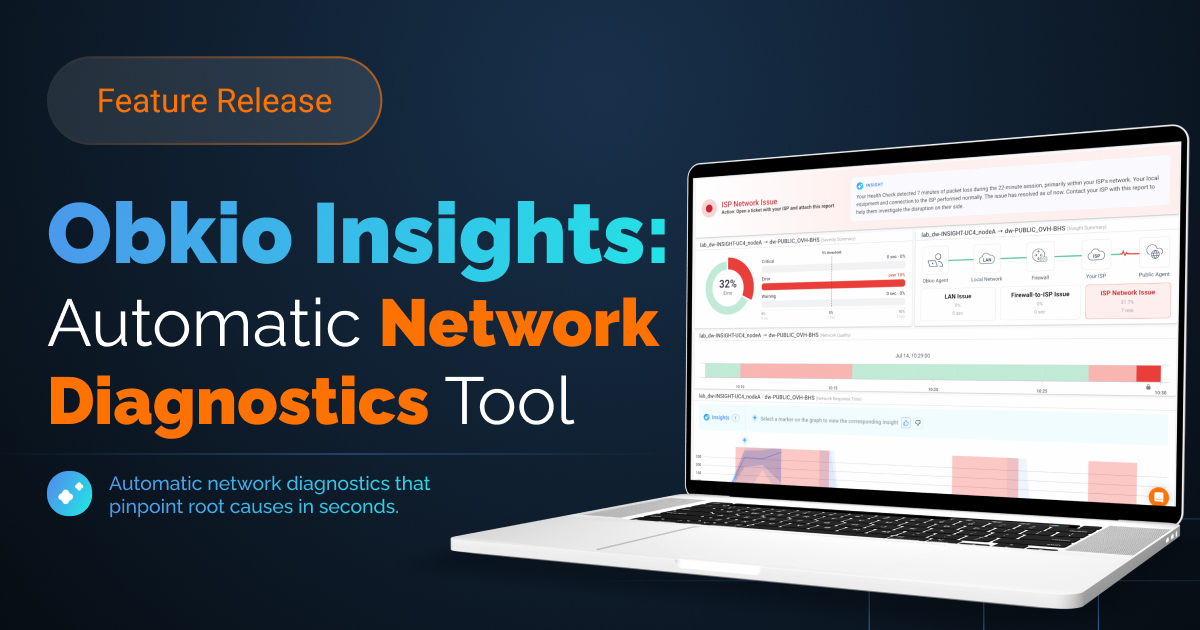
Obkio gives you end-to-end visibility into bandwidth usage across your network. SNMP-based Device Monitoring tracks interface utilization on your routers, switches, and firewalls. Network Monitoring Agents deployed at key locations measure performance between sites, the cloud, and your ISP. When usage spikes or performance degrades, Obkio Insight automatically analyzes the data to pinpoint where the issue is and what's likely causing it.

How to Monitor Bandwidth Usage: 6 Techniques
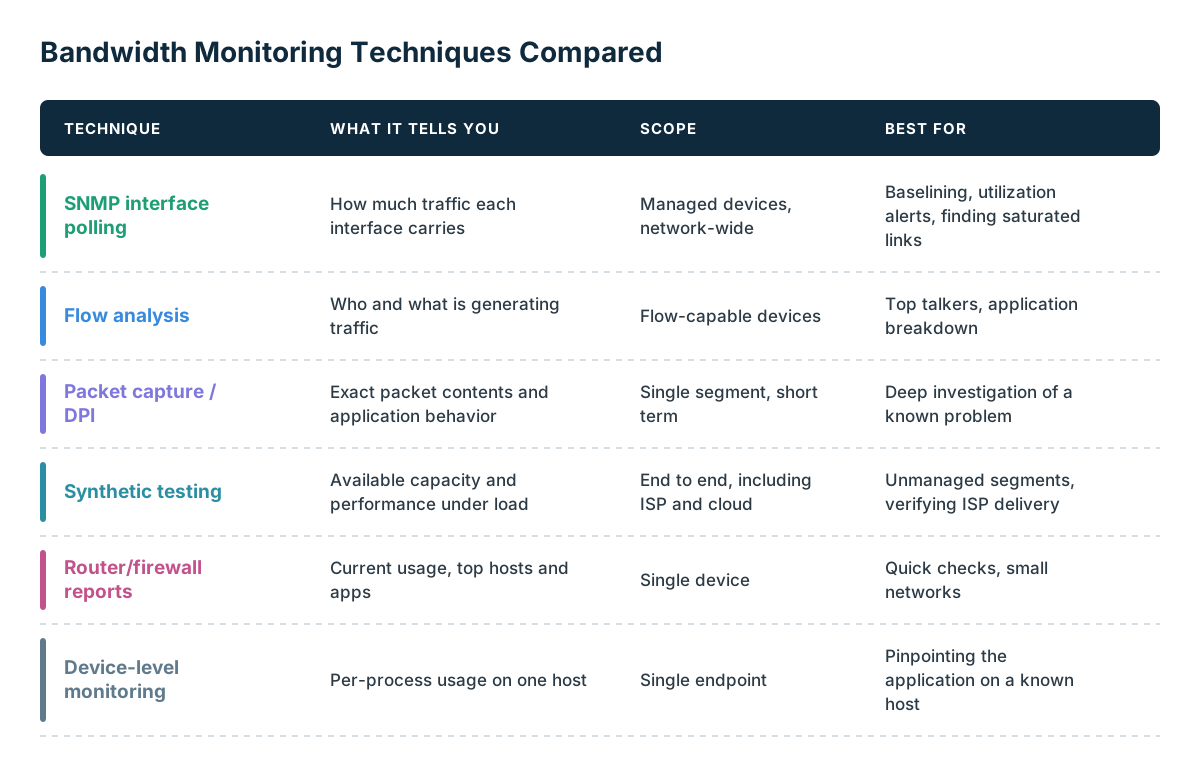
There are six main techniques used for monitoring bandwidth usage. Each one answers a different question. SNMP tells you how much traffic a link carries, flow data tells you who and what is generating it, and packet capture tells you exactly what's inside it. Most networks combine two or three techniques to get full visibility and to be able to troubleshoot bandwidth usage alongside monitoring.
1. SNMP Interface Polling
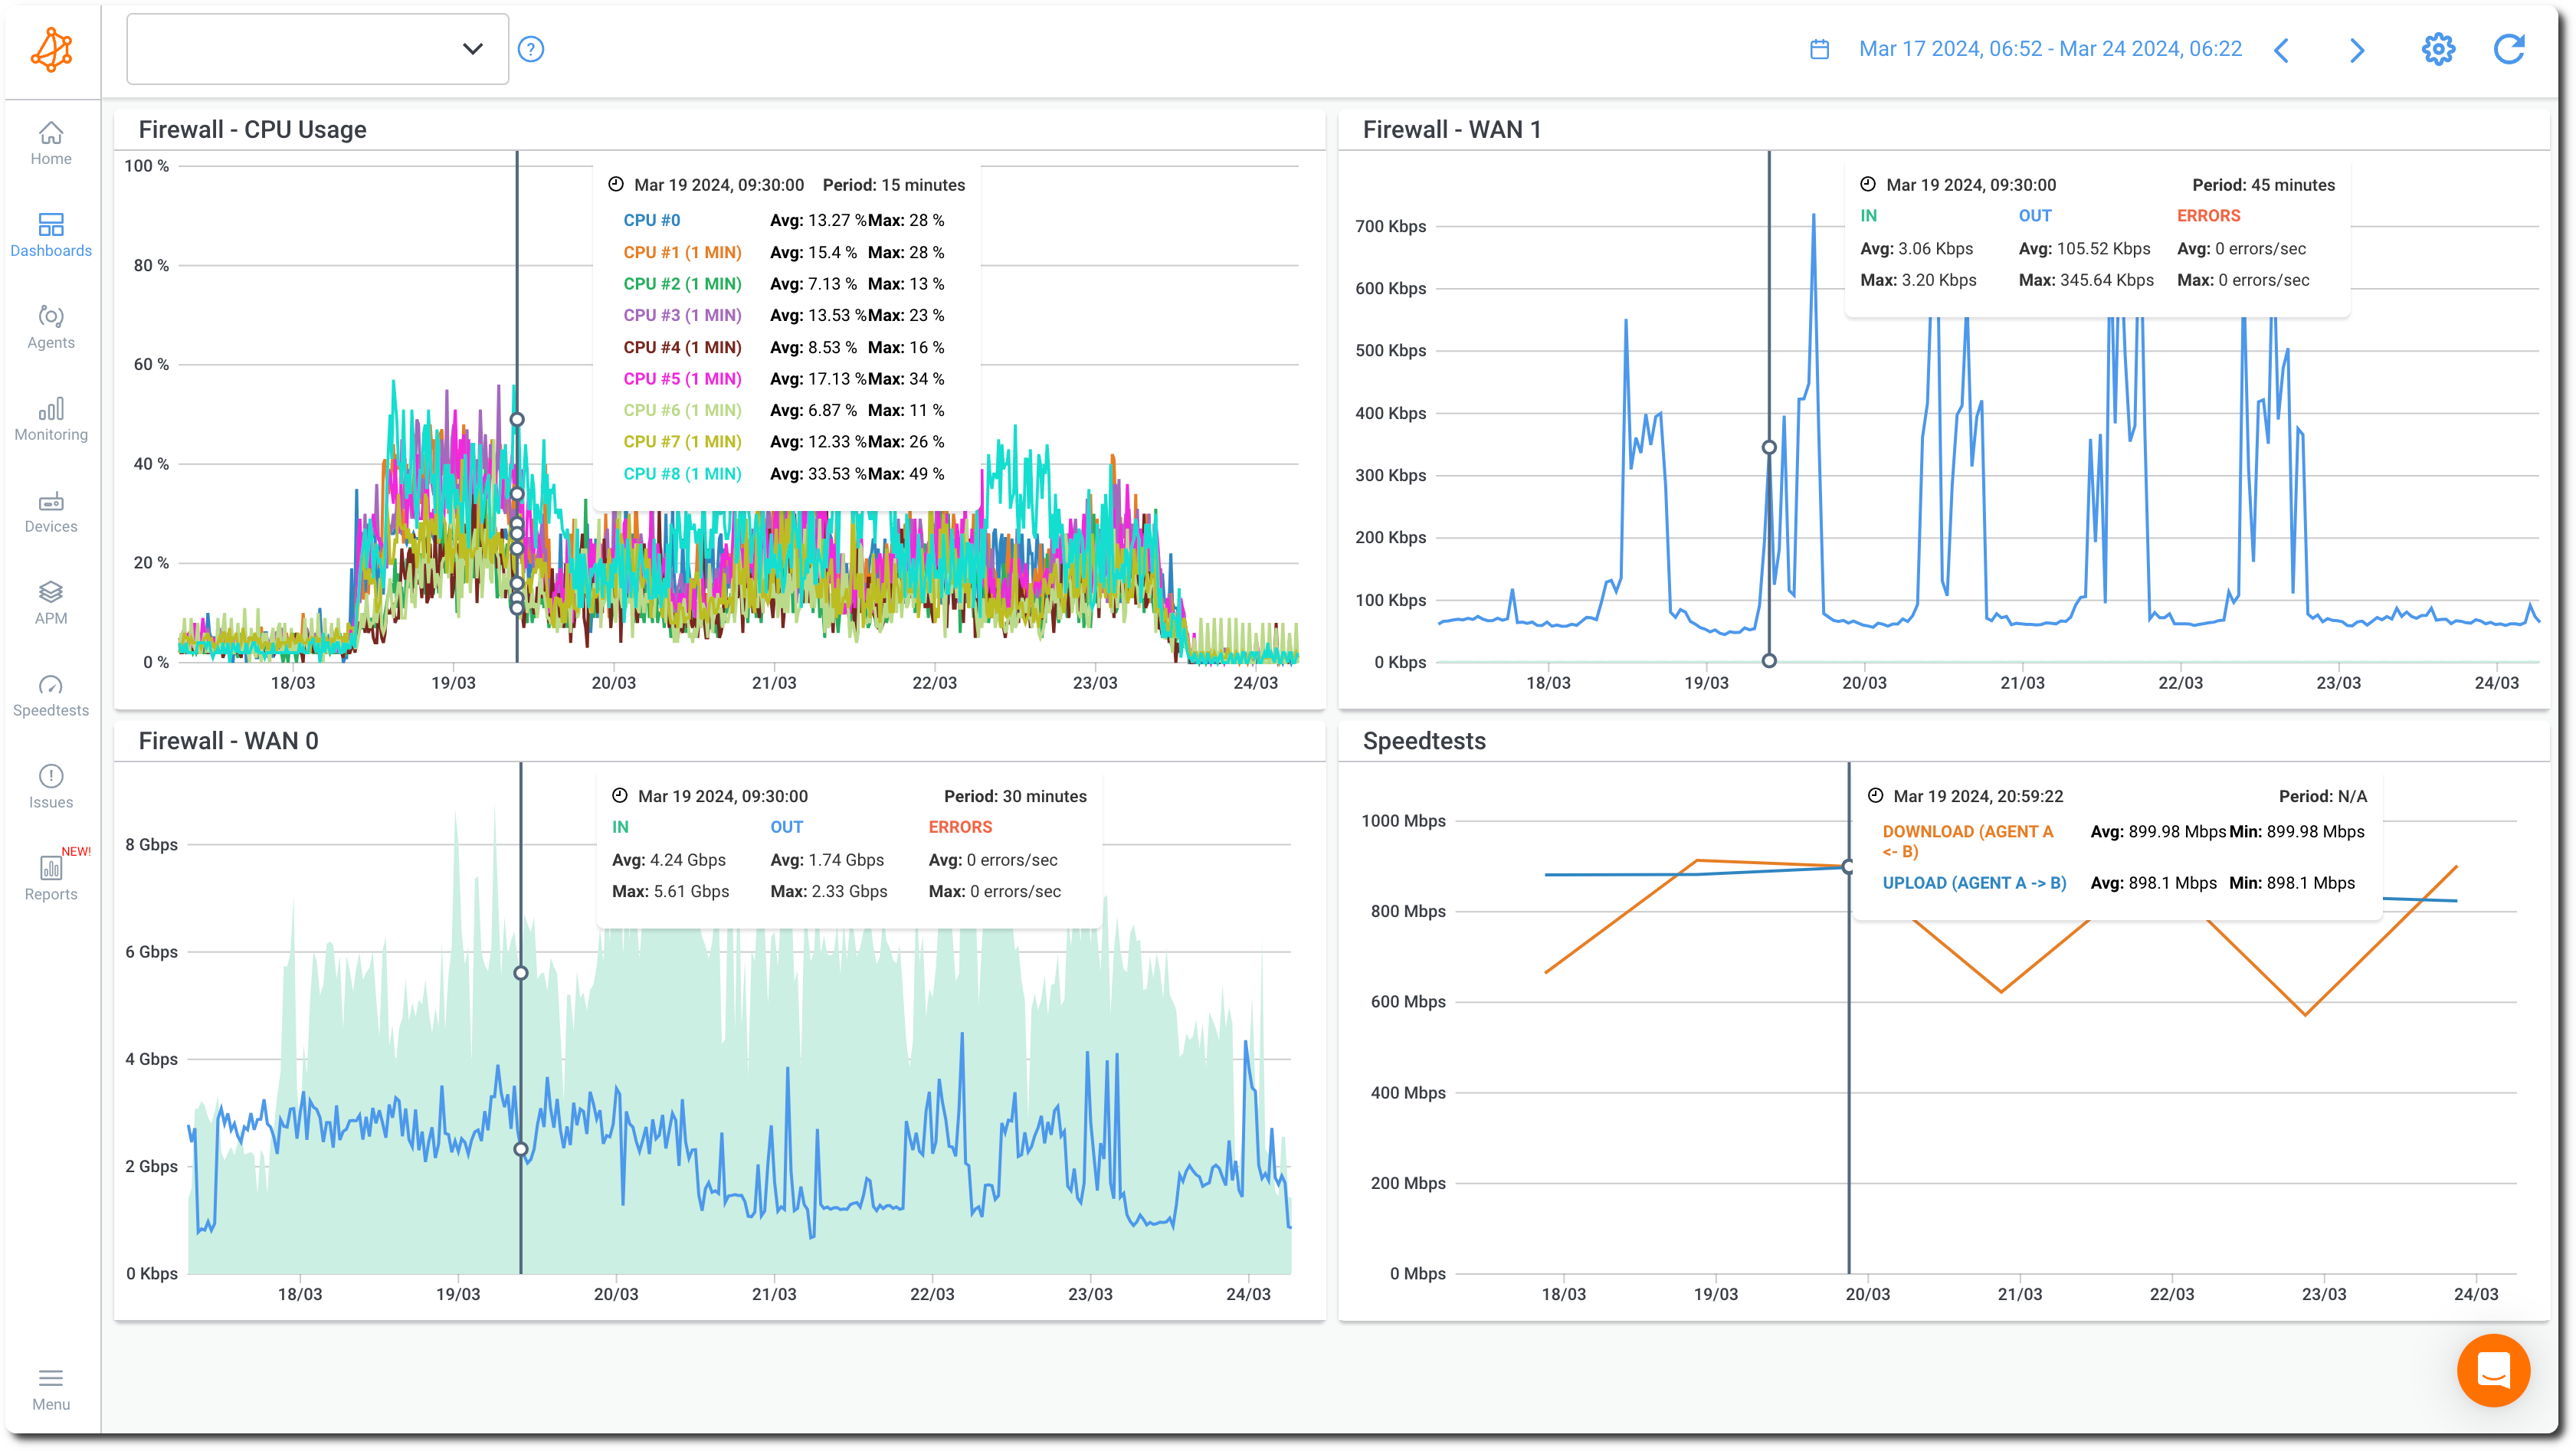
SNMP polling reads traffic counters from routers, switches, firewalls, and other managed devices at a fixed interval, then calculates utilization from the change between polls. It's the standard method for tracking utilization per interface and per direction across the whole network.
Use the 64-bit counters (ifHCInOctets and ifHCOutOctets) on any link faster than 100 Mbps. The older 32-bit counters can wrap more than once within a 5-minute poll on a busy gigabit interface, which produces false readings.
 Screenshot from Obkio
SNMP shows how much traffic crosses an interface, but not what that traffic is. It's the right starting point for baselining, alerting on utilization thresholds, and spotting which link is saturated.
2. Flow Analysis (NetFlow, sFlow, IPFIX)
Flow analysis has routers and switches export summaries of traffic conversations to a collector. Each record includes the source and destination IPs, ports, protocol, and byte and packet counts. This is how you identify top talkers, top applications, and the conversations behind a utilization spike.
NetFlow and IPFIX track flows on the device, while sFlow samples packets at a set rate. Sampling reduces load on the device but costs precision on low-volume flows. Flow data doesn't include payloads, so it identifies applications by port and protocol unless the exporting device adds application-layer classification.
3. Packet Capture and Deep Packet Inspection
Packet capture records the traffic itself, using tools like Wireshark or tcpdump on a SPAN port, network TAP, or directly on a host. Deep packet inspection goes further and classifies traffic by application based on its contents rather than by port.
It's the most detailed technique and the least scalable. Full captures consume storage quickly and are usually limited to a single segment for a short window. Use packet capture to investigate a specific problem that SNMP or flow data has already narrowed down, not for continuous monitoring.
4. Synthetic Testing and Scheduled Speed Tests
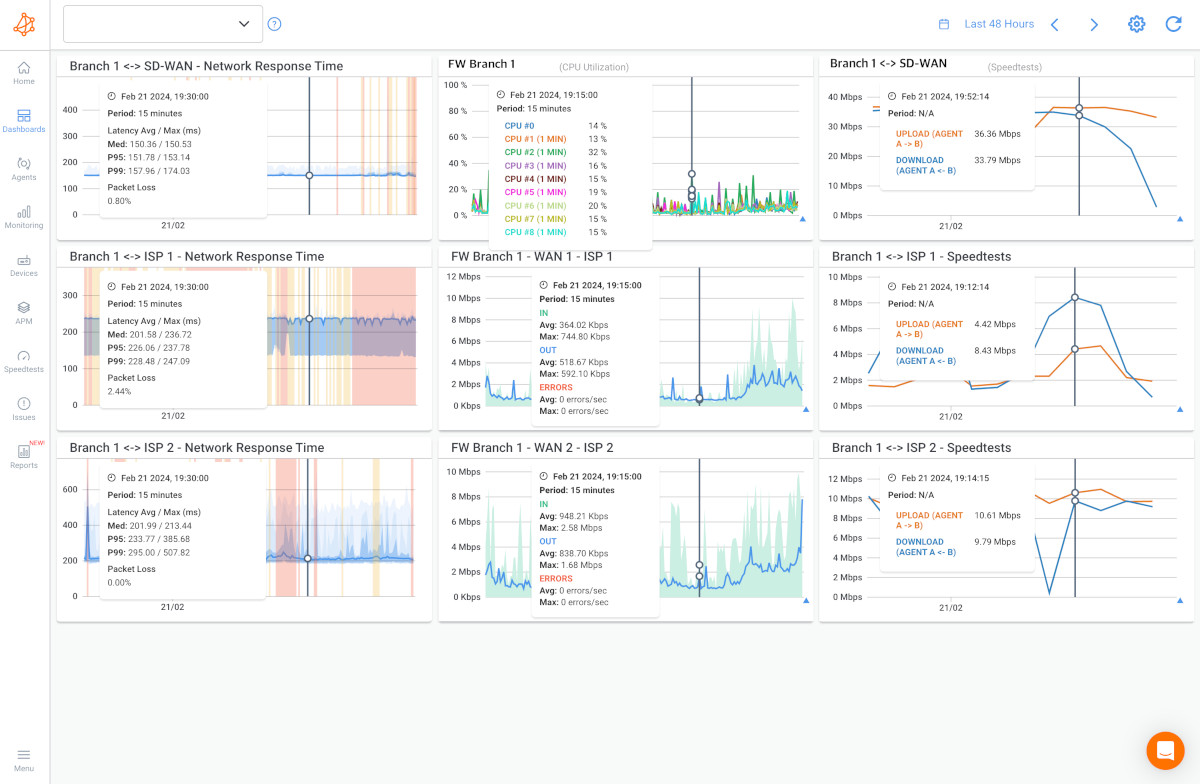
Synthetic testing sends controlled test traffic between points on the network and measures the results. Scheduled speed tests show how much capacity is actually available at different times of day. Continuous synthetic traffic measures latency, jitter, and packet loss, which rise as links approach saturation.
 Screenshot from Obkio
This is the only technique that works on network segments you don't manage, such as the ISP, the internet path to a SaaS provider, or a cloud region. A speed test that reaches 480 Mbps at 6:00 a.m. but only 120 Mbps at 10:00 a.m. on the same 500 Mbps circuit points to heavy usage or upstream congestion during business hours.
Speed tests consume bandwidth themselves, so schedule them sparingly and outside critical windows.
5. Router and Firewall Traffic Reports
Most business routers and next-generation firewalls include built-in dashboards that show interface usage, top hosts, and, on firewalls with application identification, top applications. They require no additional infrastructure and are often the fastest way to answer "what's using the Internet link right now?"
The trade-offs are short data retention, per-vendor interfaces, and no correlation across devices. These reports work well for single-site networks and quick checks, but they don't give you a network-wide view.
6. Device-Level Monitoring
Operating system tools show bandwidth usage on a single endpoint or server. On Windows, that means Resource Monitor; on macOS, Activity Monitor; and on Linux, tools like iftop, nload, and nethogs. Several of these break usage down per process, which network-level tools can't do.
Device-level monitoring is useful once you've traced a spike to a specific host and need to find the application responsible. It doesn't scale beyond individual machines.
Bandwidth Monitoring Techniques Compared
Best Bandwidth Monitoring Tools
The best bandwidth monitoring tool depends on the question you need answered. SNMP-based tools track utilization per interface, flow analyzers attribute traffic to hosts and applications, and synthetic monitoring tools measure performance across segments you don't control. Most IT teams use a combination, or a single platform that covers more than one technique.
Obkio
Obkio is a network performance monitoring solution that combines SNMP device monitoring with end-to-end synthetic monitoring. You get bandwidth usage and its impact on performance on the same timeline.
Device Monitoring polls routers, switches, and firewalls over SNMP to track interface utilization, inbound and outbound traffic, and device health metrics like CPU and memory.
Network Performance Monitoring uses Monitoring Agents deployed at key locations to exchange synthetic traffic continuously. They measure latency, jitter, and packet loss between offices, data centers, cloud regions, and the Internet. Scheduled speed tests compare actual throughput against the bandwidth you've configured for each connection.

Because both data sets live in the same dashboard, you can see whether a utilization spike on the firewall's WAN interface lines up with packet loss between sites. That tells you whether high usage is actually hurting performance or simply coinciding with it. Agents also cover the segments SNMP can't reach, including the ISP network and the path to cloud and SaaS providers.

Other Bandwidth Monitoring Tools
SNMP-based network monitoring systems such as PRTG, Zabbix, and LibreNMS poll interface counters across your devices. They alert on utilization thresholds and store historical graphs for baselining.
Flow analyzers such as SolarWinds NetFlow Traffic Analyzer and ntopng collect NetFlow, sFlow, or IPFIX data. They break traffic down by host, conversation, and application, which is the main way to identify top talkers at scale.
Packet analyzers such as Wireshark and tcpdump capture and decode traffic for detailed investigation. They're diagnostic tools rather than continuous monitors.
Built-in router and firewall dashboards from vendors such as Fortinet, Palo Alto Networks, Cisco Meraki, and pfSense show live interface usage and, on application-aware firewalls, top applications per device.
How to Choose a Bandwidth Monitoring Tool
- Coverage: Check whether the tool monitors only devices you manage or also the ISP, WAN, and cloud paths. Congestion outside your network won't appear in SNMP counters.
- Granularity and retention: Polling intervals of 60 seconds or less catch bursts that 5-minute averages hide. Retention of several months supports capacity planning and ISP disputes.
- Traffic attribution: If you need to know which host or application is consuming bandwidth, you need flow data or application-aware firewall reporting.
- Performance correlation: Utilization alone doesn't tell you whether users are affected. Tools that measure network metrics like latency, jitter, and packet loss alongside usage show you when high utilization becomes a problem.
- Alerting: Look for configurable thresholds on sustained utilization, not just instantaneous values, so alerts reflect real congestion rather than momentary spikes.
- Scale and deployment: Consider how the tool handles multiple sites, remote users, and, for MSPs, multiple client networks from one account.

Get ready to take control of your network bandwidth with this comprehensive list of the best 25 network bandwidth monitoring tools of 2026!
Learn more
8 Common Bandwidth Usage Issues
Bandwidth problems usually surface as slow applications, choppy calls, and timeouts that cluster around specific times or locations. Most trace back to one of the patterns below, each with a recognizable signature in monitoring data. For network performance problems beyond bandwidth, see our guide to common network problems and their causes.
1. Network Congestion at Peak Hours
Congestion happens when demand exceeds link capacity at predictable times, such as the start of the workday, after lunch, or during all-hands video calls. In monitoring data, utilization climbs to a flat plateau near 100% at the same times each day, and latency and jitter rise with it. That flattened top on the graph is the link hitting its ceiling. Traffic above that level is being queued or dropped.
2. Bandwidth Hogs and Top Talkers
A small number of hosts or processes can consume a disproportionate share of a link. Common culprits are backups, OS and software updates, cloud sync clients, and large file transfers. The signature is a sudden step change to sustained high usage, usually in one direction, often starting at a scheduled time. SNMP shows the spike, and flow data shows that one or two hosts account for most of it.
3. Unauthorized or Shadow IT Applications
Streaming services, peer-to-peer clients, personal cloud storage, and unapproved SaaS tools add background load that nobody planned for. These applications rarely cause dramatic spikes. Instead, they raise the baseline, eating into the headroom a link needs to absorb bursts. They're invisible to SNMP counters and only show up in flow data or firewall application reports.
4. ISP Throttling or Underdelivered Bandwidth
Sometimes the problem is the ISP delivering less than the contracted rate, through oversubscription, traffic shaping, or a circuit that never reached its rated speed. The signature is speed tests falling short of the contracted bandwidth while your own interfaces show moderate utilization. Latency and packet loss begin beyond your network edge, not inside it. Historical test results across different times of day are what make an ISP escalation stick.
5. Undersized WAN or Internet Links
Links that were adequately sized when provisioned fall behind as SaaS adoption, video conferencing, and cloud workloads grow. Rather than a single incident, this shows up as a trend: the 95th percentile creeps upward over months, and utilization in the 70–85% warning range becomes the daily norm instead of an occasional peak.
6. Misconfigured or Missing QoS Policies
Without QoS, VoIP and video compete for the same queues as bulk transfers. The signature is real-time applications degrading whenever utilization rises, even well below saturation, with jitter spikes that line up with large downloads or backups. Misconfigured policies can cause the opposite problem, where priority queues are too small and important traffic gets policed or dropped while the link has capacity to spare.
7. Malware, Botnets, and Unexpected Outbound Traffic
Compromised hosts can send spam, join DDoS attacks, or exfiltrate data, and all of these consume upstream bandwidth. Watch for outbound usage rising without a matching increase in inbound traffic, activity outside business hours, and flows to unfamiliar destinations. Treat this pattern as a security incident first and a bandwidth issue second.
8. Saturated Device Interfaces
A bottleneck isn't always the Internet link. It can be a single switch uplink, a firewall reaching its inspection throughput limit, or a port that auto-negotiated to 100 Mbps instead of 1 Gbps. The signature is one internal interface at capacity with rising output discards while the WAN link still has headroom. On firewalls, throughput limits often show up alongside high CPU when inspection features are enabled. Duplex mismatches look different: interface errors climb, and throughput drops, but utilization stays low.

Network running slow or firewall struggling to keep up? Learn what causes high bandwidth usage, how to diagnose it, and how to fix it fast.
Learn more
How to Troubleshoot Bandwidth Usage Issues
To troubleshoot bandwidth usage issues, first confirm that congestion is actually the cause. Then isolate the affected network segment, identify what's consuming the bandwidth, compare actual throughput against contracted capacity, and apply a fix that targets the specific issue. Skipping the first step is the most common reason bandwidth upgrades fail to solve performance problems.
Step 1: Confirm It's Congestion, Not Latency or Packet Loss Alone
Check utilization on the affected path at the times users report problems, alongside latency, jitter, and packet loss for the same window.
If utilization is high and latency rises with it, you're looking at congestion. If utilization is low but packet loss is high, bandwidth isn't the problem. Look instead at interface errors, wireless interference, or a problem upstream at the ISP. Rising output discards on an interface confirm that high utilization is causing packet loss rather than simply coinciding with it.
Step 2: Isolate the Network Segment (LAN, WAN, ISP)
Next, isolate the network segment to identify where the bandwidth issue is happening. Work outward from the user. Check utilization on the access switch uplinks, the core, the firewall, and the WAN or internet edge interface. Then compare performance between internal points, site-to-site, and from each site to the Internet.
If degradation appears site-to-Internet but not site-to-site, the bottleneck is at the Internet edge or beyond it. A traceroute that shows latency or loss starting at a hop past your edge router points to the ISP or a third-party network rather than your own infrastructure.
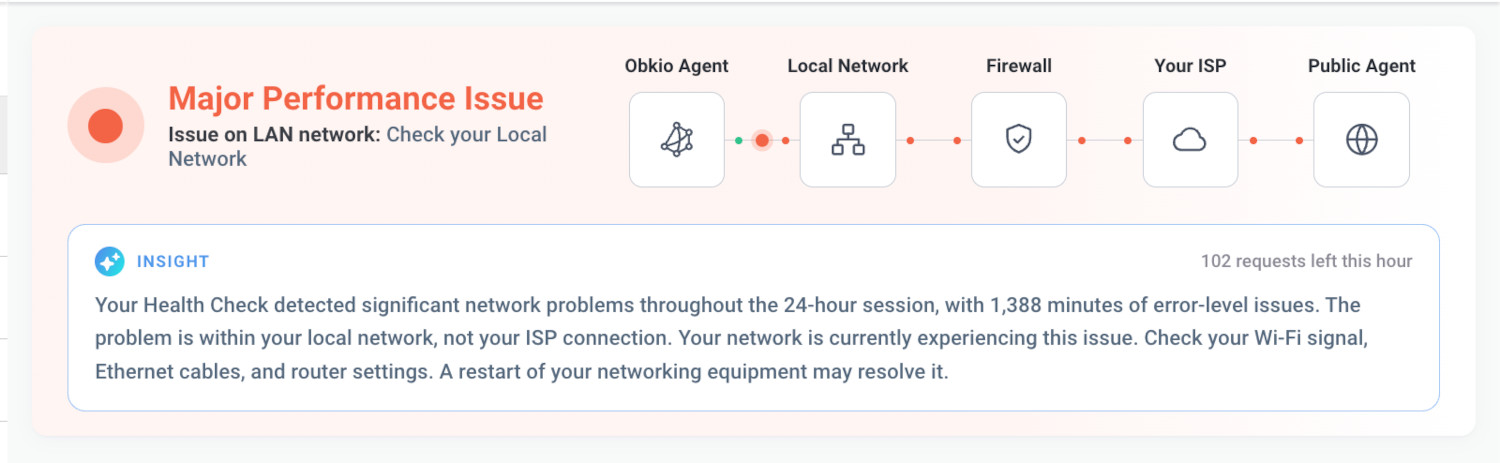
Of course, you don’t need to do this manually. By using a network monitoring and diagnostic tool, like Obkio, you can automate this process. Your monitoring tool will monitor each location for you to identify the source of the issue. Obkio Insights will automatically diagnose the source and cause of the problem as well.
Step 3: Identify Top Talkers and Applications
Once you know which link is saturated, pull flow data or firewall application reports for the congested interval. Match what you find against the common issues covered above:
- A single host running a scheduled job points to a backup or update.
- Steady unexplained background load points to shadow IT.
- Outbound traffic to unfamiliar destinations points to a possible compromise.
When you've narrowed the traffic down to a specific host, use device-level tools on that host to find the responsible process.
Step 4: Compare Actual vs. Contracted Bandwidth
Run speed tests at several times of day and compare the results against the bandwidth in your ISP contract or SLA. If throughput falls short while your edge interface has headroom, the provider is underdelivering. Document the results over days, not a single test, before escalating.
If throughput matches the contract but the link runs in the 70–85% warning range most of the day, check the 95th percentile trend. A steady upward climb means the link is undersized for current demand.
Step 5: Resolve the Bandwidth Usage Issue
Match the fix to the cause:
- Scheduled bulk traffic: Move backups, updates, and sync jobs outside business hours, or rate-limit them.
- Real-time applications degrading under load: Implement or correct QoS policies that prioritize VoIP and video.
- Shadow IT: Block or rate-limit unsanctioned applications at the firewall.
- Suspicious outbound traffic: Isolate the affected hosts and escalate to your security team.
- Internal bottlenecks: Fix duplex or speed negotiation issues, upgrade saturated uplinks, or resize firewalls that are hitting their throughput limit.
- ISP underdelivery: Escalate with the documented test history.
- Sustained growth: Upgrade capacity, using your trend data to size the new link.
After applying the fix, recheck utilization and performance over the same time windows to confirm it worked.
How to Troubleshoot Bandwidth Issues with Obkio Insights
Steps 1, 2, and 4 are where most troubleshooting time goes. Each one means pulling performance data, device metrics, and traceroutes from separate places and lining them up by timestamp. Obkio Insights automates that correlation.
When Obkio detects a performance issue, Insight analyzes data from Network Monitoring Agents, SNMP Device Monitoring, and Visual Traceroute together. It identifies the probable root cause, where the issue originated (your LAN, your ISP, or a third-party service), and who's responsible for fixing it.
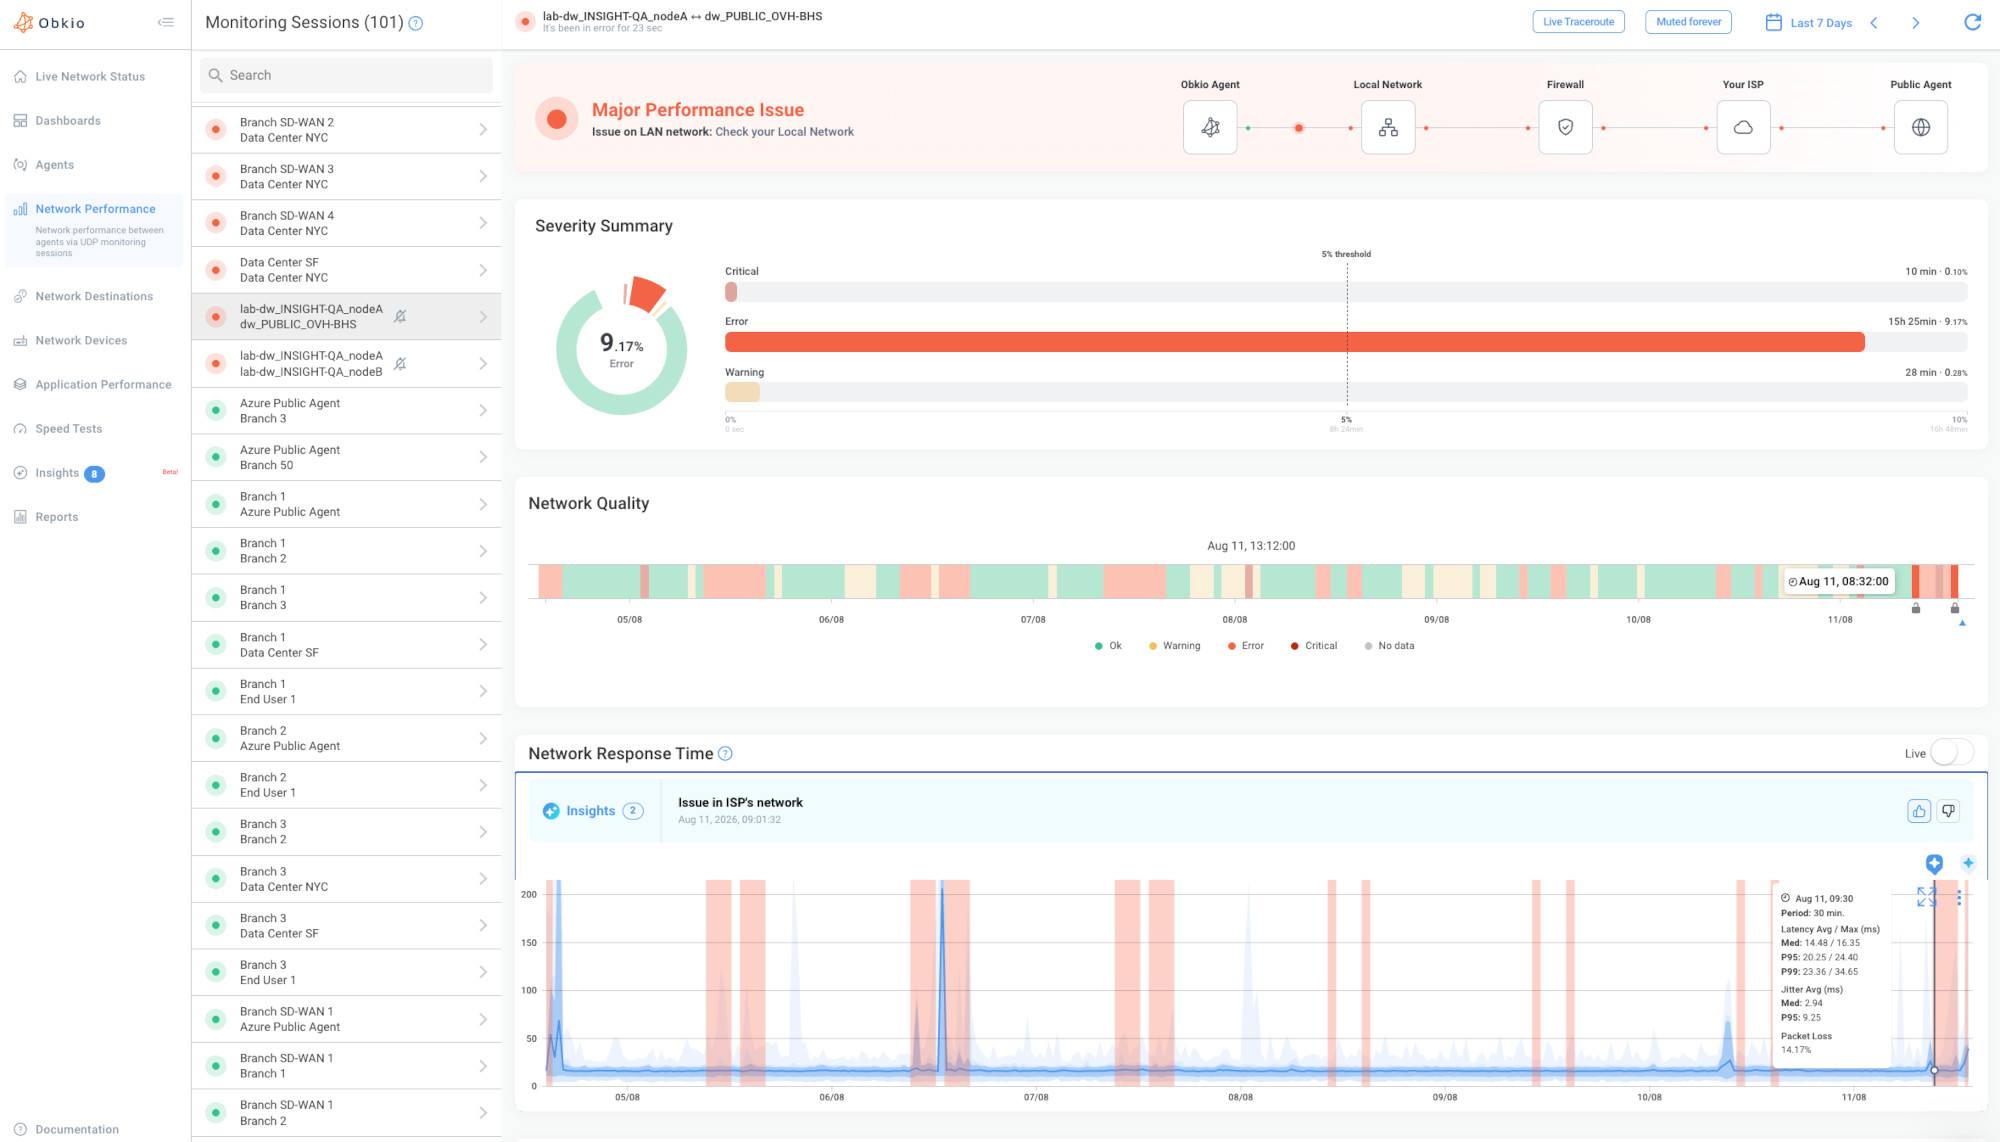
For bandwidth problems, this separates the two scenarios that are easiest to confuse. In one, packet loss lines up with a saturated firewall WAN interface, which points to local congestion. In the other, your interfaces have headroom, but loss starts inside the provider's network, which points to the ISP.
The diagnosis arrives with the alert, along with a dashboard of the correlated evidence behind it. That evidence also works as documentation for an ISP ticket.
Bandwidth Usage Monitoring FAQs
1. How do I check bandwidth usage on my network?
For a quick check, your router or firewall dashboard shows current interface usage and top hosts. For continuous monitoring across the network, use an SNMP-based tool to track utilization on every interface. Add flow data to see which hosts and applications are generating traffic, and use OS-level tools like Resource Monitor or iftop to check a single device.
2. What causes high bandwidth usage?
The most common causes are backups, software and OS updates, cloud sync clients, video conferencing, streaming, and large file transfers. Unsanctioned applications and compromised hosts sending outbound traffic also contribute. If usage is high all day rather than in spikes, the link may simply be undersized for current demand.
3. Can high bandwidth usage cause latency or packet loss?
Yes. As utilization approaches link capacity, packets wait in device queues, which increases latency and jitter. When the queues fill, devices drop packets. VoIP and video degrade first because they can't tolerate delay. If you see packet loss while utilization is low, the cause is usually something else, such as interface errors or an upstream ISP problem.
4. How much bandwidth utilization is too much?
Sustained utilization above 85% of link capacity is generally critical, causing queuing, packet loss, and degraded real-time applications. Between 70% and 85% is a warning range where latency and jitter start to rise. Brief spikes to 100% are normal on busy links; the concern is utilization that stays high over a measurement interval.
5. How often should bandwidth usage be monitored?
Bandwidth usage should be monitored continuously, with interface counters polled every 1 to 5 minutes. Intervals of 60 seconds or less are needed to catch short bursts that longer averages hide. Keep several months of history so you can identify growth trends, plan capacity, and document performance for ISP escalations.
6. Does a speed test measure bandwidth usage?
No. A speed test measures how much throughput a connection can achieve at the moment of the test, not how much bandwidth is already in use. Results also drop when the link is busy, because the test competes with existing traffic. To measure bandwidth usage, monitor interface utilization over time with SNMP or flow data.
Monitor Bandwidth Usage Before It Becomes a Problem
A link averaging 40% utilization can still fail your users every morning at 9:00. Proactive bandwidth monitoring measures usage at intervals short enough to catch bursts and attributes traffic to the hosts and applications behind it. Just as important, it ties bandwidth utilization back to latency, jitter, and packet loss, because high usage only matters when it degrades performance. Knowing whether it does, and where, is what separates targeted troubleshooting from just performing a bandwidth upgrade that will cost you more, but doesn't solve anything.
Obkio monitors bandwidth usage and network performance together, from your devices to your ISP and the cloud. When something degrades, Obkio Insight tells you why.