







 Obkio Blog


 Subscribe
Table of Contents
Table of Contents
Your VoIP calls are choppy. File uploads are crawling. Your team is complaining that the CRM is sluggish, and remote desktop sessions keep freezing. You check your firewall, your switches look clean, and there are no alerts on your LAN. The problem isn't inside your network. It's upstream, and it's happening quietly every day during peak hours.
Internet congestion is one of the most common causes of poor network performance for businesses, and one of the most misdiagnosed. It doesn't announce itself with a hard outage. It shows up as gradual, frustrating, unexplained slowdowns that leave users unhappy and IT teams chasing the wrong root cause. This article breaks down what Internet congestion is, what causes it, how to detect it, and how to fix it before it becomes a business problem.
What Is Internet Congestion? 
Internet congestion occurs when the volume of data travelling through a network path exceeds the available bandwidth, forcing routers to queue or drop packets. This leads to increased latency, packet loss, jitter, and degraded throughput across any application that relies on that circuit.
Think of it like a highway at rush hour. The road doesn't break. There's no accident. There's simply more traffic than the infrastructure was designed to handle at that moment, so everything slows down. For your business, that "highway" is your Internet circuit, and the traffic is everything from video conferencing and cloud application data to backup jobs and software updates, all competing for the same pipe at the same time.
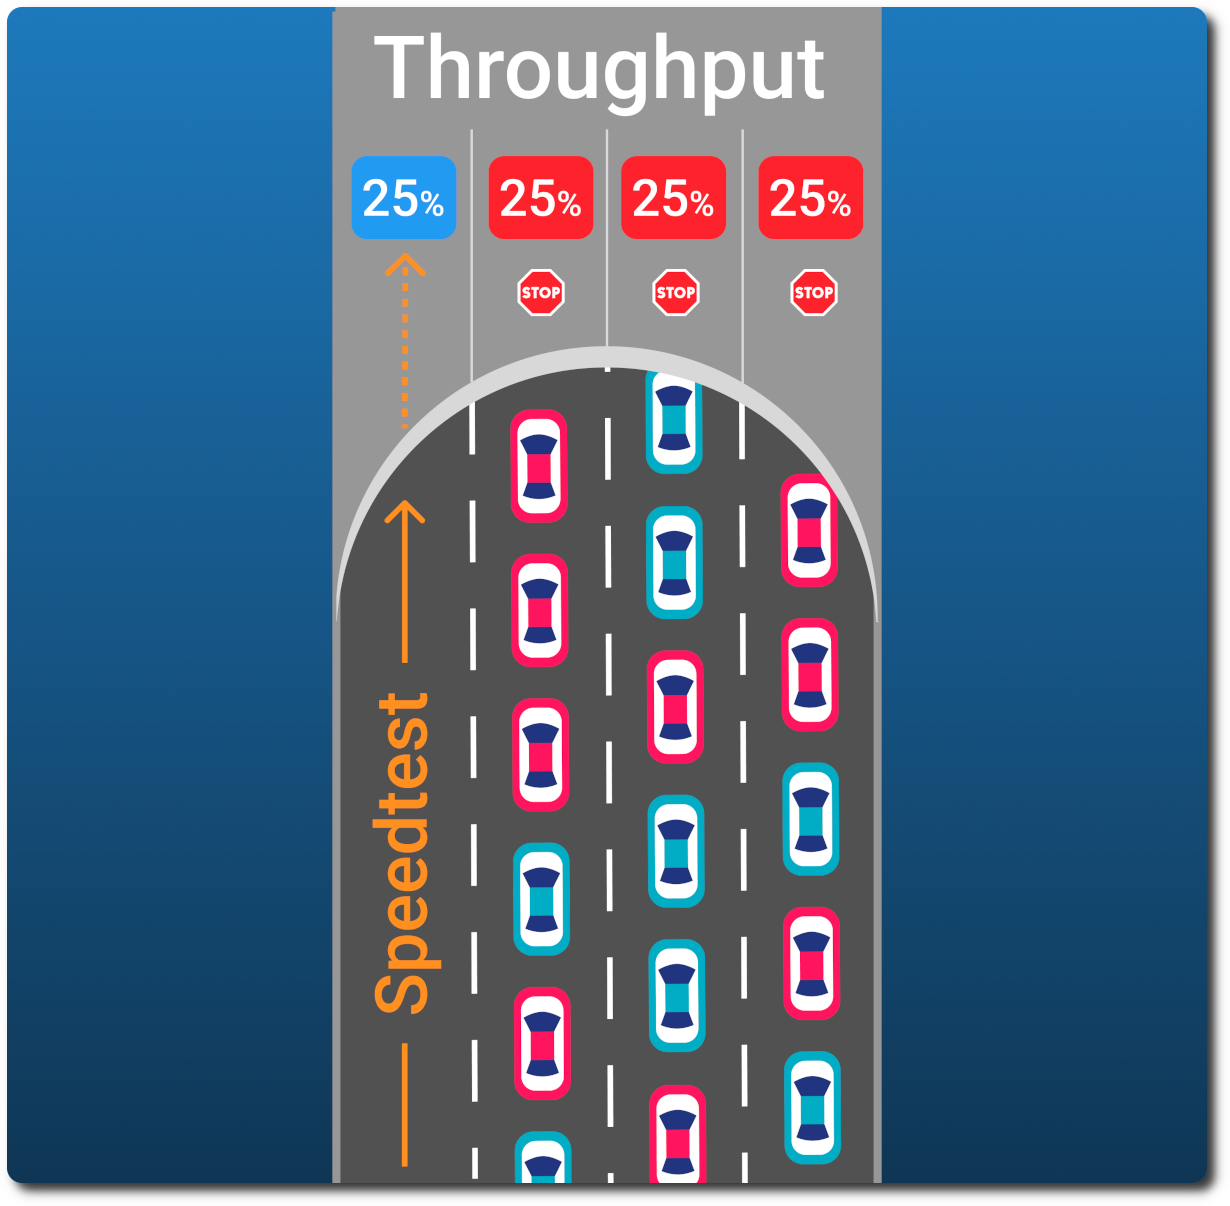
Internet congestion is distinct from LAN congestion, which happens inside your own network. Congestion on the Internet side can originate at your ISP's last-mile connection, further upstream in the ISP backbone, or at peering points where different carriers exchange traffic. Understanding where it happens is the first step to fixing it.
What Causes Internet Congestion?
Several factors push an Internet circuit past its capacity threshold. Most of them compound each other.
Internet Congestion Cause #1: High Bandwidth Usage on Internet Circuit
High bandwidth usage on the Internet circuit is the most direct cause. When total traffic demand approaches or exceeds your circuit's rated capacity, routers start queuing packets. Sustained utilization above 80 to 85% is where congestion effects typically begin. Above 90%, packet drops cascade, and performance degrades sharply for all users.
Internet Congestion Cause #2: Traffic Spikes
Peak usage hours and traffic spikes matter because Internet demand isn't linear. Mornings when staff arrive and fire up Teams and Office 365, lunch breaks when video streaming picks up, and end-of-day backup windows all create predictable demand peaks that can overwhelm a circuit even if average utilization looks healthy.
Internet Congestion Cause #3: Large File Transfers
Large file transfers competing with business traffic are a silent killer. A backup job pushing 500 GB over your WAN link doesn't care that a sales call is happening at the same time. Without QoS policies separating traffic classes, bulk transfers consume whatever bandwidth they can get.
Internet Congestion Cause #4: ISP Backbone Saturation
ISP backbone saturation is a congestion source that's entirely outside your control. Your circuit may be underutilized, but if your ISP's upstream infrastructure is saturated during peak hours, you'll still see packet loss and latency spikes that look exactly like local congestion. This is why directional analysis matters during troubleshooting.
Internet Congestion Cause #5: Peering Congestion
BGP routing inefficiencies and peering congestion affect traffic that must go through multiple autonomous systems to reach its destination. Suboptimal BGP paths can route traffic through congested exchange points, adding latency and increasing the chance of packet loss even when your own circuit has plenty of headroom.
Internet Congestion Cause #6: Insufficient Circuit Capacity
Insufficient circuit capacity for the workload is a long-term planning problem that shows up as a day-to-day operational problem. If your team and application footprint have grown but your Internet circuit hasn't, congestion becomes a chronic condition rather than a periodic spike.
Real Network Example: High Bandwidth Usage Causing Internet Congestion
Here's what Internet congestion caused by high bandwidth usage actually looks like in practice, using a real monitoring session from Obkio.
Obkio is a network performance monitoring and diagnostics tool that continuously measures key metrics, including packet loss, latency, jitter, and bandwidth utilization, across all your network paths. It uses lightweight monitoring agents deployed at each network location, including cloud agents hosted on Azure, AWS, and Google Cloud, to generate synthetic traffic and measure real-time circuit performance end-to-end.


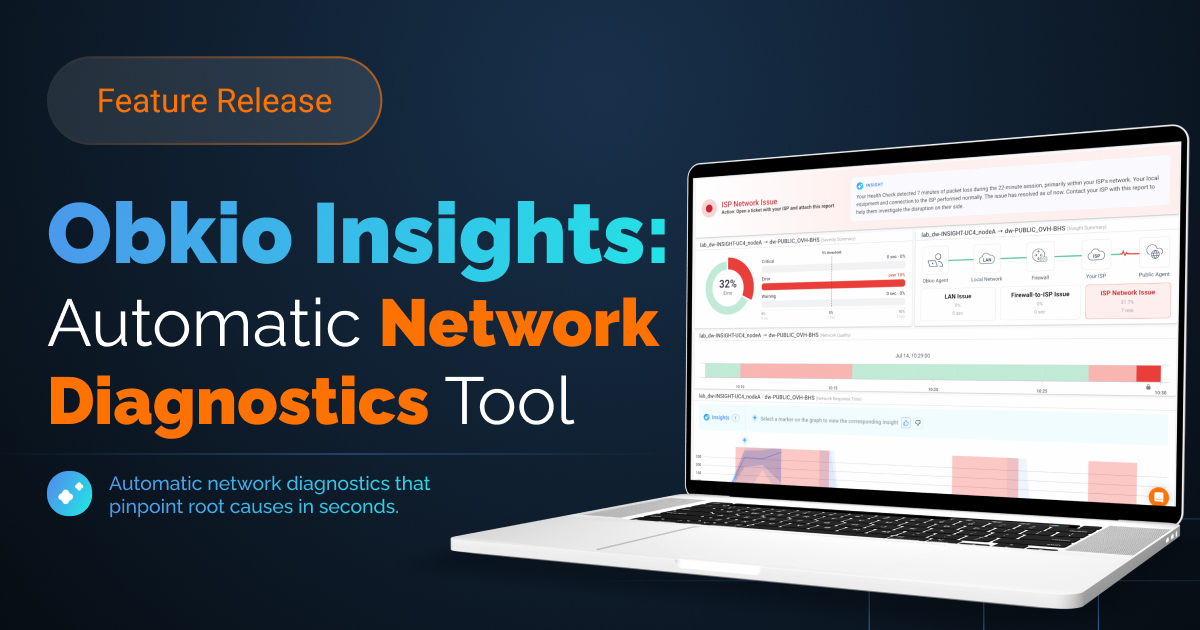
On top of continuous monitoring, Obkio Insights provides automatic network diagnostics. Instead of handing you raw graphs and asking you to figure out what they mean, Insight analyzes the incoming performance data in real time, correlates it across multiple data sources, and surfaces a plain-language root-cause conclusion directly in the interface.
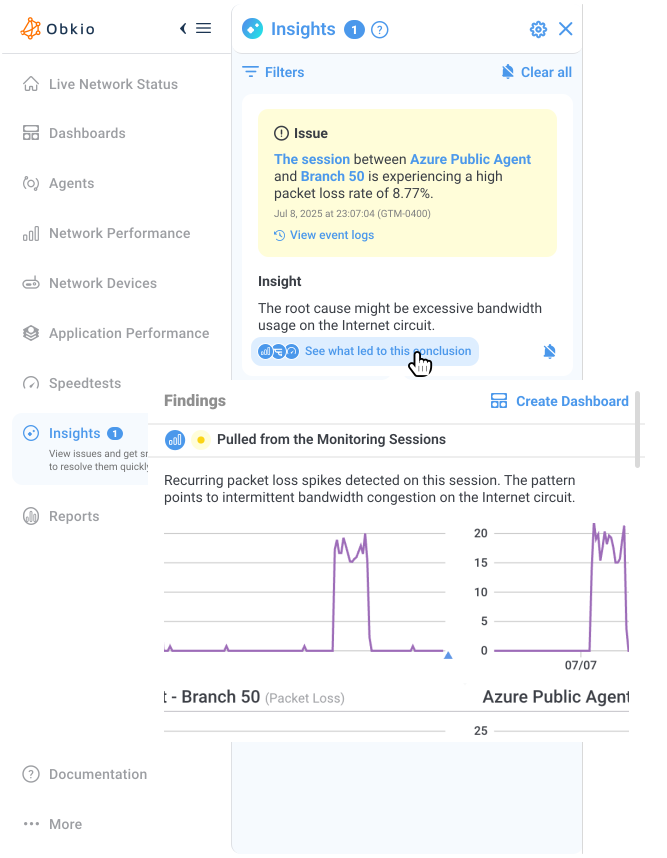
In the example above, here's exactly what Insights detected and reported:
- Issue: The session between Azure Public Agent and Branch 50 is experiencing a high packet loss rate of 8.77%.
- Insights: The root cause might be excessive bandwidth usage on the Internet circuit.
- Findings: Recurring packet loss spikes detected on this session. The pattern points to intermittent bandwidth congestion on the Internet circuit.
The packet loss graph tells the rest of the story. Two distinct spikes, reaching 20% packet loss, appearing at separate intervals before subsiding. That's the signature of bandwidth congestion: not a sustained outage, but intermittent bursts of packet drops that correlate directly with periods of high traffic demand on the circuit.
Without a tool doing this correlation automatically, a network admin would need to manually compare the packet loss graph against bandwidth utilization data, check timestamps, rule out ISP outages, and run traceroutes to confirm the path is intact before arriving at the same conclusion. Obkio Insights compresses that process into seconds.

What Are the Symptoms of Internet Congestion?
The symptoms of Internet congestion show up in your network metrics before they show up in your helpdesk queue. Knowing the thresholds that separate normal from concerning from critical is what separates proactive teams from reactive ones.
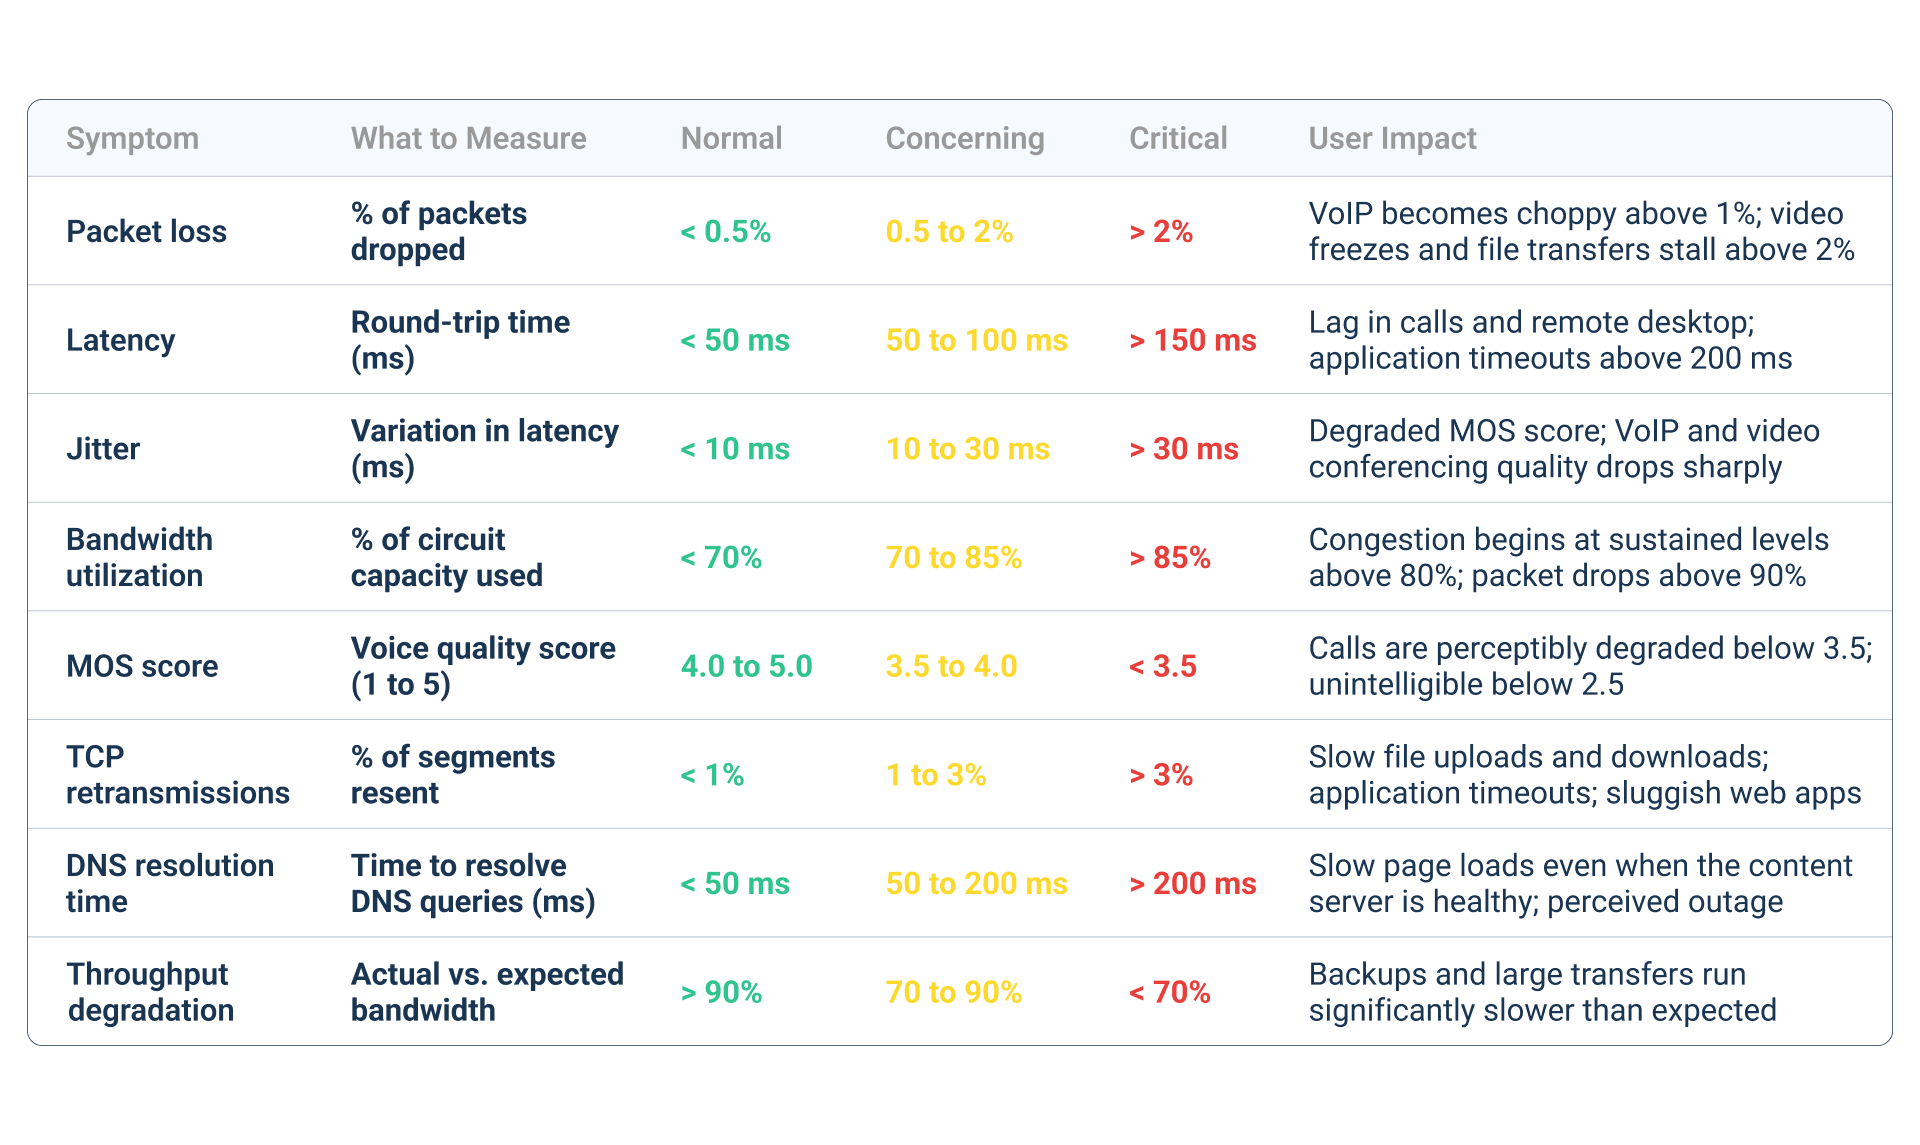
Here's a quick summary of what those thresholds mean and howb they can suggest Internet congestion happening:
- Packet loss above 1% is where VoIP calls start to degrade noticeably. Above 2%, video freezes and file transfers stall.
- Latency over 150 ms creates perceptible lag on calls and remote desktop sessions, and application timeouts start appearing above 200 ms.
- Jitter above 30 ms hits MOS scores hard, which is the first thing users notice on a video call even if they can't articulate why it sounds bad.
- Bandwidth utilization is your early warning metric. Congestion effects begin at sustained levels above 80%. By the time you hit 90%, packet drops are cascading across the circuit and all traffic classes are affected.
- MOS scores below 3.5 mean calls are perceptibly degraded. Below 2.5, they're effectively unusable.
- TCP retransmissions above 3% translate directly to slow uploads, sluggish web apps, and application timeouts that users blame on "the Internet being slow."
- DNS resolution time is one that teams often miss. Slow DNS above 200 ms makes pages feel broken even when the content server is perfectly healthy. It looks like an outage, but isn't.
- Throughput degradation below 70% of expected bandwidth means backups and large transfers are running significantly slower than your circuit should allow, which is a reliable indicator that something is consuming capacity it shouldn't be.
Congestion symptoms rarely appear in isolation. When packet loss climbs, latency increases, jitter follows, and MOS scores drop. If you see multiple metrics degrading at the same time during a specific window of the day, congestion is almost always the root cause.
Internet Congestion vs. Other Network Issues: How to Tell the Difference
Not every slowdown is congestion, and misidentifying the root cause costs time. Here's how to tell the difference between the three most common confusables.
1. Internet congestion vs. ISP outage
An outage is binary: connectivity drops to near zero and doesn't come back until the ISP resolves it. Congestion is gradual. Performance degrades during high-usage windows, then recovers when demand drops. If your metrics show partial packet loss and elevated latency that correlates with time of day, that's congestion. If everything goes dark at 2:00 PM with no recovery, that's an outage.
Learn how to monitor and identify network and Internet outages, like the nationwide Rogers outage, to stay updated on your ISP network status.
Learn more

2. Internet congestion vs. local network saturation
LAN congestion shows up on internal monitoring paths, between endpoints on your own network. Internet congestion shows up on paths that traverse your WAN circuit. If latency is elevated only on sessions that cross the Internet but your internal sessions are clean, the problem is on the ISP side, not in your LAN. This distinction is exactly why monitoring both internal and external paths simultaneously matters.

Discover the top 10 LAN Network Congestion Causes. Learn how to identify, monitor, and troubleshoot LAN congestion with this comprehensive guide.
Learn more
3. Internet congestion vs. application-layer slowdowns
A slow application doesn't always mean a slow network. If your network metrics are clean but one application is sluggish, the bottleneck could be server-side: overloaded application server, slow database query, or CDN issues. Congestion affects all traffic broadly. Application-layer issues tend to affect one service while leaving others unimpacted.
The key pattern to recognize: Internet congestion is characterized by gradual, time-correlated degradation tied to traffic volume, not sudden drops or application-specific failures.
How to Detect Internet Congestion on Your Network
Detecting Internet congestion properly requires continuous measurement, not reactive spot checks. A single ping test during an incident tells you almost nothing. What you need is a baseline, directional data, and correlation between bandwidth utilization and performance metrics. Here's how to approach it step by step.
In this walkthrough, we're using Obkio to detect congestion on an Internet circuit.
Step 1: Establish a continuous network baseline
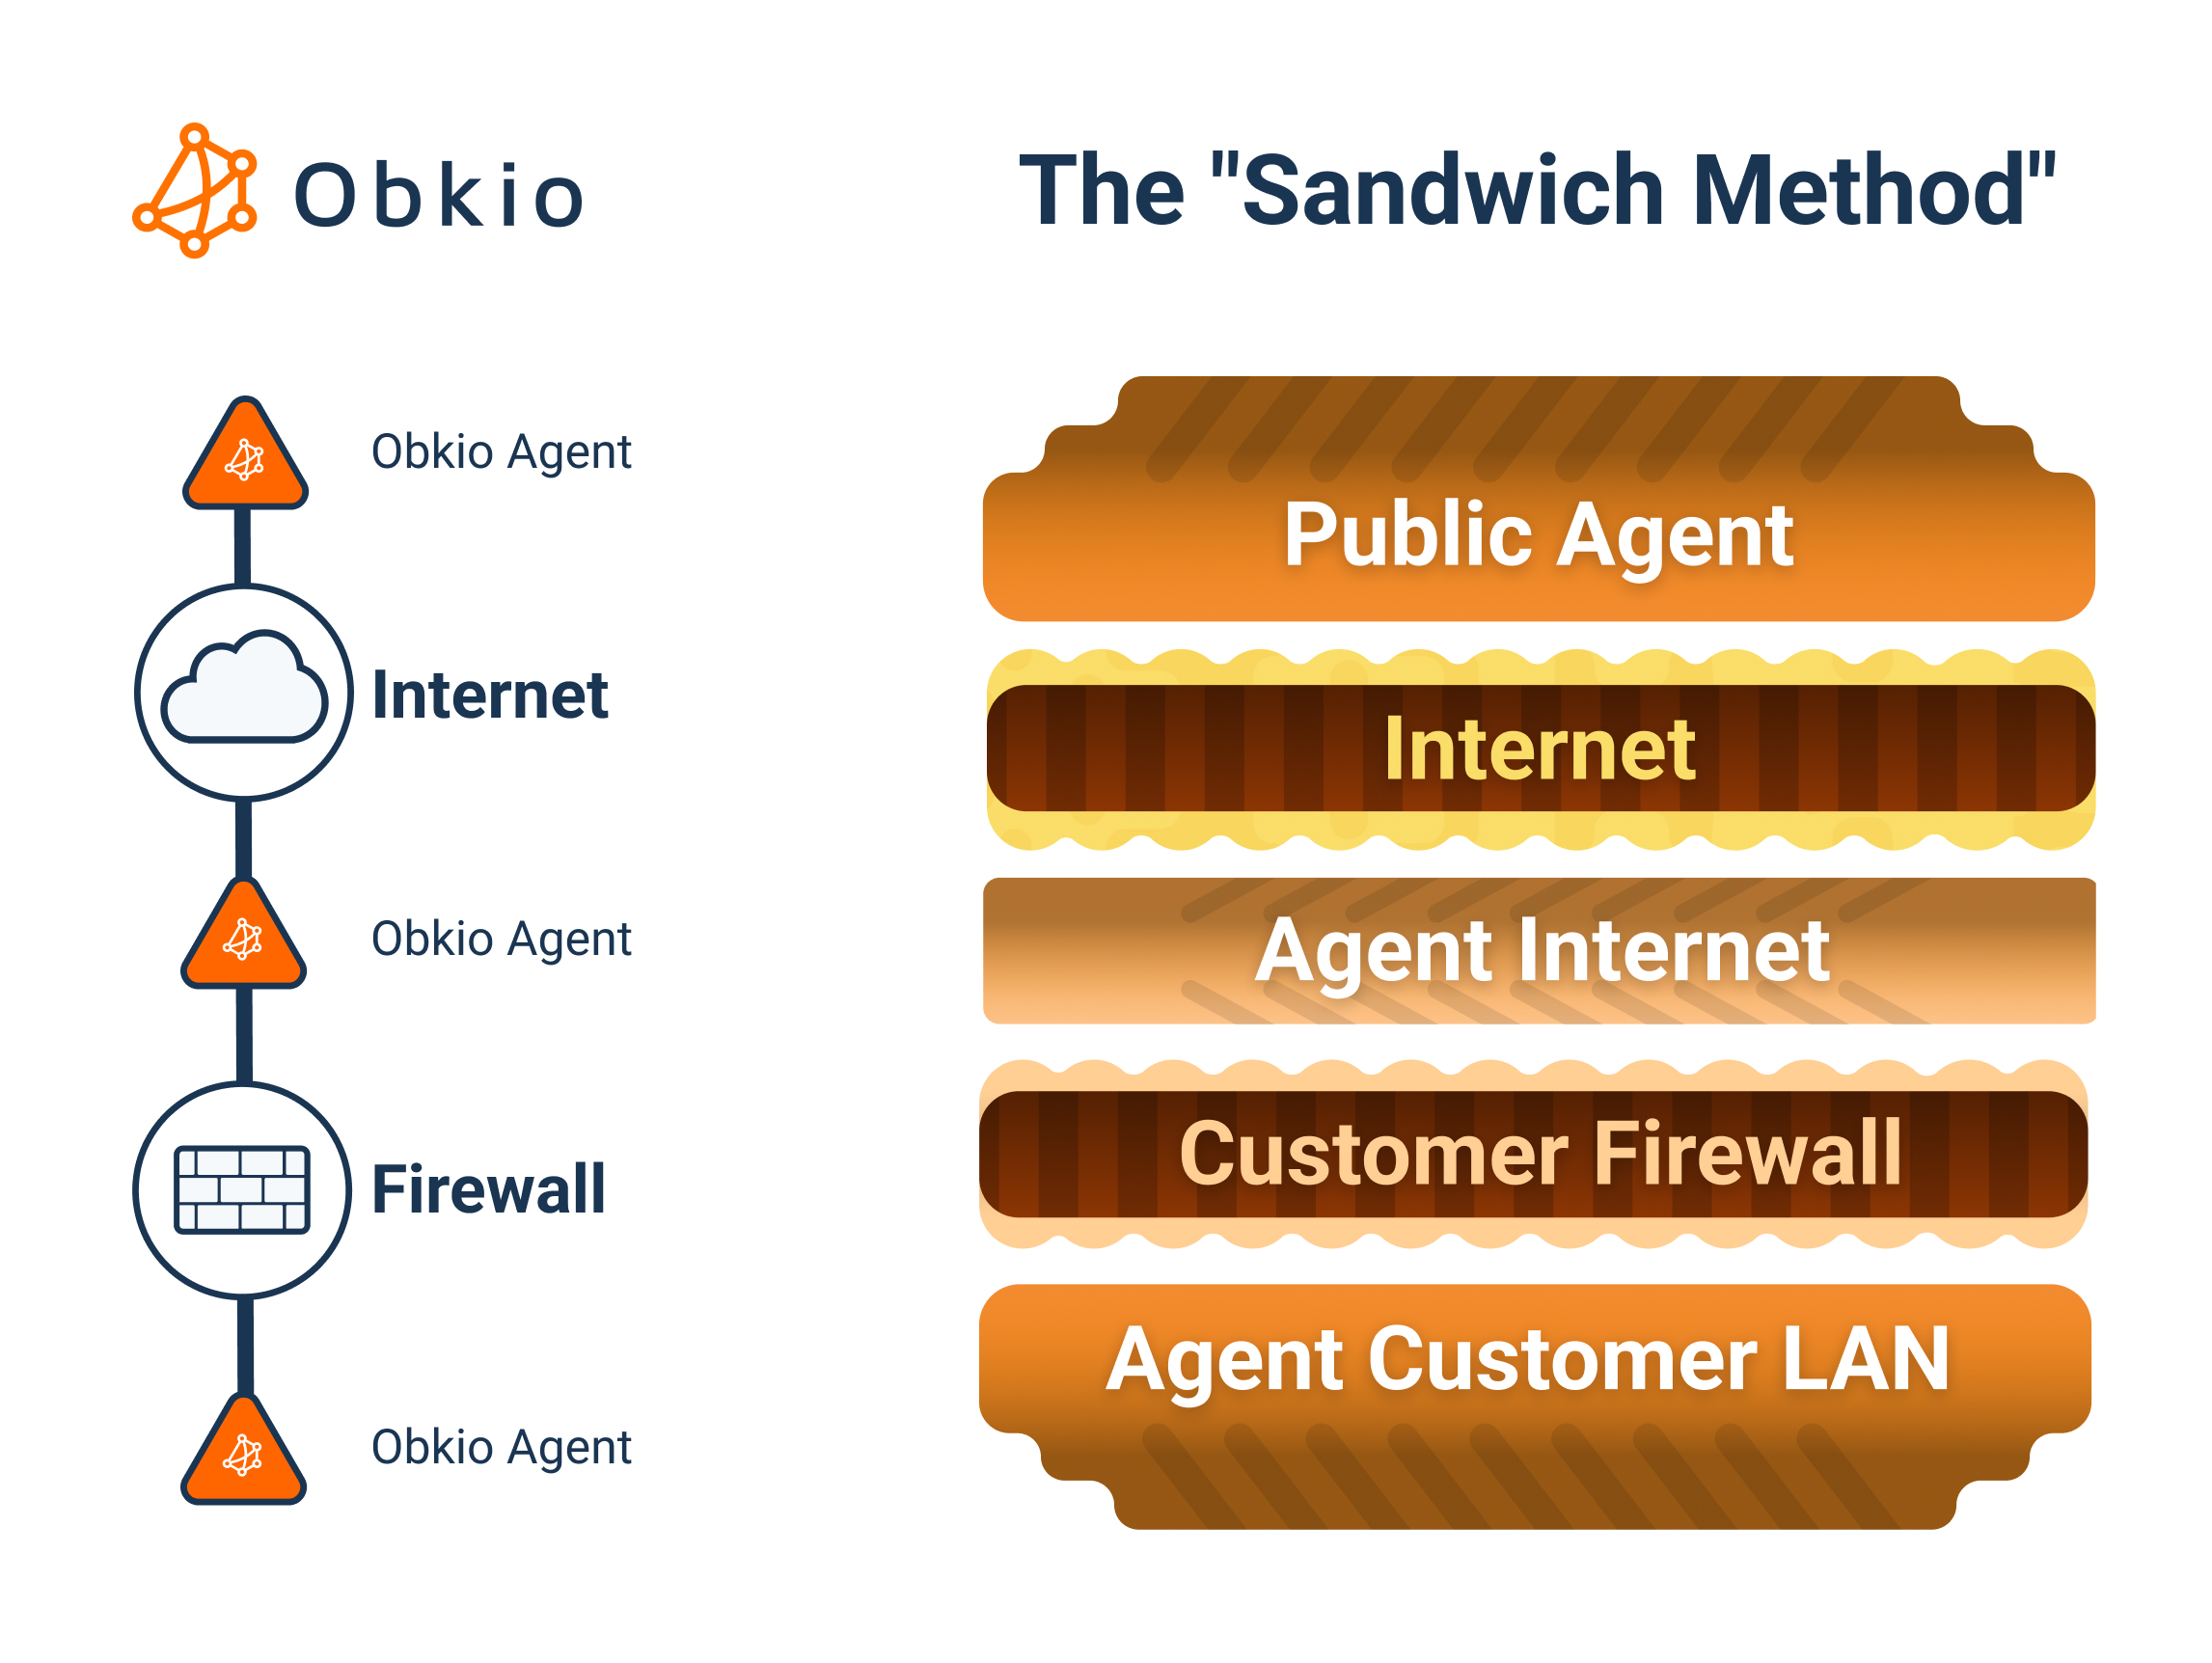
Deploy monitoring agents on both sides of your Internet circuit. One inside your LAN network (at the firewall or router), one pointing to a public agent hosted in your ISP's region or a cloud provider like AWS or Azure. Measure packet loss, latency, jitter, and throughput continuously, not just when something breaks. Without a baseline, you can't tell the difference between "elevated" and "normal for this circuit."
- 14-day free trial of all premium features
- Deploy in just 10 minutes
- Monitor performance in all key network locations
- Measure real-time network metrics
- Identify and troubleshoot live network problems
Step 2: Monitor your Internet circuit in real time
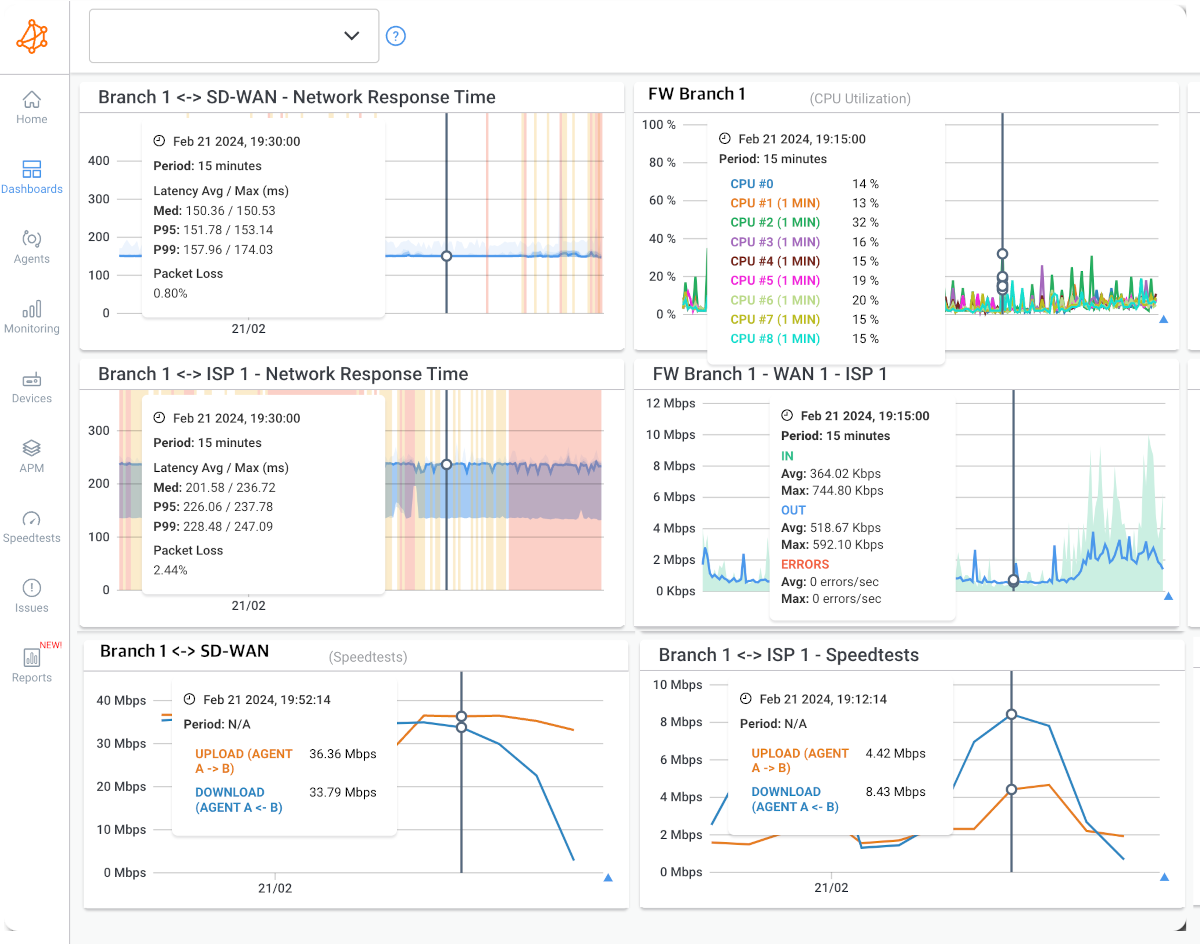
A monitoring solution that uses synthetic traffic, exchanging packets continuously between agents, gives you a real-time view of circuit health independent of what your users happen to be doing. This is fundamentally different from monitoring based on SNMP device polling alone, which tells you if a port is up but not whether packets are actually moving cleanly through it.
Step 3: Correlate packet loss spikes with bandwidth utilization peaks
Pull bandwidth utilization data from your router or firewall via SNMP monitoring alongside your performance metrics. If packet loss climbs every time utilization crosses 80%, that's a congestion signature. The correlation is the diagnosis.
Step 4: Identify the direction of network or Internet congestion
Inbound and outbound congestion have different causes and different fixes. If packet loss is asymmetric, appearing in one direction but not the other, that narrows down where the problem lives. Heavy inbound congestion often points to upstream ISP saturation. Heavy outbound congestion often points to local bandwidth exhaustion from backup jobs or bulk uploads.
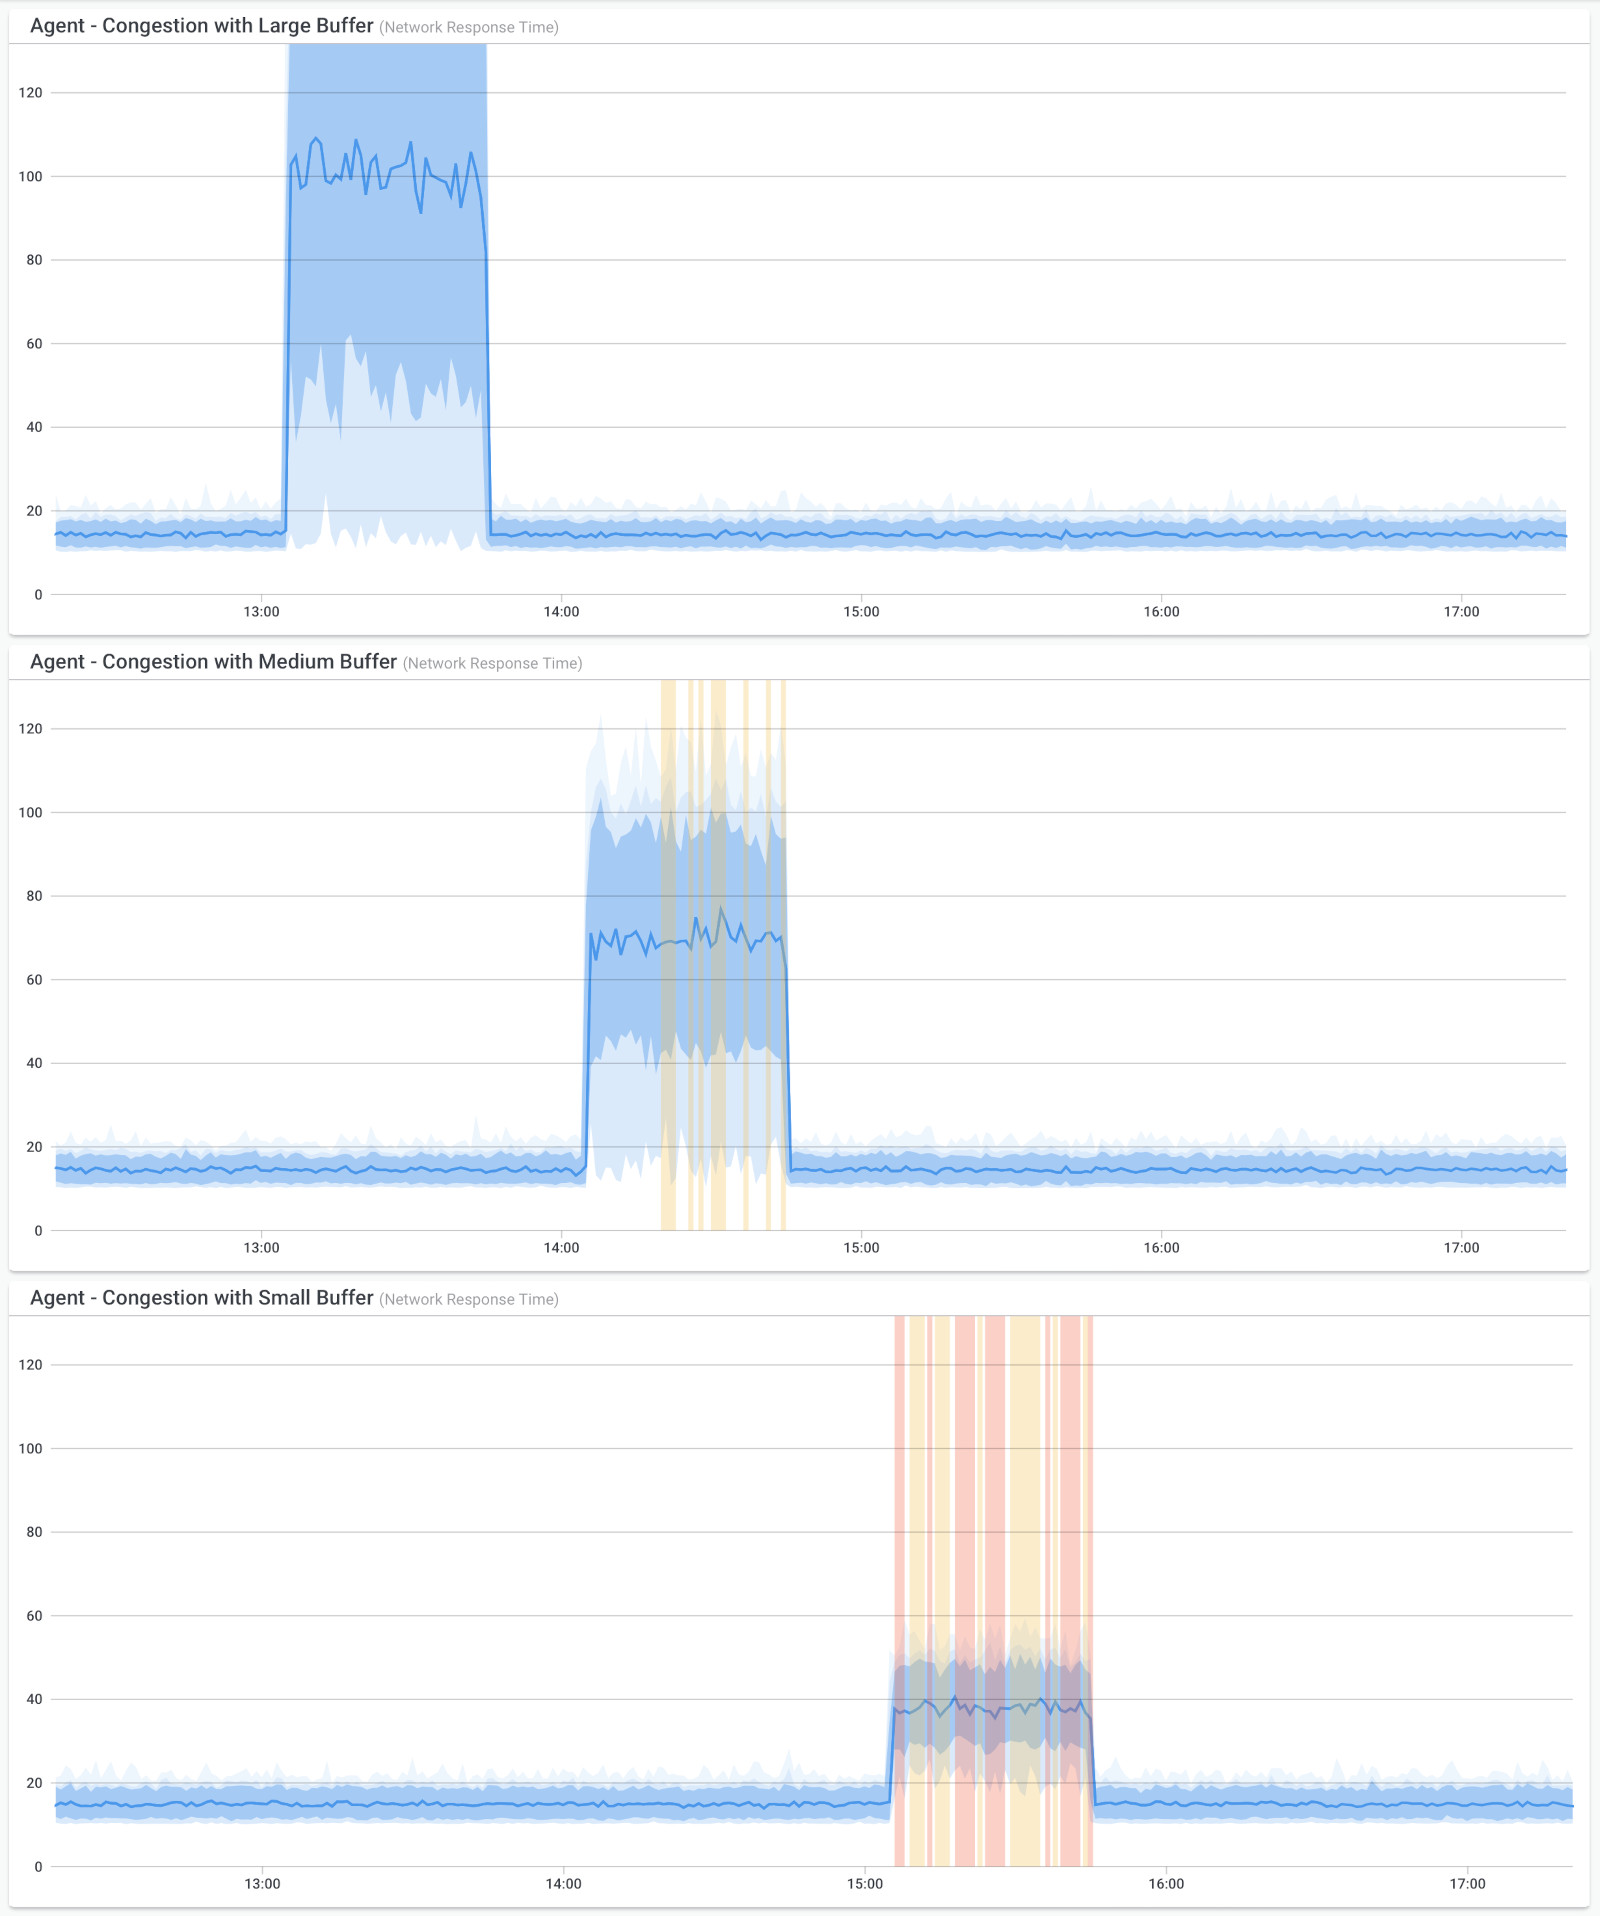
Step 5: Check for BGP path issues or ISP-side problems
Use traceroute data to see whether the packet path is changing or whether latency is accumulating at a specific hop outside your network. Visual traceroute tools integrated with your monitoring data make this significantly faster than running manual traceroutes and comparing them in a text editor.
Step 6: Review per-application traffic to find top consumers
NetFlow or SNMP data from your router can tell you which applications or hosts are consuming the most bandwidth during congestion windows. Backup jobs, video streaming, large file sync tools, and software update processes are the usual suspects.
Obkio Insights Identifies Internet Congestion Automatically
Manual correlation works, but it's time-consuming. Most IT and network teams are already stretched thin, and spending an hour correlating graphs after a performance incident isn't a sustainable workflow. This is exactly the problem Obkio Insights was built to solve.
Obkio Insights is an automatic network diagnostics tool that monitors incoming performance data in real time and applies diagnostic logic to identify the root cause rather than just reporting symptoms. Instead of handing you five different graphs and asking you to figure out what they mean together, Insights does that correlation for you and surfaces a plain-language conclusion directly in the interface.
Here's a real example from a production monitoring session.
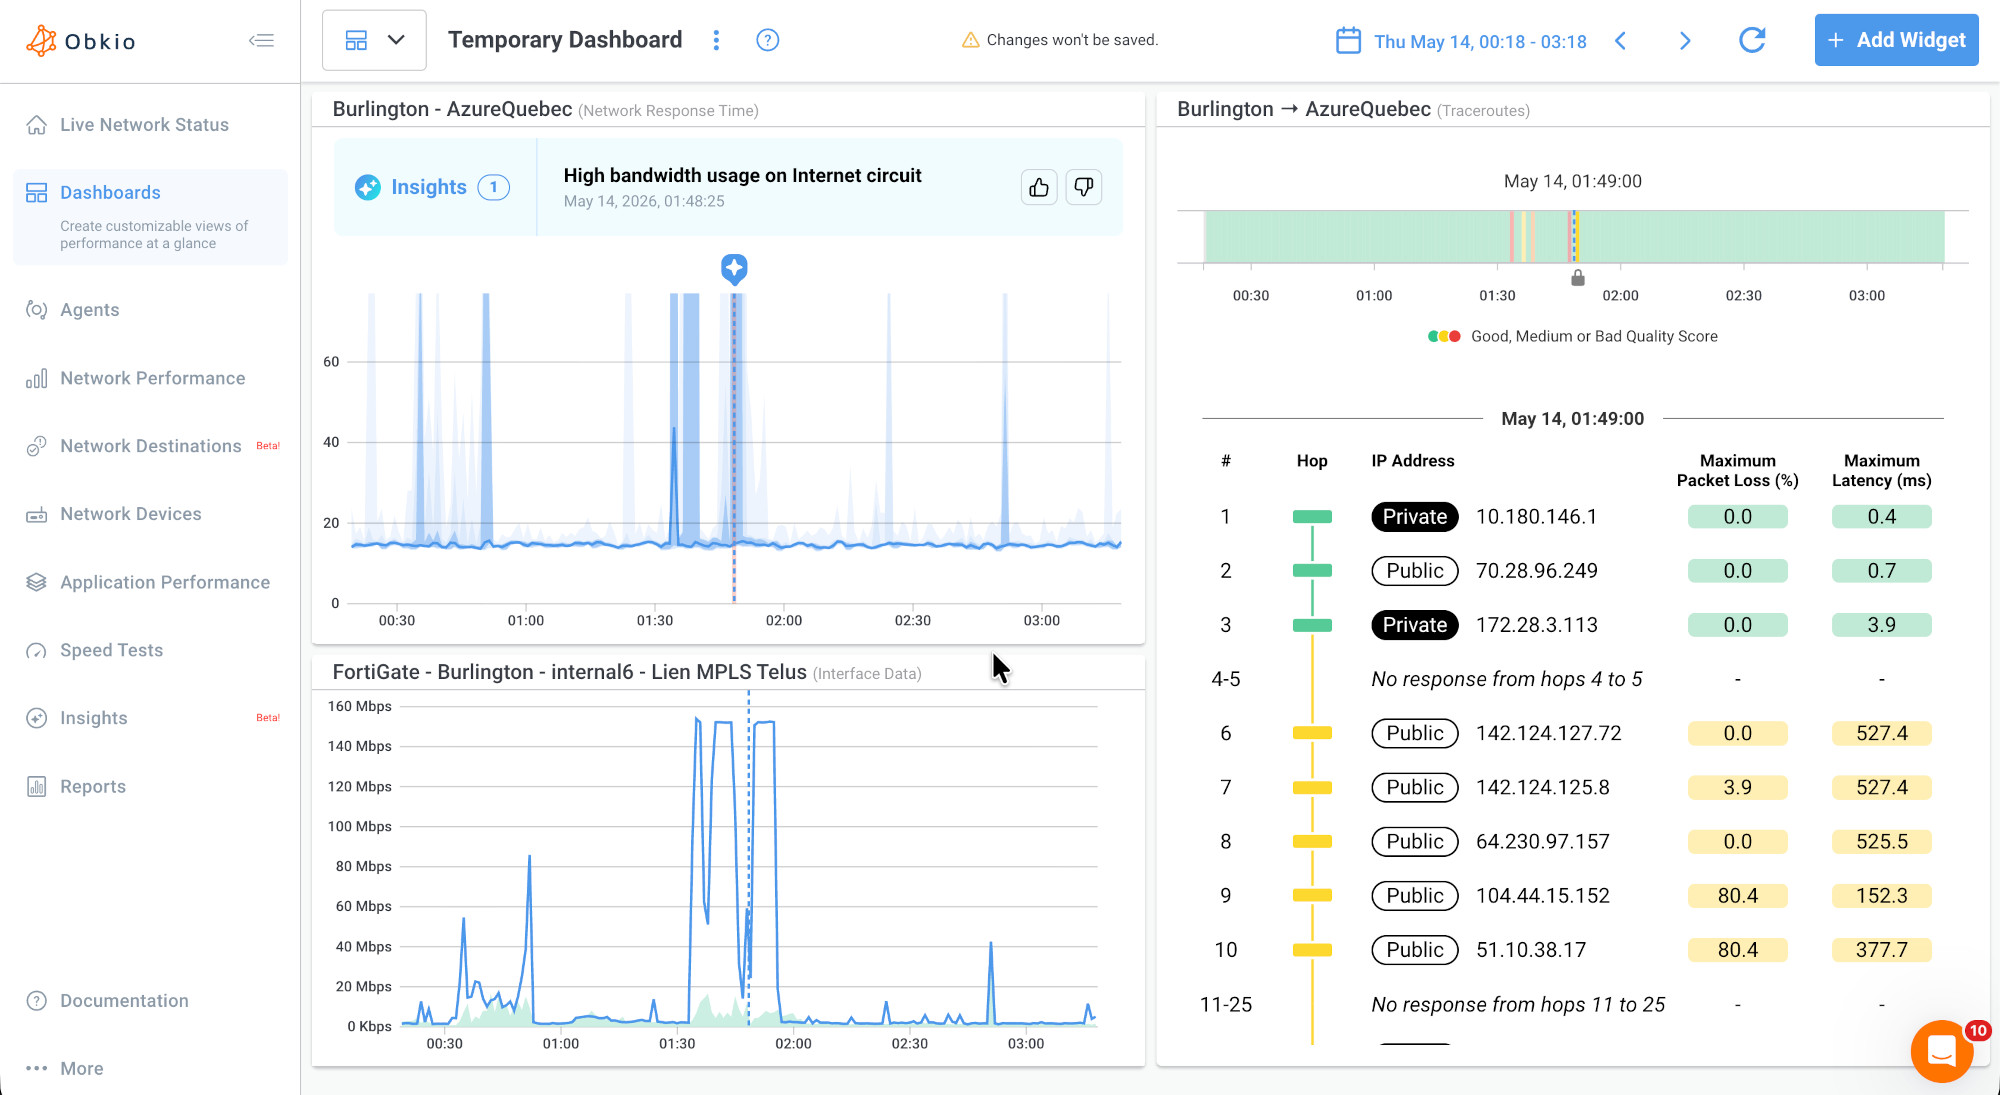
[Screenshot: Obkio dashboard showing Insights detecting high bandwidth usage on an Internet circuit between Burlington and AzureQuebec, correlated with SNMP interface data and Visual Traceroute]
Insights: High bandwidth usage on Internet circuit
Directly below, the FortiGate Burlington interface data from SNMP confirms exactly what Insights identified: the circuit spiked to approximately 150 Mbps during that same window, well above the baseline utilization visible across the rest of the monitoring period. The timing correlation between the bandwidth spike and the packet loss spikes is exact. That's not a coincidence. That's congestion.
Visual Traceroutes on the right side complete the picture. Hops 1 through 3 are clean, 0% packet loss and sub-4 ms latency, which means the local network and the first miles of the ISP path are healthy. The problem shows up at hops 9 and 10, both public IP addresses, with 80.4% packet loss and maximum latencies of 152 ms and 377 ms, respectively. The congestion is happening upstream, outside the local network, exactly where the bandwidth demand was exceeding the circuit's capacity.
Without Insights, arriving at that conclusion would require a network admin to open the performance graph, open the SNMP interface data separately, line up the timestamps manually, run a traceroute, interpret the hop-by-hop output, and then cross-reference all three to confirm the diagnosis. With Insights, the conclusion is already surfaced before you've finished opening the dashboard.
Obkio Insights correlates data across Network Performance Monitoring, SNMP Device Monitoring, Visual Traceroute, and Network Destinations simultaneously. The diagnostic engine applies logic built from 25 years of networking expertise, which means it catches patterns that are obvious in hindsight but easy to miss when you're looking at individual metric streams in isolation.
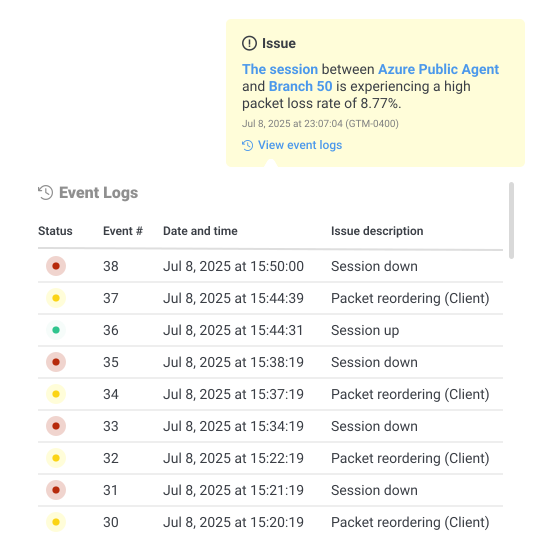
When Insights detects a congestion event, it surfaces the affected session, the root-cause conclusion, and the timestamp. No manual graph comparison. No guesswork. The diagnosis is done.
How to Fix Internet Congestion
Fixing Internet congestion splits into two tracks: what you can do right now to reduce the immediate impact, and what you need to do over the next weeks or months to address the structural causes.
Short-Term Internet Congestion Fixes
- Identify and throttle top bandwidth consumers. If a single backup job or bulk file sync is saturating your circuit during business hours, throttling it to a defined bandwidth ceiling buys immediate relief for everything else. Most backup software and file sync tools support bandwidth throttling natively.
- Prioritize business-critical traffic with QoS policies. Quality of Service configuration on your router or firewall lets you tell the network which traffic classes get preferential treatment when the circuit is under load. VoIP, video conferencing, and ERP traffic should sit in high-priority queues. Backup and software update traffic should sit in best-effort queues. This doesn't add bandwidth, but it makes a congested circuit significantly more functional for the traffic that matters most.
- Schedule large transfers during off-peak hours. Backups, software distribution, and large file synchronization jobs don't need to run during business hours. Pushing them to overnight windows removes the most common source of daytime congestion without touching any hardware or contracts.
Long-Term Internet Congestion Fixes
- Upgrade circuit capacity based on utilization data. Gut feel isn't a capacity planning strategy. Use your monitoring data to show sustained utilization trends over a 30 to 90 day window. If you're consistently hitting 80% or above during business hours, you need more capacity. Historical utilization data also gives you a concrete business case to take to management or your ISP.
- Implement SD-WAN for traffic steering across multiple circuits. SD-WAN lets you use two or more Internet circuits simultaneously, routing different traffic types to different links based on real-time performance and policy. If your primary circuit is congested, SD-WAN can automatically steer sensitive traffic to a secondary link. It doesn't eliminate congestion on any single circuit, but it gives you the flexibility to work around it dynamically.
- Work with your ISP to address upstream congestion. If your utilization data shows your circuit is well under capacity but you're still seeing congestion symptoms, especially during predictable windows, the problem may be upstream. Document the pattern with timestamped metric data and take it to your ISP. Carriers have visibility into their backbone utilization and peering arrangements that you don't. A congestion complaint backed by data gets taken seriously. A vague complaint about slowness does not.
- Add redundant Internet links with failover. A second Internet circuit from a different carrier, even a lower-capacity one, provides both additional bandwidth and a fallback path when the primary circuit is saturated or experiencing an ISP-side issue. Dual-carrier Internet with automatic failover is one of the most practical investments a multi-site organization can make in network resilience.
Learn how to detect network congestion & perform a network congestion test inside & outside your network with Network Monitoring & Network Device Monitoring.
Learn more
How to Prevent Internet Congestion Before It Impacts Users
The best Internet congestion event is the one your users never notice because you caught it first. That requires continuous monitoring, alerting, and a capacity planning discipline.
1. Set bandwidth utilization alerts at two thresholds: Flag at 80% utilization and set an action threshold at 90%. The 80% alert gives you time to investigate and act before performance degrades significantly. By the time you hit 90%, congestion effects are already present and escalating.
2. Monitor continuously, not reactively: Polling your router once every five minutes misses the kind of short-duration spikes that cause VoIP calls to drop and latency to spike. Synthetic monitoring that exchanges packets every 500 milliseconds gives you the resolution needed to catch intermittent congestion before users report it.
3. Use historical trend data for capacity planning: Month-over-month utilization trends tell you how fast your bandwidth demand is growing. If you're adding 5% utilization per month, you have a concrete timeline for when your current circuit will become a chronic problem. Planning a circuit upgrade before you hit the wall is dramatically cheaper than operating in crisis mode.
4. Review your ISP circuit regularly: Circuits that were right-sized two years ago may not be right-sized today. Application footprints grow, remote work changes traffic patterns, and cloud adoption shifts where data needs to go. An annual circuit review based on monitoring data is a basic operational discipline.
Tools like Obkio can alert you before congestion reaches a threshold that impacts users, giving your team time to act proactively rather than respond after the damage is done.
Frequently Asked Questions About Internet Congestion
What is Internet congestion and why does it happen?
Internet congestion happens when demand for bandwidth on a network path exceeds the available capacity, forcing routers to queue or drop packets. It can occur at your own Internet circuit, at your ISP's local infrastructure, or further upstream in the carrier backbone or at peering points between carriers.
What are the signs of Internet congestion?
The most common signs are elevated packet loss, increased latency, high jitter, degraded MOS scores on VoIP calls, slow file transfers, TCP retransmissions, and throughput below expected levels. These symptoms often correlate with peak usage periods during the business day.
Does Internet congestion cause packet loss?
Yes. When a router's queue fills up and it cannot forward packets fast enough, it drops them. Packet loss is one of the clearest indicators of active congestion, and even low levels, above 1%, have a measurable impact on VoIP quality and application performance.
How do I know if my ISP is causing congestion?
Monitor the performance of your Internet circuit using agents on both sides of your WAN link. If packet loss and latency are elevated on sessions traversing the Internet but your internal network paths are clean, the problem is upstream. Use traceroute data to identify where on the path latency is accumulating. If multiple hops inside your ISP's infrastructure show elevated latency during the same time windows, that's ISP-side congestion.
What is the difference between network congestion and an outage?
An outage is a loss of connectivity, typically binary and complete. Congestion is a performance degradation under load. During congestion, your connection is still up but packets are being dropped or delayed. During an outage, the connection is down entirely. Congestion is characterized by gradual time-correlated degradation. Outages are characterized by sudden complete failures.
Can Internet congestion be fixed without upgrading bandwidth?
Often, yes. QoS policies, traffic shaping, scheduling large transfers off-peak, and identifying bandwidth hogs can significantly reduce congestion impact without changing your circuit capacity. For chronic congestion caused by sustained growth in demand, a circuit upgrade or SD-WAN implementation becomes necessary.
How do I monitor Internet congestion on my network?
Deploy monitoring agents on both sides of your Internet circuit and measure packet loss, latency, jitter, and bandwidth utilization continuously. Correlate performance metric spikes with utilization peaks to identify congestion signatures. Tools like Obkio automate this correlation and can surface a root-cause diagnosis, such as "High bandwidth usage on Internet circuit," without requiring manual analysis.
Conclusion: Don't Wait for Users to Tell You Your Internet Is Congested
Internet congestion is a performance problem that hides in plain sight. It doesn't trigger a hard alert. It doesn't take anything offline. It just slowly degrades every application that depends on your Internet circuit until your users are frustrated and your team is spending time troubleshooting symptoms instead of addressing root causes.
The path out of that loop is straightforward: continuous monitoring, directional measurement, correlation between bandwidth utilization and performance metrics, and a clear plan for both short-term traffic management and long-term capacity. The teams that catch congestion early share one thing in common. They measure continuously instead of reactively, and they know exactly what their Internet circuit looks like when it's healthy.
If your team is currently spending time correlating graphs manually to diagnose performance events,Obkio Internet Performance Monitoring with Obkio Insights automates that process and gives you a root-cause diagnosis in seconds, not hours. Start a 14-day free trial and see what your Internet circuit actually looks like under load.
- 14-day free trial of all premium features
- Deploy in just 10 minutes
- Monitor performance in all key network locations
- Measure real-time network metrics
- Identify and troubleshoot live network problems