




 Obkio Blog


 Subscribe
Table of Contents
Table of Contents
To troubleshoot ISP issues, first confirm the problem hits every device and starts outside your network. Then measure packet loss, latency and jitter toward Internet destinations, and use traceroutes to find the hop where performance degrades. Finally, send your provider timestamped evidence that the issue sits in their network.
Most ISP tickets stall at level 1 support because they arrive as “the Internet is slow.” The ones that get escalated carry three things: when the problem started, where in the path it begins, and how bad it is.
This article shows how to gather all three. It follows a real case where 15% packet loss at 10 pm traced back to congestion between two Internet providers. It also covers the most common ISP issues, how to tell them apart from problems in your own network, and what to include when you escalate.
What Are ISP Issues? 
ISP issues are performance or availability problems that start in your Internet Service Provider’s network, anywhere between your modem or edge router and the point where traffic leaves the provider’s network. They show up as packet loss, high latency, jitter, slow speeds, disconnections or full outages. Because they sit upstream of your network, they affect every device and user behind the same connection.
That last point is the fastest way to tell an ISP issue from an internal one. A problem limited to one device, one VLAN or one Wi-Fi access point is almost always local. A problem that hits every device at a site, persists on a wired connection, and disappears when traffic fails over to a backup connection points to your provider.
Why Identifying ISP Issues Matters for Internet Performance
ISP issues cost the average business $5,600 per minute of downtime. For a mid-sized company, a 4-hour ISP outage can result in $1.3 million in lost productivity and revenue. E-commerce sites face immediate transaction losses, support centers experience call quality degradation, and remote teams lose collaboration capabilities
Whether you’re running video conferences, using any cloud-based applications, or collaborating with team members remotely, Internet connectivity plays a vital role in ensuring business operations run smoothly. We know that when it comes to Internet performance, your ISP is often the one running the show.
Whether it’s throttling, bandwidth limitations, or ISP congestion, identifying issues quickly helps you prevent performance setbacks that can trigger a domino effect on productivity, customer satisfaction, and revenue.
Need a Quick Fix? Watch Our Video on Identifying and Troubleshooting ISP Issues with Obkio
If you’re short on time and need a quick solution to identify and troubleshoot ISP issues, we’ve got you covered. Our quick how-to video gives you step-by-step instructions on how to identify and troubleshoot ISP issues in minutes. In this video, we walk you through a real-life example that showcases how easy it is to use Obkio’s Network Monitoring Tool to pinpoint and fix ISP-related problems.
Seeing Obkio in action will give you a clear idea of how our network monitoring & diagnostics solution simplifies the troubleshooting process. While we’ll go into detail throughout this article, the video offers a quick preview of the steps and techniques we'll cover. It's the perfect starting point if you want an immediate visual guide before diving deeper.


What Are Common ISP Issues?
When experiencing Internet connectivity problems, it’s important to know which issues could stem from your ISP. Most ISP problems fall into nine categories. Each one has a typical symptom and a metric that confirms it, which is what your ISP will ask for when you open a ticket.

1. ISP Outage
An outage takes the whole site offline. Local devices, printers and internal servers stay reachable, but nothing on the Internet loads. Common causes are failed provider equipment, a fibre cut or a wider upstream outage. It shows up as 100% packet loss toward every Internet destination at once. If a backup connection at the same site stays up, the problem is the primary provider.
2. Intermittent Disconnections
The connection drops for a few seconds or minutes, then comes back. Calls cut out, VPN tunnels renegotiate, and SaaS sessions time out. The cause is usually in the local loop, the segment between your site and the provider's first piece of equipment: line errors, a failing modem or degraded copper or fibre. Look for short bursts of 100% loss that line up with connection events. Drops this brief rarely show up in a speed test. For a full walkthrough, see why your Internet keeps disconnecting.
3. Packet Loss
Packet loss happens when packets never reach their destination. Users notice choppy calls, frozen video and transfers that crawl even on a fast plan. On the provider side, the usual causes are congested links, faulty equipment and routing problems. To confirm it's the ISP, measure loss toward several destinations from the same site. Loss toward all of them points to the provider. Loss toward only one points to that destination's network. More in ISP packet loss.
4. High Latency
High latency shows up as slow page loads, laggy remote desktop sessions and audio that arrives late. On the provider side, the cause is usually long or inefficient routes, or queuing on congested links. The useful measurement is round-trip latency compared to your own baseline, not a generic number. A link that normally sits at 15 ms and jumps to 60 ms has a problem even if 60 ms sounds acceptable on paper. Sudden, short jumps are covered in how to fix latency spikes.
5. Jitter
Jitter is variation in packet arrival times. It hits real-time traffic hardest: voice turns robotic or cuts in and out, and video stutters even when bandwidth is fine. Congestion and unstable routing in the provider's network are the usual causes. Measure jitter in milliseconds alongside MOS, which translates it into a call quality score your provider can't argue with.
6. Peak-Hour Congestion
When performance drops at the same hours every day and recovers overnight, the provider's links are likely oversubscribed. The day-by-day pattern is the evidence. Plot latency and loss by time of day over a week or more, and peak-hour congestion stands out clearly. This pattern is also one of the hardest for an ISP to dismiss.
7. ISP Throttling
Throttling is deliberate traffic shaping: specific traffic types, or your overall speed, are capped well below what your plan promises. Compare measured throughput against your plan speed and test different traffic types at different times. If one type of traffic is consistently slower while others run normally, shaping is the likely cause. See how to tell if your ISP is throttling you.
8. Routing and Peering Problems
Sometimes only certain destinations, cloud regions or countries are slow, while everything else works. That usually means poor peering or a degraded handoff between your provider and another network. A traceroute shows where it starts. Loss or latency that begins at the hop where the AS number changes points to the interconnection between two providers, not to either endpoint.
9. ISP DNS Issues
With DNS issues, sites fail to load or hang before loading, even though connectivity by IP address works fine. The cause is slow or failing DNS resolvers run by your ISP. Measure DNS response time and resolution failures. To confirm, temporarily switch a test machine to a public resolver; if the problem disappears, the ISP's DNS is at fault. More in how to identify DNS issues.

Discover what and how to monitor with the right tool, setting the stage for top ISP network performance and a strong foundation for business growth.
Learn more

Is It An ISP Issue or A Network Issue?
Not every Internet problem is related to your ISP. Sometimes, it really is related to a network problem in your LAN.
It's your ISP when the problem affects every device at a site and continues on a wired connection. A clean backup connection, or a traceroute showing degradation that starts at your ISP's first hops (inside its AS number), confirms it. Run these checks before you open a ticket. Ruling out your own network first saves a round of back-and-forth with level 1 support, which will ask the same questions anyway.
1. Test Multiple Devices, Wired
Check a few devices at the same site, including at least one plugged directly into the router or a switch. A problem on one device or only on Wi-Fi is local: a driver, an access point or interference. A problem on every wired device points upstream.
2. Compare Sites and Connections
If you have other offices, branches or remote users, compare them. One site degraded while the others run normally narrows the issue to that site's connection. Several sites on the same provider degrading at the same time points to the provider's network. Several sites on different providers degrading together points to the destination, such as a SaaS app or a cloud region, rather than any one ISP.
3. Check Your Edge Devices
A firewall running at high CPU, or a WAN link saturated by backups or updates, produces the same symptoms as an ISP problem: loss, latency and slow transfers. Check CPU usage, memory and interface utilization on your firewall and router before blaming the provider. While you're there, check the modem's status lights and line stats, and confirm the cabling between the modem and your edge device.
4. Restart the Modem, Router and Firewall
A power cycle clears stuck sessions, full NAT tables and modem sync problems. If performance recovers and stays stable, the cause was local. If it returns within hours, note the timing: a recurring pattern is useful evidence later.
5. Fail Over to a Backup Connection
If the site has a second ISP, LTE failover or a dual-WAN setup, move traffic to it. A clean backup connection while the primary stays degraded is one of the strongest signs the problem sits with the primary provider.
6. Bypass Your ISP's DNS
If sites hang before loading but connections by IP address work, point a test machine to a public resolver. If the problem disappears, it's the ISP's DNS servers, not the connection.
7. Check Your Provider's Status Page and Outage Reports
Look at the provider's status page and outage trackers like Downdetector. A spike in reports in your area confirms a wider outage. No reports doesn't clear your ISP, though: problems limited to your circuit or your local loop rarely show up there.
8. Run a Traceroute
A traceroute shows whether degradation starts inside your network (the first hop or two) or past your edge router. If it starts within your ISP's hops (just past your edge router, inside the ISP's AS number), continues to the destination, and the checks above came back clean, you're dealing with an ISP issue. Degradation that only starts at a later AS number change points to an upstream provider, a peering point or the destination instead. The next step is to measure it properly and build the evidence your provider needs. The tools section covers how to read traceroutes without falling for false positives.
What Are the Best Tools for Identifying ISP Issues?
The four core tools are speed tests, ping, traceroute and continuous network monitoring. The first three are free and built into most operating systems, but they only show what's happening at the moment you run them. ISP issues are often intermittent, so continuous monitoring is what catches the problem while it's happening and gives you a record to show your provider.
1. Speed Tests
A speed test measures download speed, upload speed and latency, and checks whether you're getting the bandwidth in your plan. It's a good first check for throttling or a connection running well below its rated speed.
Speed tests have two blind spots:
- They're a snapshot. A test run at 2 pm says nothing about the loss that hits at 10 pm.
- Many test servers sit inside or next to your ISP's own network. A clean result can hide degradation further along the path, at the handoff to other providers or toward the cloud apps your users depend on.
Run tests wired, at different times of day, and against more than one server.
 Screenshot from Obkio's Speed Test Feature
2. Ping
A ping test measures round-trip latency and packet loss toward a single destination. To use ping for ISP troubleshooting, compare two targets at the same time: your ISP's first hop (the gateway just past your router) and a destination outside the provider's network, such as a public DNS resolver or a cloud endpoint.
If both show loss, the problem is at or before the first hop: your edge, the local loop or the provider's access network. If only the outside destination shows loss, it's further along the path. If only the ISP's first hop shows loss and the outside destination is clean, that's the gateway rate-limiting ping replies, not real loss.
3. Traceroute
A traceroute lists every hop between you and a destination, with the latency and loss at each one. It's the tool that shows where in the path a problem starts. It's also the one most often misread in ISP tickets.
The most common mistake is reading loss at a single hop as a fault. Many routers deprioritize or rate-limit replies to traceroute and ping probes, whether or not they're busy, because forwarding traffic matters more to them than answering probes. That creates loss or a latency jump at one hop that doesn't continue to the hops after it. That's not real loss. Real loss starts at a hop and carries through every hop after it, all the way to the destination. ISP support teams know this, and tickets built on single-hop loss get closed fast.
Two other things to keep in mind:
- One direction only. A traceroute shows the forward path, and the return path can be different. Degradation the traceroute can't explain may sit on the way back.
- AS numbers mark provider boundaries. When loss begins where the AS number changes, the problem is likely at the interconnection between two providers. That's the detail that gets a ticket routed to the right team.
Command-line traceroute has the same snapshot problem as speed tests. By the time you run it, an intermittent issue may be gone. See traceroute vs. ping for how the two work together.
4. Continuous Network Monitoring
Continuous monitoring runs these measurements around the clock, so you have data from the exact moment an issue happened, not from 20 minutes later when someone gets to a terminal.
With Obkio's Network Monitoring & Diagnostics solution, Monitoring Agents are deployed at each site.
They exchange synthetic traffic with each other and with public agents hosted in AWS, Azure and Google Cloud, measuring latency, packet loss and jitter continuously. Visual Traceroutes run alongside those tests, so when an alert fires, the path data for that same time window is already there. That includes the hop where degradation begins and the AS numbers along the way.
That history is what turns "the Internet was slow last night" into a ticket your provider can act on: when it started, where in the path, and how bad it was.
How to Troubleshoot ISP Issues: Step-by-Step
To troubleshoot an ISP issue, you need to confirm it, measure its scope, rule out local causes, locate the hop where it starts, and send your provider evidence they can verify.
The steps below follow a real case: an alert at 10 pm, packet loss of 15% to 16% toward cloud destinations, and a root cause in the interconnection between two Internet providers.
Before you start:
- Agents at every site. Deploy a Monitoring Agent at each site you need visibility into: head office, branches, data centers. Hardware, software and virtual agents all work.
- Public agents in the cloud. Pair each site agent with public agents in AWS, Azure or Google Cloud, so every site has measured paths toward the Internet as well as between your own locations.
- Edge devices. Add Network Device Monitoring on your firewall and edge router. SNMP polling every 30 or 60 seconds catches CPU spikes and interface saturation that look like ISP problems.
- VPN, if you use one. Monitor both inside and outside the tunnel, so you can tell a VPN problem from an Internet one.

Step 1. Confirm the ISP Issue From the Alert
Start from the alert, not from a user complaint. An alert gives you a precise start time and the affected path, two things your ISP will ask for. In the case, an alert fired at 10 pm for packet loss on the head office agent's tests toward the Azure and AWS public agents.
Step 2. Measure the Scope and Pattern of the ISP Issue
Open the dashboard for the affected period, typically the last 24 hours, and answer four questions:
- Which destinations are affected?
- Which sites are affected?
- How long did it last?
- Does it repeat at the same time of day?
In the case, loss reached 15% to 16% toward both cloud destinations from the head office, while other sites stayed clean. Loss toward several unrelated destinations from one site points to that site's ISP path rather than to any single destination.
Step 3. Rule Out Local Causes With Obkio Insights
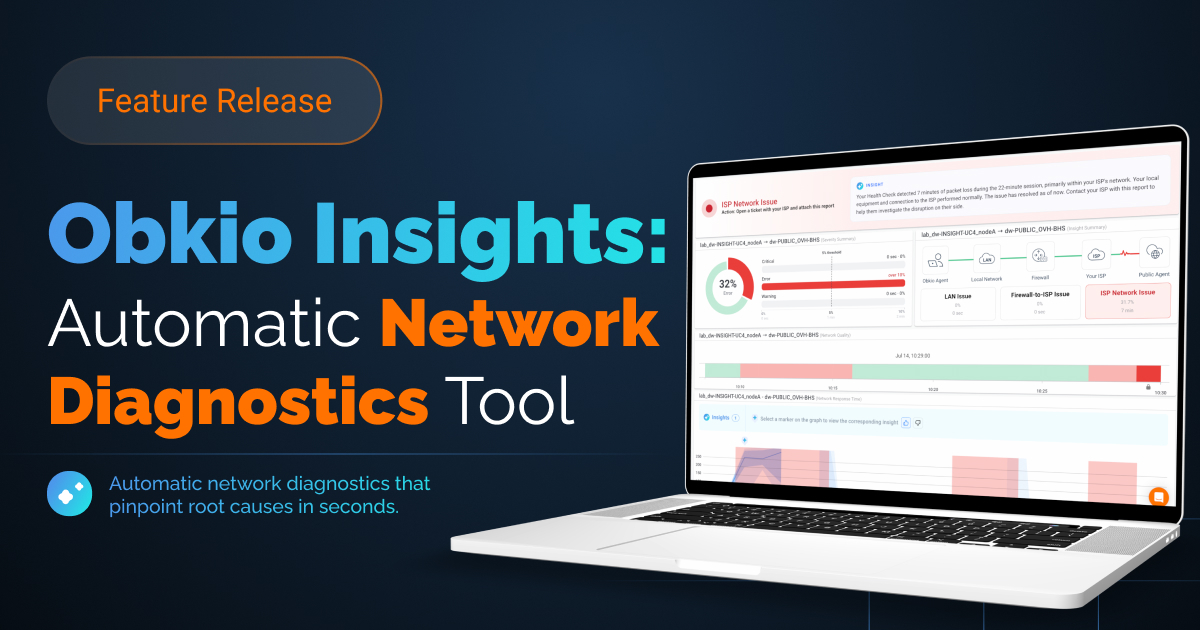
Before you build a case against your provider, make sure the cause isn't sitting at your own edge. Obkio Insights analyzes performance data automatically and surfaces the likely root cause behind an issue. It flags local causes, such as high CPU or memory on the firewall or a saturated link, alongside packet loss on the path itself.
If Insights points to a local cause, fix that first and the "ISP issue" may disappear. If not, you can tell your ISP you've ruled out your own equipment, and back it up.
Step 4. Locate Where the Problem Starts With Visual Traceroutes
Open the Visual Traceroutes for the affected agent:
- Select the problem period in the Quality Matrix, where red marks degraded quality.
- The Network Map then highlights the hops where performance dropped during that window.
Check that the loss is real: it should start at one hop and carry through every hop after it, all the way to the destination.
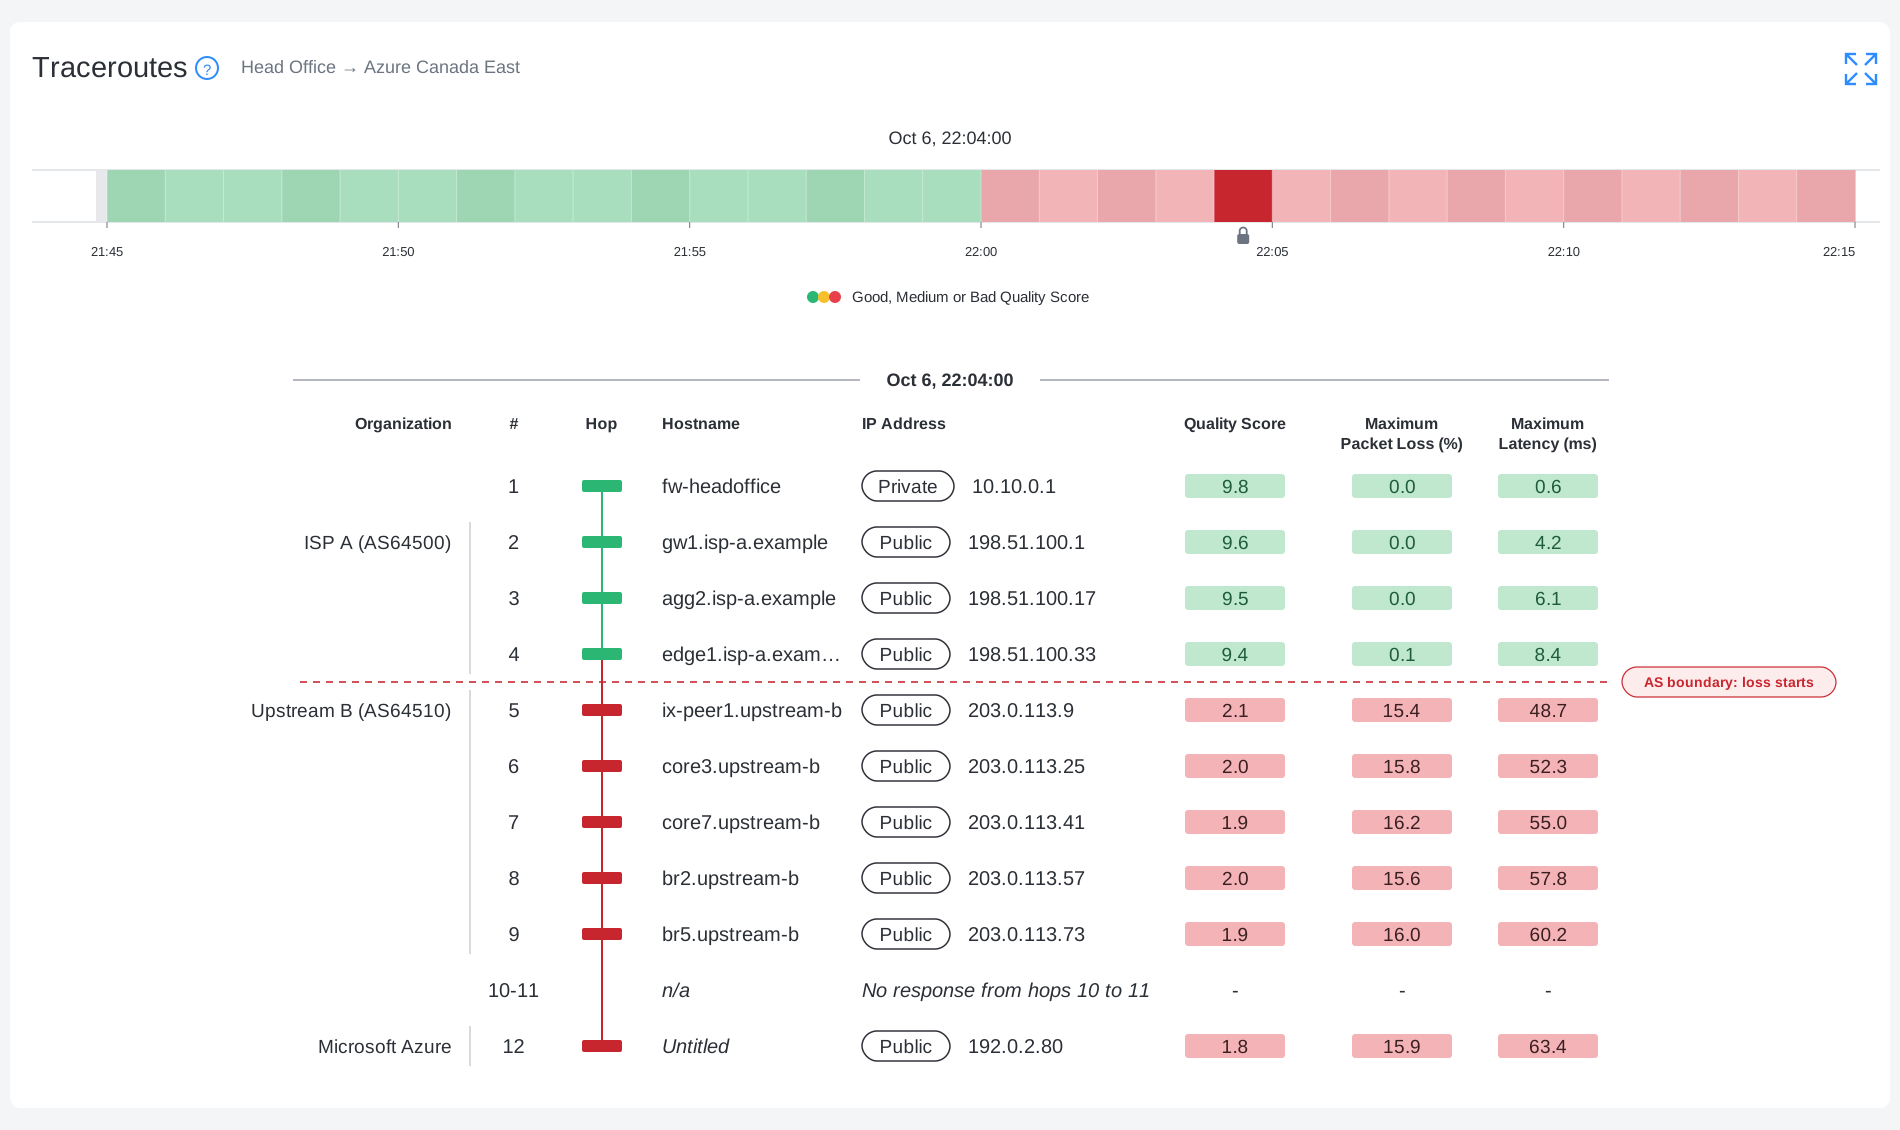
In the case, loss began between hops 4 and 5 and continued to the destination. Those two hops belonged to different AS numbers, which placed the problem at the interconnection between the customer's ISP and an upstream provider. That's outside the customer's network, and outside the part of the path a level 1 agent can see.
Step 5. Share the Evidence With a Shareable Link
Screenshots and exported reports freeze the data at one moment, and your ISP can't explore them. A Shareable Link gives your provider's support or NOC team direct access to the dashboards and traceroutes behind the issue:
- No account needed. They don't need an Obkio login to open it.
- Adjustable time range. They can change the time range to look before and after the incident.
- Expiry you control. You set when the link expires, up to two years.
Long expiry matters for slow escalations and SLA disputes. The same link stays valid across several ticket rounds, and keeps showing new data if the problem returns.
See this example of a shared link showing an IPS issue.
Step 6. Open the Ticket and Escalate
Open the ticket through your provider's business support line, not the residential queue. A ticket that gets past level 1 includes:
- When the problem started, with times and time zone
- The affected site and circuit ID
- The destinations tested
- The metrics observed
- The hop and AS number where degradation begins
- The local causes you've ruled out
- The business impact
Add the Shareable Link, and ask for the case to go to the team that handles routing and peering issues.
How to Work With Your ISP (and Your SLA) to Fix ISP Issues
Your Service Level Agreement (SLA) defines what your provider has committed to: typically uptime, latency, packet loss and repair times. It's your leverage when a problem drags on. To use it, you need to know what it actually measures, and data that lines up with those terms.
Read What the SLA Actually Measures
SLA numbers are only meaningful next to the definitions behind them. Check four things in your contract:
- Which metrics are covered. Many business SLAs cover availability and repair time but say nothing about packet loss or jitter.
- Where they're measured. Providers often measure within their own network, between their points of presence, not from your site to the Internet. A peering problem like the one in the case can degrade your traffic without breaching an SLA measured that way.
- What's excluded. Maintenance windows, customer-side equipment and "force majeure" events usually don't count.
- How to claim credits. Most contracts set a deadline for reporting a breach, and missing it forfeits the credit.
It also helps to translate uptime percentages into time. 99.9% uptime allows about 43 minutes of downtime a month. 99.99% allows about 4 minutes.
Compare Your Data Against the Commitments
Once you know the terms, compare your monitoring data against them for the same period and the same segment of the path. You can also monitor your ISP's performance to compare against that.
A test between your site agent and the provider's first hop is the closest match to what most ISP SLAs cover. Tests toward cloud destinations show what your users actually experience.
When both are degraded, you have an SLA argument and a business-impact argument. When only the cloud path is degraded, you're likely dealing with peering or upstream routing. The SLA may not cover that, but your provider can still escalate it with the upstream network.
Keep a Running Record
Single incidents get closed. Patterns get attention.
Keep one Shareable Link per open issue, with an expiry that covers the life of the dispute. Your provider sees the same data every time they look, including any new occurrences.
For recurring problems, pair it with a monthly summary: how many incidents, total duration, and which hours and destinations were affected.
Know When to Escalate Further
If tickets keep closing without a fix, move up the chain. Ask your account manager for a technical review, request direct contact with the provider's NOC, and file SLA credit claims for every breach within the contract window.
If the record shows repeated breaches over several months, it also supports renegotiating your contract, adding a second provider or changing providers.

Learn about SLA monitoring & reporting using Network Monitoring to measure network, service performance, user experience & understand if SLAs are being met.
Learn more
ISP Issue Benchmarks: What's Normal vs. Problematic?
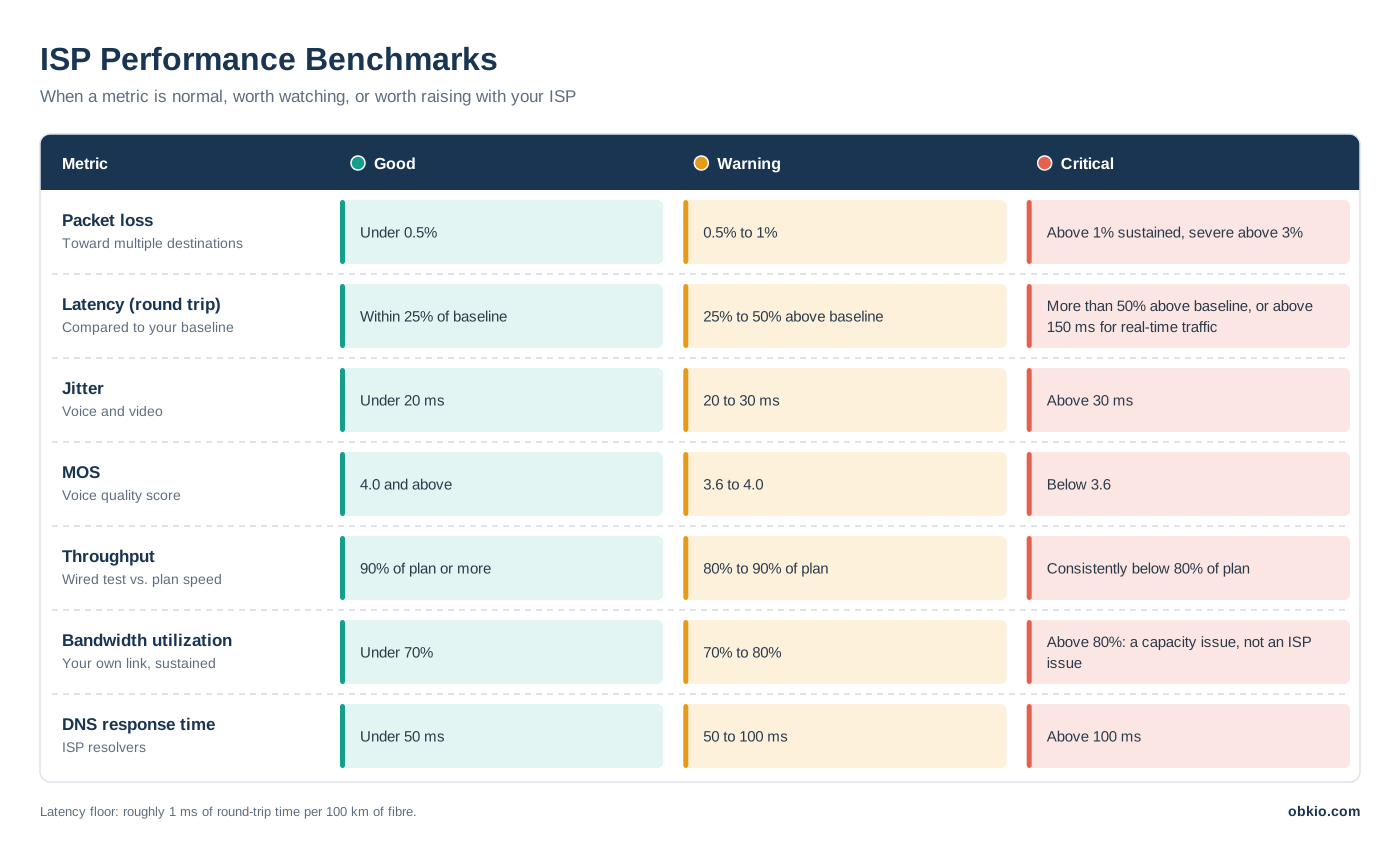
Use these thresholds to tell normal variation from a problem worth raising with your ISP. As a rule of thumb, sustained packet loss above 1%, jitter above 30 ms, or latency well above your baseline all point to an issue. They matter most when they hit every destination from the same site.
Packet Loss
Packet loss under 0.5% is normal. Between 0.5% and 1%, real-time traffic starts to suffer: an occasional clipped word on a call, a frozen frame on video. Sustained loss above 1% is worth investigating, and above 3% most applications degrade badly.
Check how many destinations the loss hits. Loss toward every destination from one site points to that site's ISP path, while loss toward one destination points to that destination's network. For more detail, see what counts as acceptable packet loss.
Latency
A single latency threshold doesn't work for every path. Judge latency against your own baseline and the distance the traffic travels. Light in fibre covers roughly 100 km per millisecond of round-trip time, so distance sets a floor no provider can beat. Montreal to Toronto has a floor of about 5 ms, and Montreal to London about 55 ms.
Latency within 25% of your baseline is normal. Between 25% and 50% above baseline is worth watching. More than 50% above baseline, sustained, points to inefficient routing or queuing on congested links. For real-time traffic, one-way latency above 150 ms (roughly 300 ms round trip, per ITU-T G.114) degrades calls and video regardless of distance.
Jitter and MOS
Jitter under 20 ms is good. Between 20 and 30 ms, voice quality starts to slip. Above 30 ms, calls sound robotic or cut out.
Read jitter alongside MOS (Mean Opinion Score), which turns network conditions into a voice quality score. A MOS of 4.0 or above is good, 3.6 to 4.0 is noticeably degraded, and below 3.6 users will complain. A falling MOS alongside rising jitter and low loss usually means congestion somewhere in the provider's network.

Throughput and Bandwidth Utilization
On a wired test, you should get at least 90% of your plan speed. Between 80% and 90% is borderline. Consistently below 80% is worth raising with your provider.
Check your own utilization before you do. Below 70% sustained is healthy, and 70% to 80% means you're approaching capacity. Above 80% sustained, the fix is more bandwidth or better traffic management, not a ticket. If speeds are slow while utilization stays low, the bottleneck is upstream, and that's an ISP issue.
DNS Response Time
ISP DNS resolvers should answer in under 50 ms. Between 50 and 100 ms, page loads start to feel sluggish. Above 100 ms, users notice delays before every new site or app connection. If switching a test machine to a public resolver brings response times down, the problem is your ISP's DNS.
Using Benchmarks to Prove ISP Issues
Thresholds turn “the Internet is slow” into a measurable claim. When you open a ticket, include three things:
- Your baseline from a known good period
- The measurements from the problem period that cross these thresholds
- The pattern behind them: time of day, destinations affected and duration
Then compare them against the commitments in your SLA. Data presented this way is hard to dismiss and quick for a support engineer to verify.
Frequently Asked Questions About ISP Issues
How do I know if my ISP is causing Internet problems?
It's likely your ISP if the problem affects every device at a site, continues on a wired connection, and disappears when you fail over to a backup connection. A traceroute or continuous monitoring that shows degradation starting at your ISP's first hops (inside its AS number) and carrying through to the destination confirms it.
How do I check if my ISP is down?
Check whether every device at the site has lost Internet access while local devices stay reachable. Then restart your modem and router, test a backup connection if you have one, and check your provider's status page and outage trackers like Downdetector. Monitoring that shows 100% loss toward every Internet destination confirms an outage.
What are the most common ISP issues?
The most common ISP issues are outages, intermittent disconnections, packet loss, high latency, jitter, peak-hour congestion, throttling, routing and peering problems, and DNS failures. Each has a typical symptom, from choppy calls to sites that won't load, and a metric that confirms it. That metric is what your ISP will ask for in a ticket.
What is acceptable packet loss for an ISP connection?
Packet loss under 0.5% is normal for a business Internet connection. Between 0.5% and 1%, calls and video start to degrade. Sustained loss above 1% is worth investigating with your ISP, especially if it affects every destination from the same site. Above 3%, most applications degrade badly.
Why does a traceroute show packet loss at only one hop?
Loss at a single hop that doesn't continue to the hops after it is usually not real loss. Many routers deprioritize or rate-limit replies to traceroute probes, busy or not, because forwarding traffic comes first. Real loss starts at one hop and carries through every hop to the destination.
How do I check if my ISP is throttling my connection?
Compare wired speed test results against your plan speed at different times of day and for different traffic types. Throttling is a likely cause if one type of traffic is consistently slower while others run normally. The same goes if speeds drop well below your plan while your own bandwidth utilization stays low.
What information should I give my ISP when reporting an issue?
Include when the problem started (with time zone), the affected site and circuit ID, and the destinations tested. Add the packet loss, latency and jitter observed, and the hop and AS number where degradation begins. Finish with the local causes you've ruled out, the business impact, and a link to the monitoring data.
How do I get my ISP to escalate my ticket past level 1 support?
Give level 1 support evidence they can't resolve with a script: timestamps, the hop where degradation begins, and proof you've ruled out your own equipment. Ask for the case to go to the team that handles routing and peering. A live link to the monitoring data lets engineers verify the problem without asking you to reproduce it.
Can I get compensation for ISP downtime?
Often, if the downtime breaches your SLA. Check which metrics the SLA covers, where they're measured, what's excluded (such as maintenance windows), and the deadline for claiming credits. Document every incident with timestamps and monitoring data, and file credit claims within the window your contract sets.
What does 99.9% uptime mean?
99.9% uptime allows about 43 minutes of downtime in a 30-day month, or roughly 8.8 hours a year. 99.99% uptime allows about 4 minutes a month. When comparing SLAs, check how the provider measures uptime and what's excluded, since maintenance windows usually don't count toward the total.
When should I switch ISPs?
Consider switching if you see repeated SLA breaches over several months, throughput consistently below 80% of your plan, recurring outages, or tickets that keep closing without a fix. Before you do, build a record of incidents over at least a month. That record supports renegotiation and credit claims, and can strengthen your position if you need to exit the contract.
Proactively Address ISP Issues with Obkio
ISP issues are easiest to fix when you catch them as they happen and can show exactly where they start. Waiting for users to complain means troubleshooting from memory, and ISP tickets built on memory rarely get past level 1 support.

Obkio's Network Monitoring & Diagnostics Tool covers the full process in this guide:
- Monitoring Agents measure packet loss, latency and jitter continuously between your sites and the Internet.
- Obkio Insights surfaces the likely root cause, so you know whether to look at your own edge or call your provider.
- Visual Traceroutes pinpoint the hop and network where degradation begins.
- Shareable Links give your ISP's support team direct access to the evidence, no account needed.
The result is fewer tickets that go nowhere, faster escalation, and a record that holds your provider to its SLA.


