Table of Contents
Table of Contents
We’ve all experienced those frustrating moments when a network error code pops up unexpectedly, and you're forced to stop everything you're doing. We all hate to see a 404 (Not Found) or 500 (Internal Server Error) network error coming.
Whether it’s sluggish connections, dropped calls, or websites refusing to load, the instinct is often to try quick fixes, browse a few “how-to” articles, or even just wait for the issue to pass. But that’s like trying to fix a car by randomly tightening bolts – it might help for a while, but without knowing what’s really wrong, you’re not getting to the root of the problem.
Effective troubleshooting starts with understanding what network errors you’re facing and why they’re happening. Just like a mechanic diagnoses the engine before making repairs, you need a clear understanding of your network's specific errors to keep things running smoothly.
This article walks you through the most common network errors and provides practical steps to identify and resolve them. By understanding how to troubleshoot network errors at the source, you’re not just patching up problems – you’re creating a stronger, more resilient network.
A network error is a problem that stops data from moving smoothly across a network, disrupting communication between devices, applications, or services. These issues can range from small delays that slow down your connection to serious failures that block data completely.
Understanding network errors is important for keeping a network running smoothly. For both businesses and remote workers alike, a reliable network is essential for productivity and a good user experience. When network errors happen, they can cause slow connections, dropped calls, or failed data transfers. This can be especially frustrating for real-time activities like video calls, online meetings, and cloud-based work, where a stable connection is crucial.
Troubleshooting network errors is key to solving problems quickly. By finding and fixing issues as soon as they appear, IT teams can prevent bigger disruptions and keep everything running smoothly. This approach helps businesses avoid downtime, keeps users happy, and ensures that operations continue without interruptions.
Unravel the intricacies of network error rate, its impact, and best practices. Elevate your network with insights and Obkio's NPM tool. Explore now!
Learn more

Modern technology and the rise of hosted services have transformed network and application infrastructures, providing unmatched functionality. However, this shift has also increased our reliance on well-functioning networks to support these essential applications. When network problems arise, the effects can be severe and tricky to resolve.
Here are key reasons why network errors are unavoidable:
- Complexity: Business networks involve numerous devices, servers, and software working together. This complexity increases the chances of issues, as even a minor misconfiguration can trigger problems.
- Human Error: Mistakes happen, from configuration errors to accidentally disconnecting cables. Even skilled IT teams aren't immune to the occasional slip-up.
- Constant Changes: Networks constantly evolve with new devices, updates, and user demands. Each change can introduce compatibility issues or security gaps that need addressing.
- External Factors: ISP outages, severe weather, and cyberattacks can affect network performance. These events are often beyond a business’s control and can lead to sudden disruptions.
- Increased Network Traffic: Growth in user activity places higher demands on network capacity, leading to potential slowdowns and bottlenecks.
- Aging Hardware: Network equipment ages and becomes more prone to failures. While maintenance can help, eventual replacement is necessary to prevent issues.
- Security Threats: Cyberattacks and breaches, such as malware or DDoS attacks, remain constant threats that can disrupt network operations and cause downtime.
Here’s a closer look at how these problems can affect users and organizations:
1. Slow Connections
Network errors often lead to slow connections, increasing latency – the delay between sending and receiving data. This can make apps take longer to load and respond. For example, using an ERP system to access real-time business data might become sluggish, delaying decision-making processes. Similarly, web-based platforms like Google Drive or Salesforce can feel unresponsive, frustrating users and slowing down workflows.
2. Poor Quality for Real-Time Apps
Real-time applications such as Zoom, Microsoft Teams, Google Meet and other VoIP services rely on a stable connection to function properly. Network errors can lead to choppy audio, frozen video feeds, and dropped calls, making effective communication difficult. In an important meeting or client presentation, these issues can disrupt the flow and reduce the professionalism of the interaction.
3. Inconsistent Data Transfers
Network errors can also cause problems with data transfers, leading to incomplete or failed uploads and downloads. For example, sharing large files over email or transferring data through cloud storage services like Dropbox may result in interruptions. This can delay projects and require users to restart or resend data, wasting valuable time.
4. Reduced Productivity
Ultimately, network errors affect overall productivity. When employees can’t access their tools or experience delays, it slows down work processes. For instance, a team relying on an ERP system for inventory management may face delays that impact order processing. Customer service representatives using CRM software could experience hiccups that make it hard to pull up client data during calls, leading to longer wait times and dissatisfaction.
Network errors can be frustrating and disruptive, and while you might notice the symptoms – slow connections, poor-quality calls, or interrupted data transfers – simply Googling solutions and relying on standalone tools like Traceroutes or Ping often leads to wasted time and confusion. Even if you manage to identify a potential cause, you may not get to the root of the problem, and as a result, the issue will not be properly resolved.

This is where a real-time network performance monitoring tool like Obkio comes in. It provides complete visibility into your network from LAN to WAN, showing you not just the when and where of network issues, but also the why.
By pinpointing the exact cause of a problem — whether it's in your local network or your service provider's WAN infrastructure — you can quickly identify who's responsible for fixing the issue. This enables you to troubleshoot faster, ensuring your network runs smoothly without prolonged disruptions.
Here’s how Obkio helps you identify and resolve network errors effectively.
Obkio is a straightforward SaaS solution designed to monitor and troubleshoot network performance. It helps you identify issues, collect performance data, and ultimately enhance the end-user experience. Whether you're dealing with connectivity, performance, VoIP, UC, or Internet issues, Obkio can help with it all.
Obkio uses Monitoring Agents and synthetic traffic to track performance in real-time. With just a few clicks, it identifies the root causes of slowdowns, whether they’re related to VoIP, video calls, or other applications, helping you troubleshoot faster and improve user experience.
Put It to the Test: The Best Way to Solve Network Errors is by Monitoring in Real-Time
Networks can be complex, but identifying and resolving network errors doesn’t have to be. With Obkio, network monitoring becomes simple and effective. You can monitor, measure, pinpoint, troubleshoot, and resolve network issues quickly, ensuring your network stays in top shape!

- 14-day free trial of all premium features
- Deploy in just 10 minutes
- Monitor performance in all key network locations
- Measure real-time network metrics
- Identify and troubleshoot live network problems

Obkio’s monitoring agents are deployed at strategic points throughout your network to track performance across various locations. By installing agents on devices like routers, switches, or end-user devices, Obkio continuously exchanges synthetic traffic to detect network errors quickly.
These agents can be installed at head offices, branch offices, data centers, or in the cloud for comprehensive monitoring. This way, you can monitor performance for everything from Internet connectivity to cloud apps like Zoom, AWS, or Microsoft services.
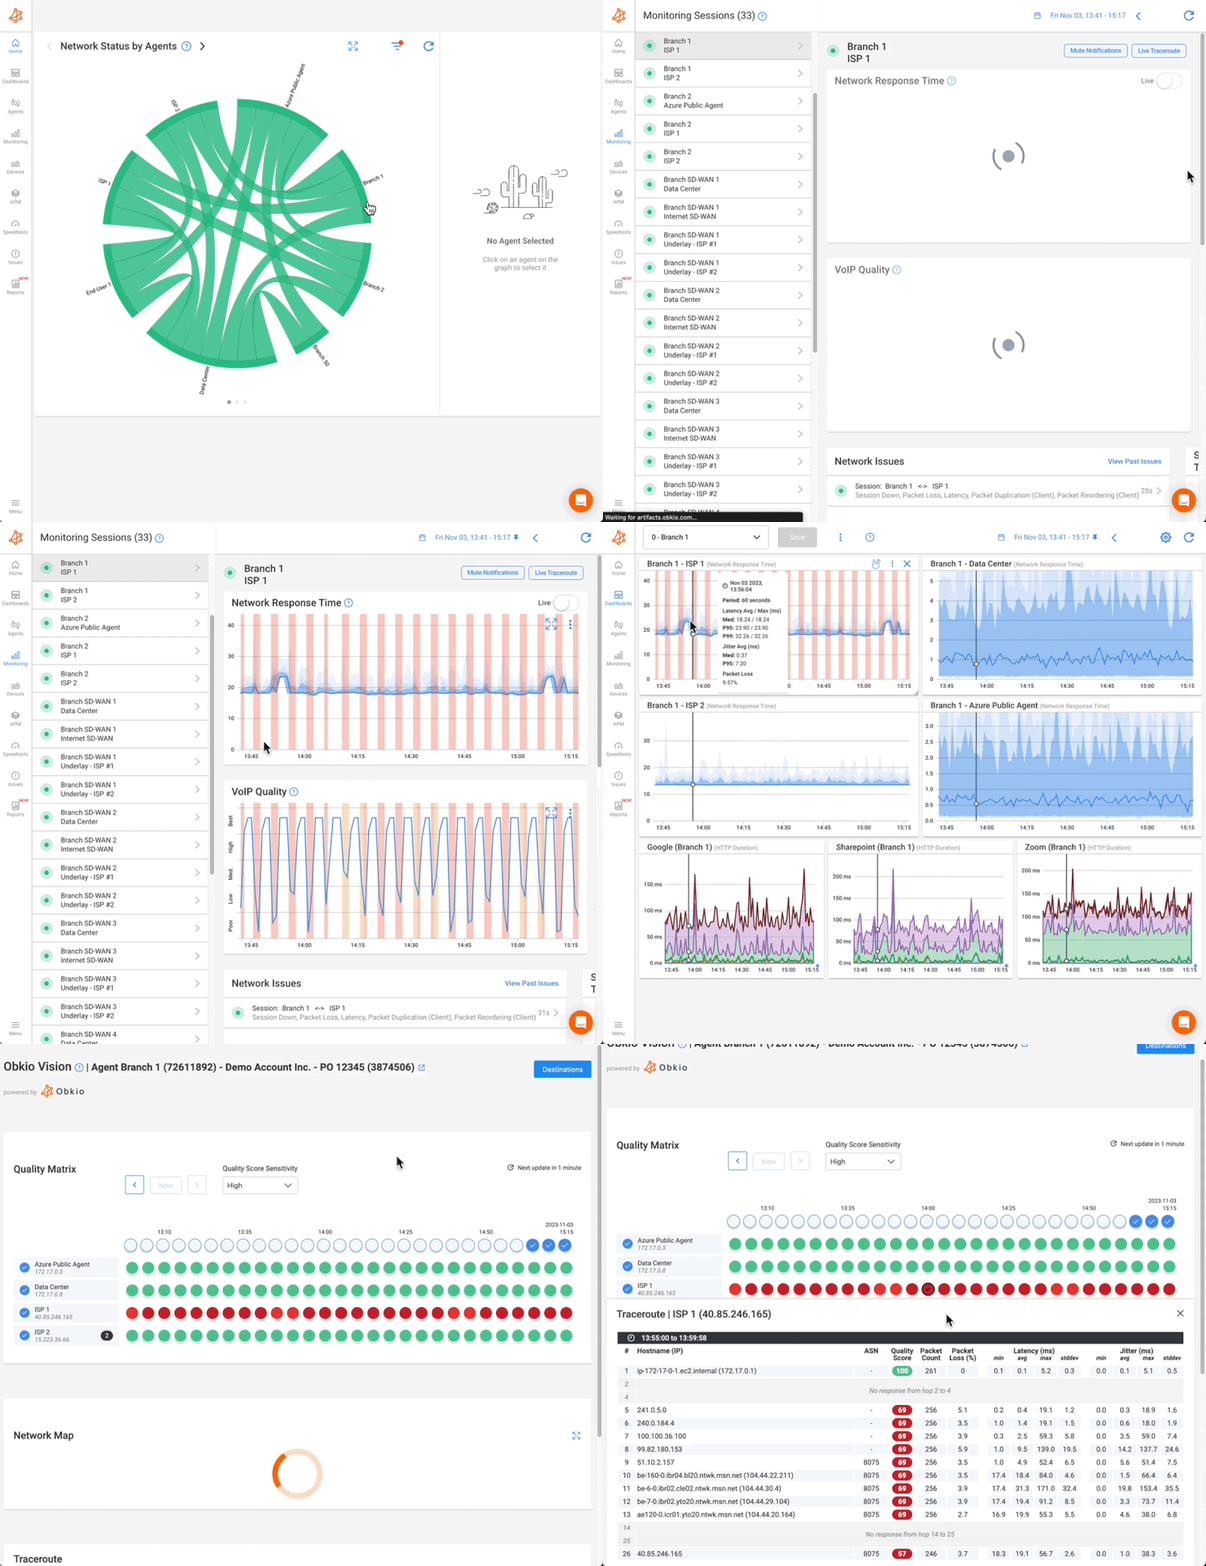
Network errors often lead to connection losses, slowdowns, and service disruptions, making it essential to monitor network performance metrics closely. Obkio’s agents measure critical network metrics such as latency, packet loss, bandwidth, DNS response times, and more. By constantly tracking these metrics, you gain real-time insights that help pinpoint network problems as soon as they arise.
Monitoring network performance metrics like latency, jitter, and bandwidth gives a clear picture of your network's health. When a network error occurs, these metrics can reflect the issue through increased latency, unexpected packet loss, or other disruptions. This is why it’s vital to track these metrics continually: they help diagnose and troubleshoot network issues before they impact performance and user experience.

By monitoring your network’s performance during regular operations, you can establish a network baseline using network metrics. These metrics help you spot any deviations from normal performance, allowing you to quickly identify when something isn’t right. You can also use these baselines to understand network errors that may have occurred in the past or are intermittent (happening sporadically and harder to catch in real-time).
Obkio will notify you immediately when it detects a deviation from your baseline performance, alerting you to a potential network error or performance issue so you can address it proactively.
Obkio allows you to configure alerts for specific network metrics. Set thresholds to receive notifications when performance metrics exceed predefined limits, ensuring you can address potential issues in real-time.
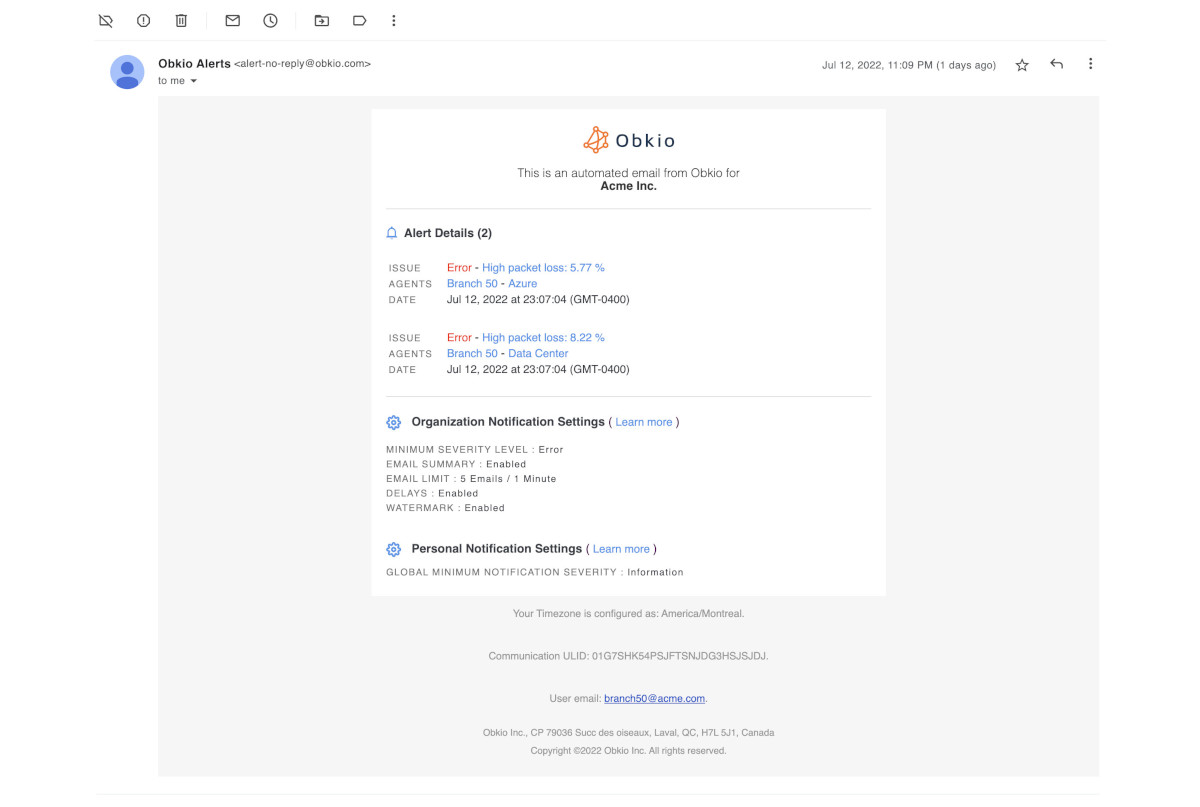
Once an alert is triggered, investigate the problem using Obkio’s real-time data and historical performance analysis. This lets you pinpoint the source of the problem and address it quickly, minimizing disruptions.
Obkio Vision runs continuous traceroutes to interpret network paths, making it easier to identify problems within your WAN and over the Internet. With tools like Traceroutes, the Network Map, and the Quality Matrix, Obkio Vision captures the final critical data needed to pinpoint the exact location of network issues.
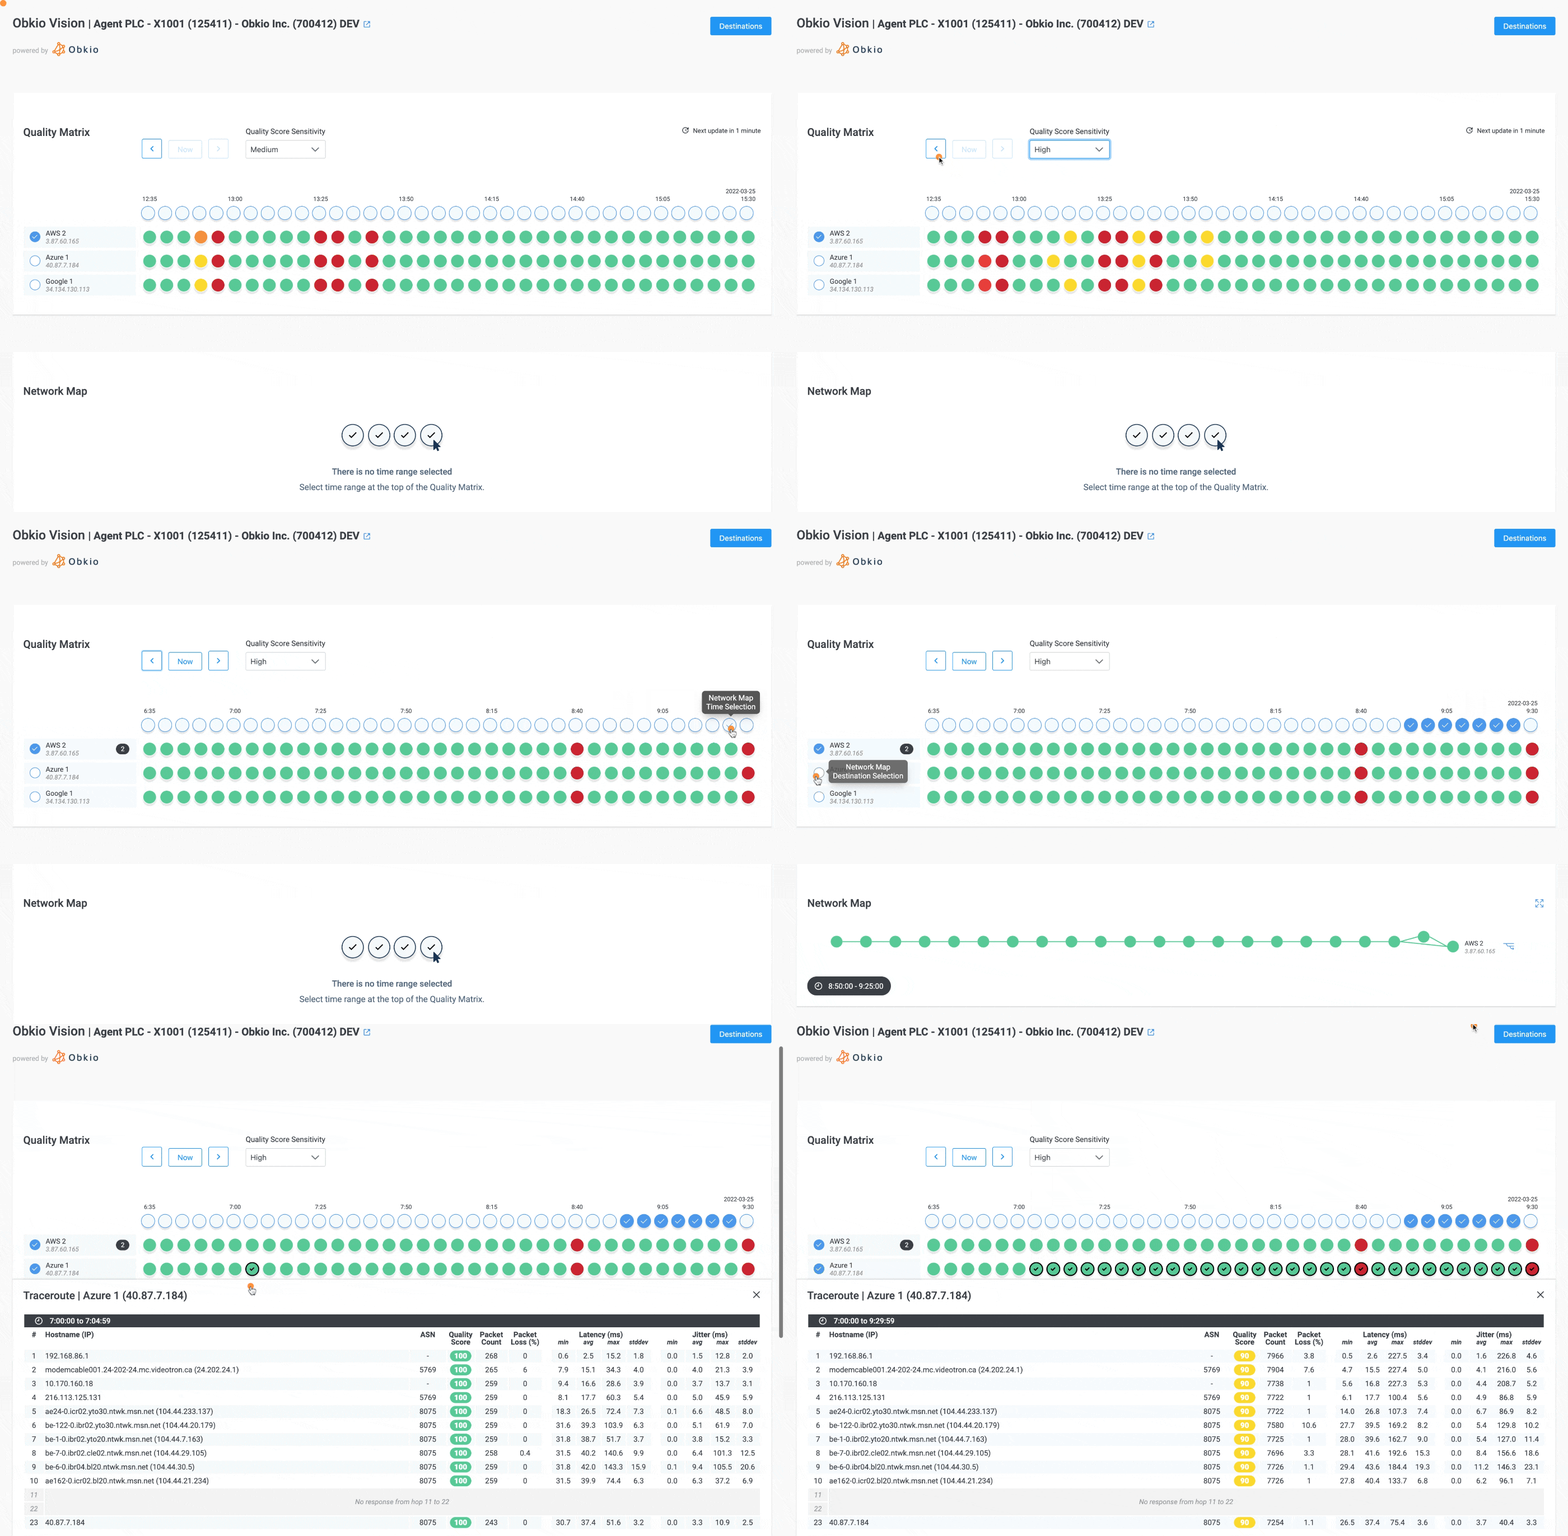
This information not only enables precise troubleshooting but is also shareable with your Service Provider for faster issue resolution. By continuously monitoring network paths, Obkio Vision helps you stay proactive in managing network performance.
Involve your IT team in troubleshooting using Obkio’s powerful visualizations and data. With Obkio, you can easily use collected data to address network errors caused by device or workstation issues within your network.
Additionally, Obkio’s advanced traceroute tool is invaluable for troubleshooting ISP or MSP issues – enabling you to identify when an issue originates from your provider’s network. This evidence can be used to open a service ticket with your ISP or MSP, helping to resolve external issues swiftly and collaboratively. Obkio makes it easy to coordinate, ensuring network problems are addressed effectively.
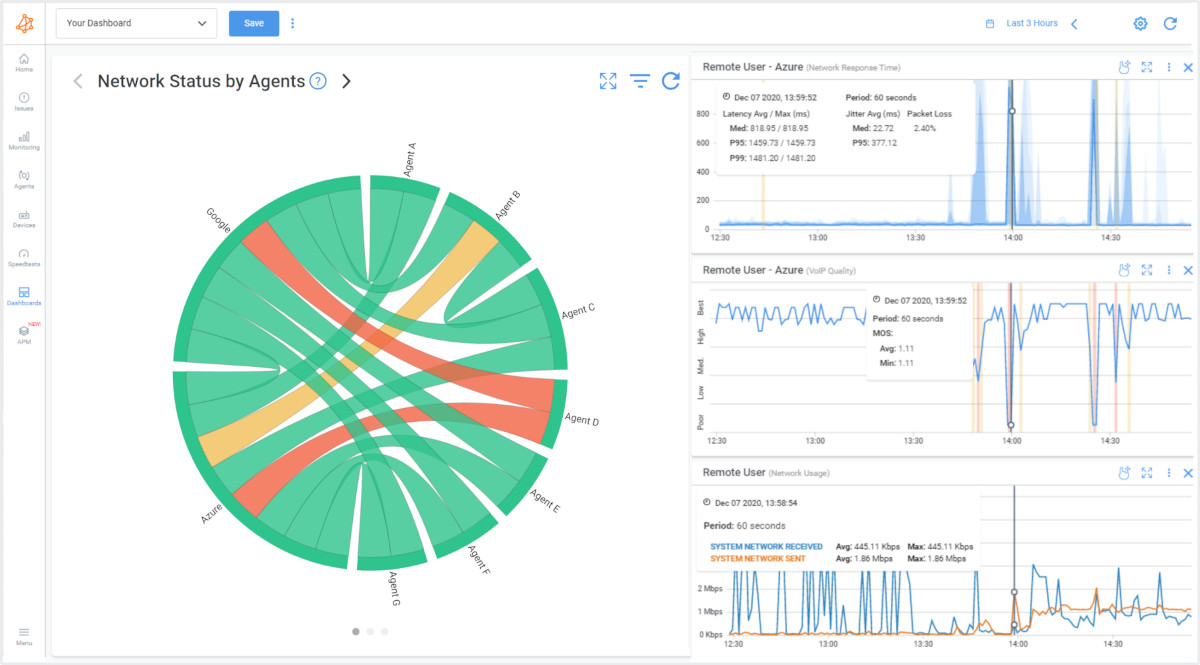
With Obkio, network errors no longer need to be a source of stress. By leveraging continuous monitoring, real-time alerts, and detailed data analysis, Obkio empowers your team to stay ahead of network issues, keeping your business running smoothly.

Network errors come in many forms, each with unique causes and effects. Understanding these common issues can help diagnose and resolve them effectively.

Here are some of the most frequently encountered network errors:
Packet loss occurs when packets of data travelling across a network fail to reach their destination. This issue can arise in any type of network, whether local or across the Internet, and can affect both individuals and businesses.
- Causes: Network congestion, faulty routers or switches, outdated firmware, interference in Wi-Fi connections, or damaged Ethernet cables.
- Impact: Leads to laggy performance in applications, especially for real-time services like video calls or online gaming.
- How to Identify: Use network monitoring tools or Packet Loss monitoring tools like Obkio to measure packet loss percentage, look for consistent buffering, VoIP call interruptions, or failed data transfers. Running
pingtests or traceroute commands can highlight the occurrence of packet drops.
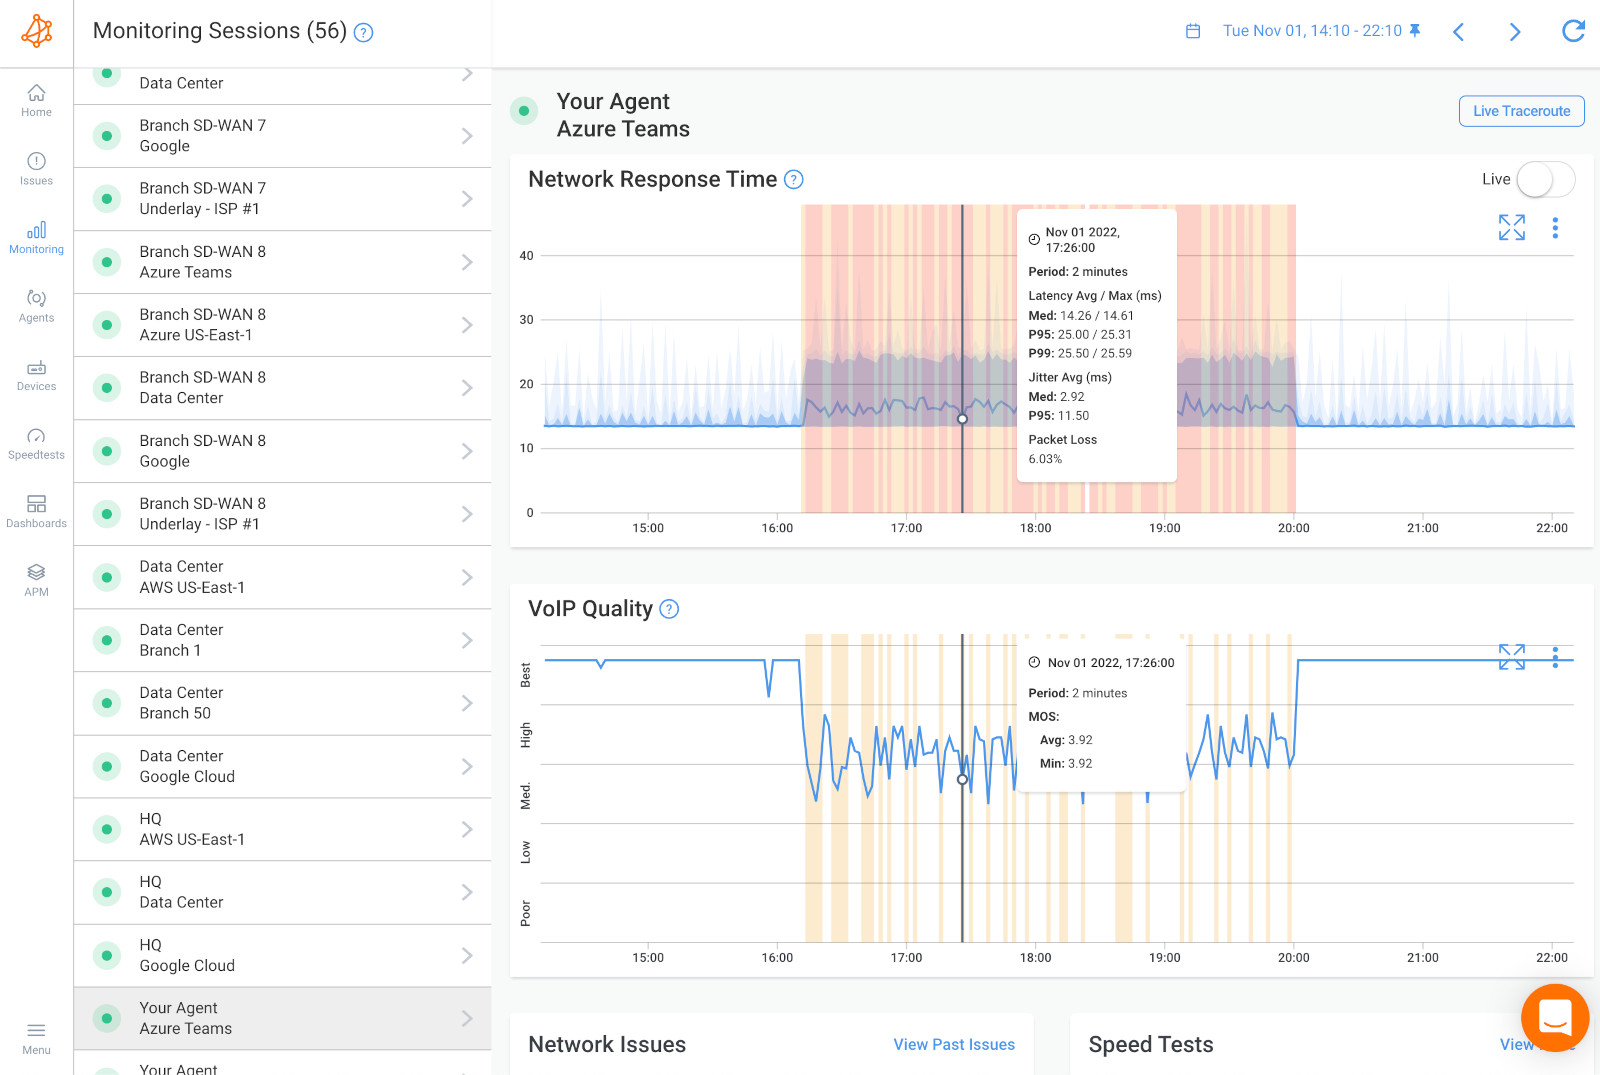
Latency refers to delays in data transmission across a network. It represents the time it takes for a packet of data to make a round trip from its source to its destination and back. High latency can impact both individual users and entire organizations, making online interactions feel sluggish and unresponsive.
- Causes: Network traffic spikes, insufficient bandwidth allocation, suboptimal routing paths, outdated network drivers, or connectivity through VPNs.
- Impact: Slows down response times, making apps like ERP systems and collaboration tools less efficient.
- How to Identify: Use latency measurement tools (e.g.,
ping,traceroute), or Network Latency Monitoring tools like Obkio to check round-trip time (RTT). High latency often appears as delays during data entry, saving large files, or slow responses in interactive applications.
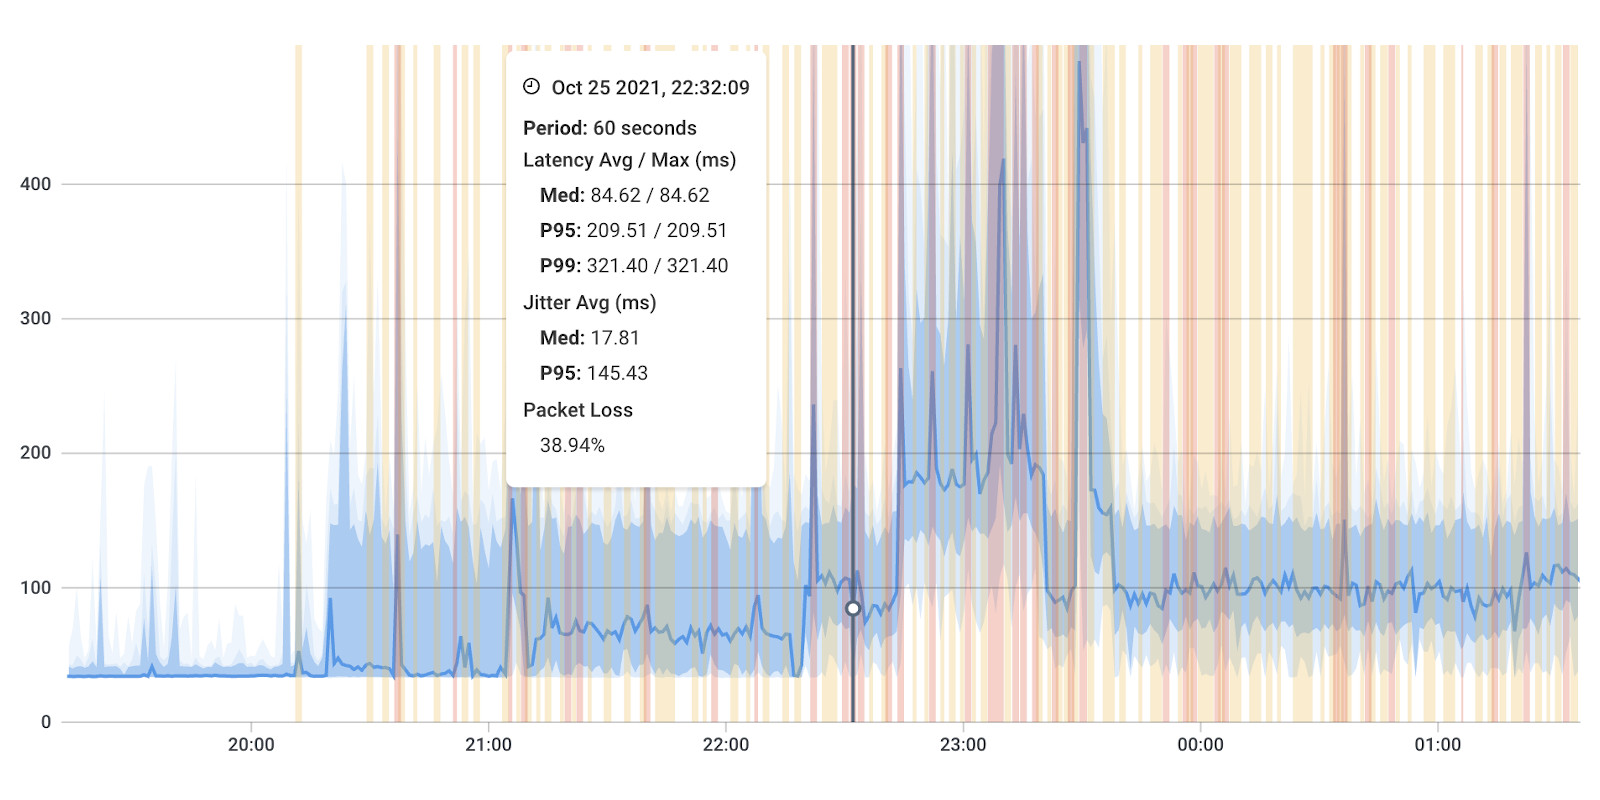
Jitter is the variation in packet arrival times, causing inconsistent data flow. Ideally, packets should arrive at regular intervals to maintain a smooth data flow. However, jitter results in packets arriving at uneven intervals, leading to disruptions in the quality of data transmission.
- Causes: Network congestion, poor quality of service (QoS) settings, inefficient network routing, or improper router configurations.
- Impact: Can distort audio and video quality in real-time communication platforms like Zoom and Microsoft Teams.
- How to Identify: Monitor the jitter value using tools such like Obkio's Network & Jitter Monitoring tool,
Jitterbugor VoIP testing apps. Variations exceeding 30 ms can indicate an issue, noticeable as stuttering or distorted video/audio during calls.

Bandwidth saturation happens when the network's available bandwidth is completely used up, leading to a bottleneck that slows down data flow for all connected devices and services.
- Causes: Simultaneous high data usage, multiple streaming devices, large file transfers, or excessive background updates.
- Impact: Slows down all connected services, affecting everything from file uploads to web browsing.
- How to Identify: Use Network Monitoring or Bandwidth Monitoring tools to monitor traffic usage. Signs include slow webpage loading, delayed email sending, and buffering in streaming apps. Check bandwidth usage through router management interfaces.
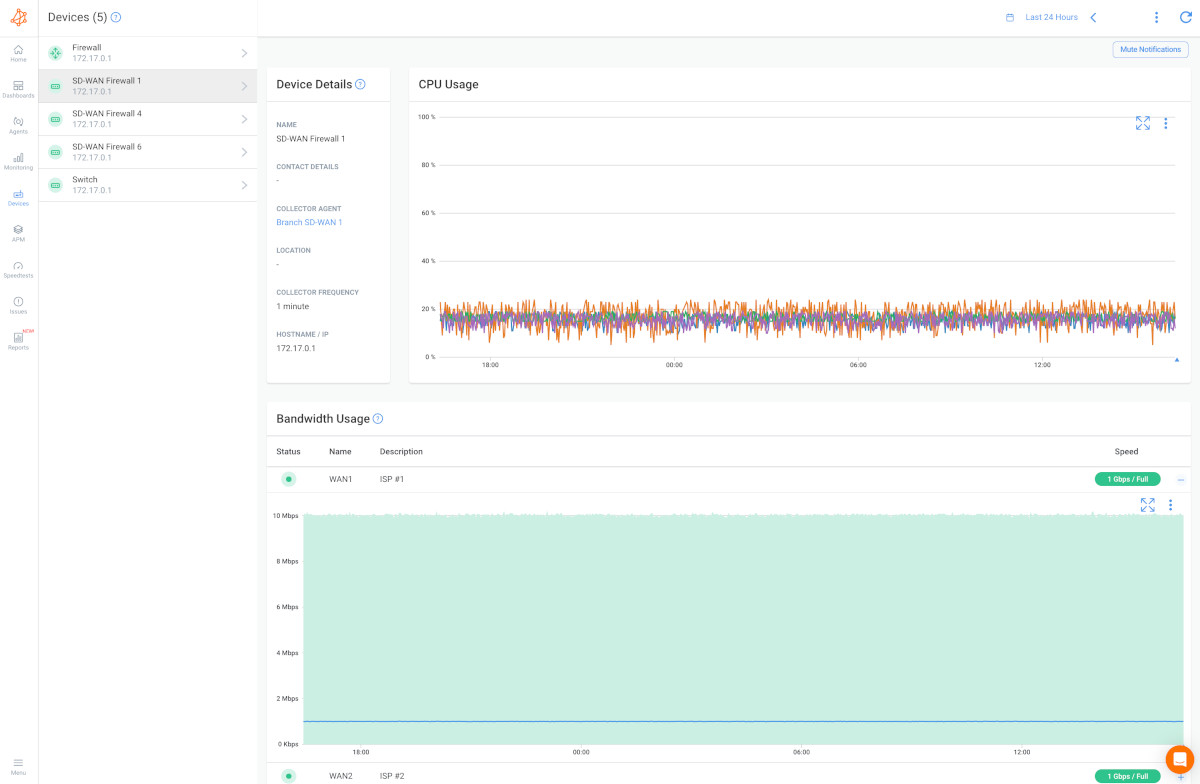
Collisions occur when two devices attempt to send data simultaneously over a shared network medium, resulting in interference and data being lost or needing retransmission. Collisions are more common in networks that still use half-duplex technology, where communication only happens in one direction at a time.
- Causes: Common in shared Ethernet networks that use half-duplex technology, outdated hubs instead of modern switches.
- Impact: This can cause delays and reduce overall network speed.
- How to Identify: Review network logs for collision counters. On older networks, unexplained delays and periodic connectivity issues often point to collision problems.
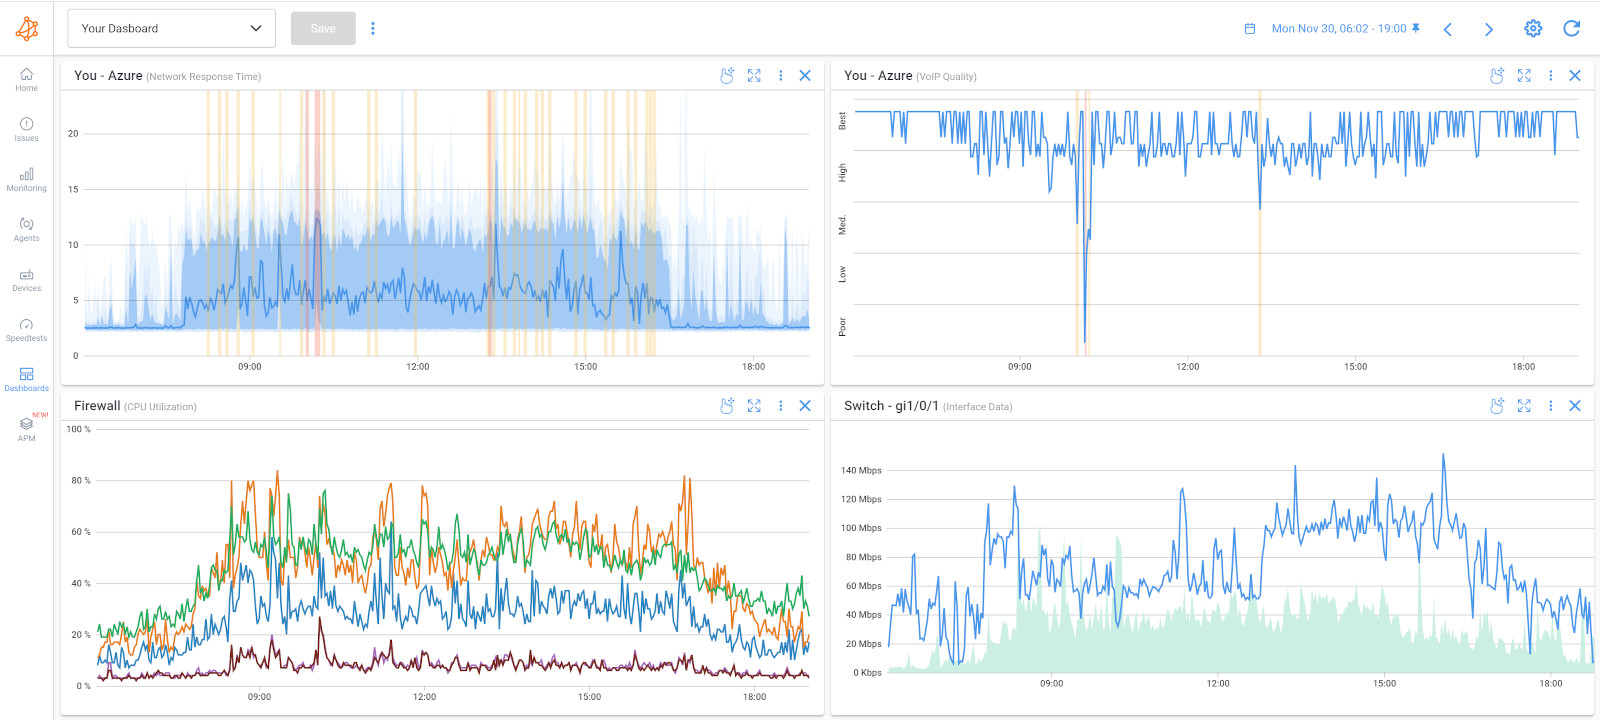
Transmission errors happen when data is incorrectly transmitted or becomes corrupted while travelling across the network, leading to problems with data integrity and communication reliability. These errors can affect the flow of information between systems and reduce overall network performance, especially when data packets are consistently affected.
- Causes: Physical layer issues like damaged cables, electromagnetic interference, or worn-out connectors.
- Impact: This leads to incomplete or corrupted data transfers, affecting file sharing and database synchronization.
- How to Identify: Inspect error rates in network logs or use diagnostics from network switches and routers. Transmission errors may show as missing or corrupted data in file transfers or synchronization failures.

Routing errors happen when data packets are sent through incorrect or inefficient paths, leading to delays and potential connection issues. These errors often happen when the network routing configuration is flawed, causing packets to follow suboptimal routes that can increase latency or even prevent data from reaching its destination.
- Causes: Misconfigured routing tables, unstable routing protocols (e.g., OSPF or BGP), or faulty firmware in routers.
- Impact: Increases latency and sometimes leads to dropped connections.
- How to Identify: Use route tracing tools to check the paths packets take. Errors manifest as prolonged delays or unreachable destinations when accessing certain network locations.
What is a DNS Network Error? DNS errors arise when there are issues resolving domain names to their corresponding IP addresses, making it impossible for users to access websites or online services. The Domain Name System (DNS) acts as the "phonebook" of the Internet, translating human-readable domain names (like www.example.com) into IP addresses that computers use to locate each other on the network. When DNS errors occur, this translation process fails, leading to issues accessing websites or services.
- Causes: Misconfigured DNS server settings, unreachable DNS servers, or outdated DNS cache.
- Impact: Users might not be able to access websites or services such as ERP tools or project management software.
- How to Identify: Run
nslookupordigto troubleshoot domain resolution issues. Typical signs include “Server not found” or “DNS server not responding” errors in web browsers.
A buffer overflow occurs when a buffer, which temporarily stores data for processing, exceeds its capacity, causing the system to malfunction. Buffers are designed to hold data while it's being transferred between devices or processes, but if they become overloaded, it can result in a failure to handle the incoming data properly. This can lead to data loss, corruption, or application crashes.
- Causes: Inadequate system resources, faulty software handling data input, or inefficient memory management.
- Impact: Leads to slow performance or application crashes.
- How to Identify: Review system logs or use performance monitoring tools to detect when memory usage exceeds capacity. Users may notice sluggish or crashing applications, especially during heavy data handling.
Learn how to troubleshoot network issues by identifying where, what, why network problems occur with Network Troubleshooting tools.
Learn more

Duplication errors occur when duplicate packets are received by devices on the network, leading to inefficiencies and wasted resources. This happens when a packet is sent more than once or is mistakenly retransmitted, causing redundancy in data flow that can affect network performance.
- Causes: Network misconfigurations, errors in routing protocols that resend packets, or loopback issues.
- Impact: Wastes bandwidth and can slow down application performance.
- How to Identify: Check network logs for duplicate packet entries. The signs include repetitive data in applications or increased bandwidth consumption without corresponding user activity.
Discover the secrets of packet duplication in networks, learn how to identify it, and unleash the power of Obkio's monitoring tool to tackle the issue.
Learn more

Network congestion happens when the volume of traffic on the network exceeds its capacity, causing delays and slowdowns across the entire system. When the network becomes overloaded, it struggles to handle the data being transmitted, which leads to bottlenecks and poor performance.

- Causes: High simultaneous traffic, overutilized access points, or insufficient infrastructure for current traffic levels.
- Impact: Degrades the performance of applications such as cloud-based platforms.
- How to Identify: Analyze traffic patterns using a network monitoring tool to track peak usage periods. Performance slowdowns across all services and increased latency in web or cloud-based applications are key indicators.

Fragmentation errors happen when data packets are broken down into smaller pieces for transmission but cannot be properly reassembled when they reach their destination. This can lead to incomplete or failed data transfers.
- Causes: Incorrect Maximum Transmission Unit (MTU) settings or incompatible network protocols that mishandle fragmented packets.
- Impact: Causes incomplete data transfers and reduced application efficiency.
- How to Identify: Use
pingwith the-f(Do Not Fragment) flag to check for MTU issues. Fragmentation problems often appear as failed large file transfers or interruptions during data-heavy operations.
If you want to learn more about other network problems, check out our article 16 Most Common Network Problems: How to Find & Fix Them. It explains different network issues and how to solve them step-by-step.
Learn about some of the most common network problems that businesses face every day, like high CPU, bandwidth, equipment issues, Internet failures, and more.
Learn more

Network error codes are warning messages that appear to alert you to an issue within your network. By the time an error code pops up, it's clear that something is wrong and needs attention. These codes are generated when a problem occurs in the communication between a client and a server, helping to diagnose what went wrong. Each code corresponds to a specific type of error, providing valuable information that can guide troubleshooting efforts.
While these error codes can vary between systems and devices, here are some of the most common network error codes you may encounter and what they mean:
This error occurs when the server cannot process the request due to malformed syntax. It may be caused by URL errors, missing data, or incorrect HTTP requests. A simple fix could involve checking for any typos in the URL or ensuring that the correct data is being sent.
The 401 error indicates that authentication is required, but the user is not logged in or authorized to access the requested resource. This could be due to missing or incorrect login credentials or attempting to access a restricted resource without proper authorization.
This error code means that the server understands the request but refuses to authorize it. It typically occurs when a user doesn’t have the necessary permissions to access a particular resource, such as trying to view a file or page that is restricted.
A 404 error is one of the most common and indicates that the server cannot find the requested resource. This is often caused by a mistyped URL, broken links, or removed pages. Double-checking the URL or searching for the correct page may help resolve this issue.
This error occurs when the server times out while waiting for the client’s request. It may be caused by a slow or interrupted network connection. In such cases, checking the network connection or trying the request again later can often resolve the issue.
A 500 error signifies that the server encountered an unexpected condition that prevented it from fulfilling the request. This can be caused by server misconfiguration, application errors, or overloaded servers. Contacting the server administrator or checking server logs may help to identify the root cause.
A 502 error occurs when one server receives an invalid response from another server acting as a gateway or proxy. This can happen when upstream servers are down, misconfigured, or experiencing issues. Resolving this may involve checking the status of the upstream server or addressing misconfiguration issues.
This error is typically seen when the server is temporarily unavailable, often due to maintenance or overload. It can be caused by server maintenance, temporary overload, or network congestion. Waiting a few minutes and trying again often resolves this error, but it’s essential to monitor the server for performance issues.
A 504 error occurs when a gateway or proxy server doesn’t receive a timely response from an upstream server. This can be caused by delays, network congestion, or connectivity issues. Ensuring proper routing and addressing any network issues can help fix this error.
P.S.
Network error codes usually appear only after you've already lost connection, making them hard to ignore. At that point, the network issue has likely impacted users, causing disruptions and frustration.
With a Network Monitoring Tool like Obkio, however, you can catch these issues in their earliest stages, spotting even minor signs of performance degradation before they escalate. This proactive approach means you can often detect network errors before they become a visible problem, allowing you to address them well before they hit your users head-on.*

Having covered the most common network errors, it's essential to have a clear and structured troubleshooting approach. When network errors appear, quick and systematic troubleshooting is crucial to reduce downtime, ensure smooth operations, and keep a reliable network infrastructure.
Effective troubleshooting begins by accurately identifying the problem, which involves asking who, what, where, and when.
Here’s a guide to troubleshooting network errors, step-by-step:
Start by assessing your network to gather a baseline of key information. Use a Network Monitoring tool like Obkio, which provides valuable insights into your network’s health, performance, and potential bottlenecks. This initial assessment lays the groundwork for effective troubleshooting and helps pinpoint the root causes of network issues.

Conducting a thorough network assessment provides essential insights into your network's health, performance, and any potential bottlenecks. This foundational step enables more efficient troubleshooting and helps pinpoint the root causes of issues.
Once you've gathered the necessary information, you can begin troubleshooting. This may involve reaching out to your ISP or MSP or working with your network administrator to resolve the problem internally.
Understanding the specific network error is critical for addressing it effectively. Network performance monitoring tools can identify issues, measure network metrics, and alert you to symptoms such as latency, packet loss, or connection errors.
- Gather information from users or network monitoring tools to determine the symptoms.
- Define the problem: for example, slow Internet speeds, intermittent connectivity, or service disruptions.
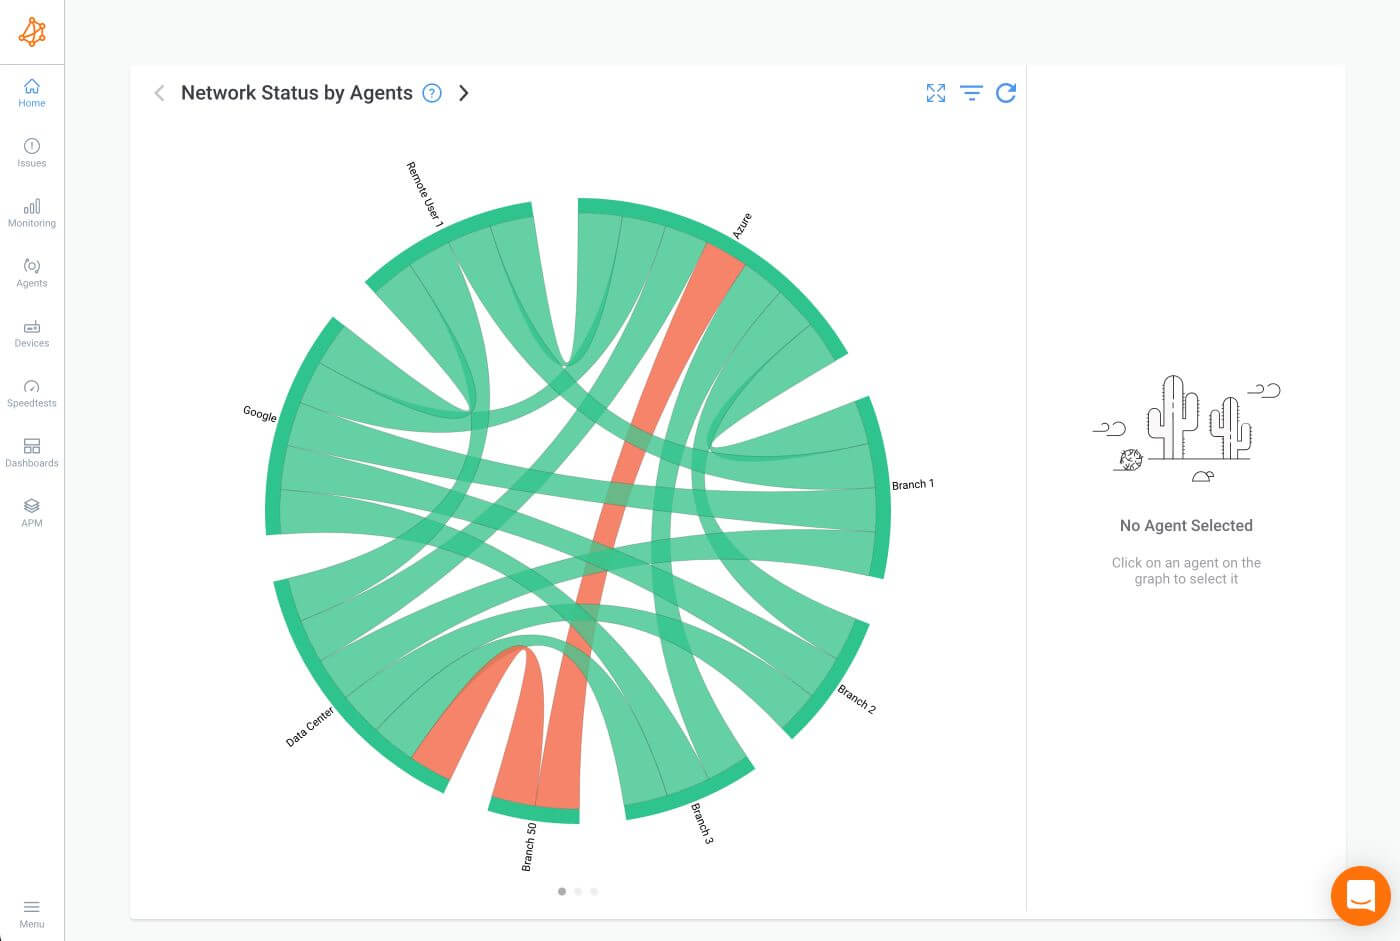
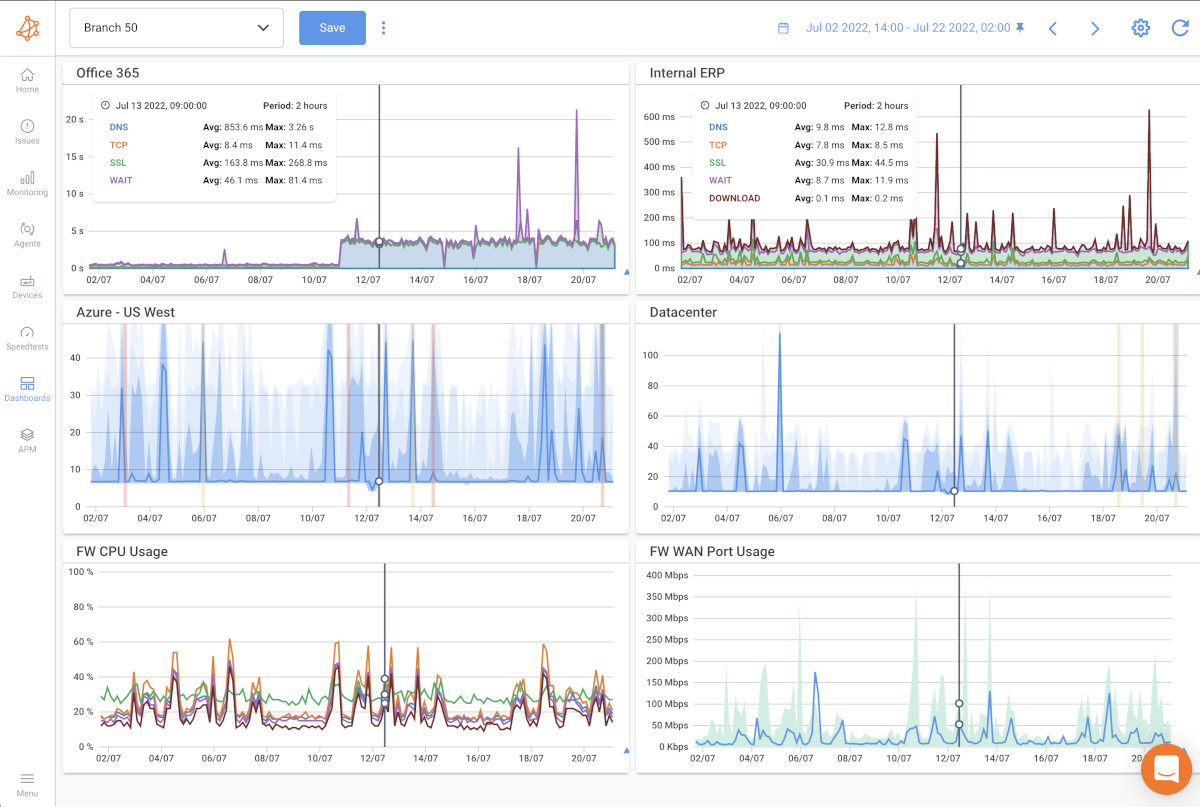
Pinpointing the exact location of a network issue is crucial. Obkio allows you to deploy Monitoring Agents at key network points for end-to-end visibility, providing detailed insights into where problems occur – whether in the LAN, WAN, or other segments.
- Identify affected network areas, devices, or services.
- Use monitoring tools to analyze and locate bottlenecks, high-utilization points, or error-prone devices.
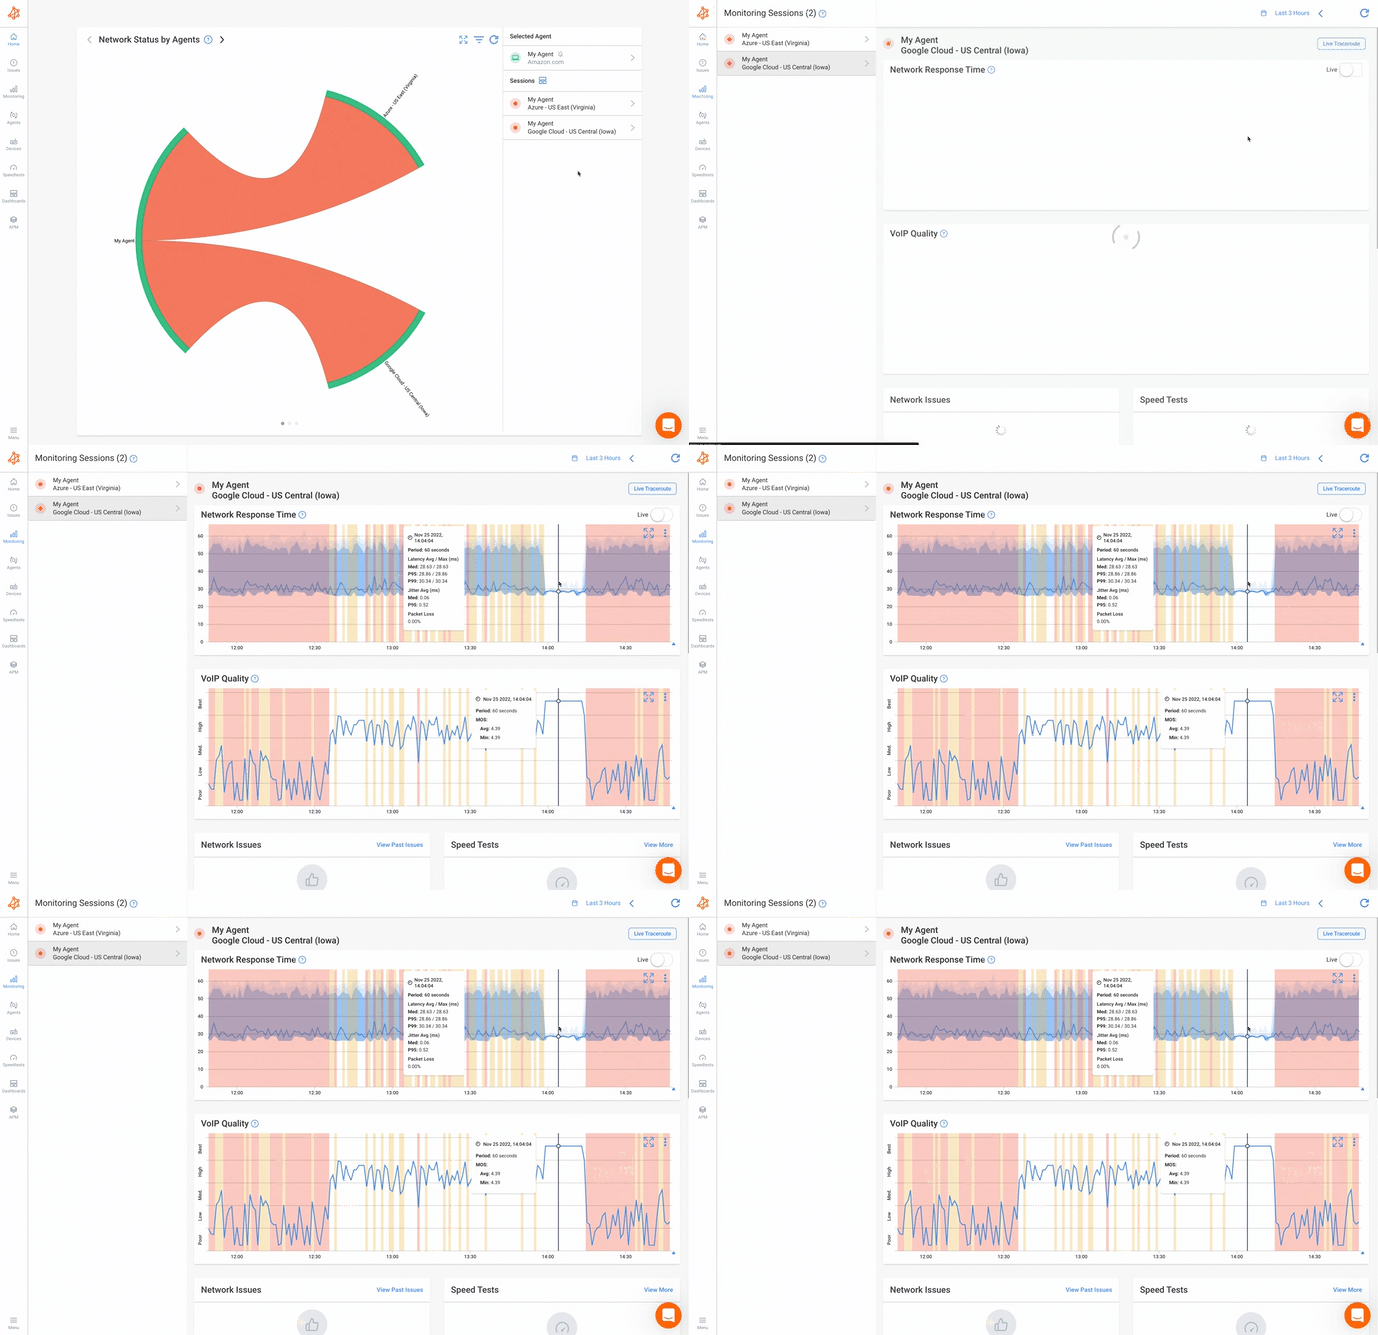 Screenshot from Obkio Network Monitoring Tool
Knowing when the issue started and if it’s recurring can provide context for finding solutions. Historical data from Obkio’s monitoring tool helps correlate problems with specific network events or changes.
- Identify when the problem started, correlating it with network changes.
- Use network logs to track patterns in issue recurrence or time-specific problems.
Understanding which users or network devices are impacted allows for a more targeted response. It helps in assessing the issue’s scope, whether limited to a few users or widespread across the network.
- Determine which users or devices are impacted to gauge the problem’s scope.
- For widespread issues, identify common factors among affected users, such as location or device type.
Knowing where and what the issue is can help you identify who is responsible for that network segment, facilitating a faster resolution.
- Identify the responsible team or individual for the affected network segment.
- This step streamlines communication and coordination, ensuring efficient troubleshooting.
Addressing network issues often involves immediate actions to resolve or narrow down the root cause, preparing for further troubleshooting.
- Perform basic checks like verifying cable connections, restarting devices, or checking for updates.
- Review any recent network configuration changes that may be contributing to the issue.
Narrow down the problematic area by isolating it to a specific network segment or component. This step reduces the potential causes and allows for more focused troubleshooting.
- Use monitoring features, like Obkio’s Network Device Monitoring, to check for device-related issues.
- Divide the network into smaller segments, testing each independently to locate the issue.
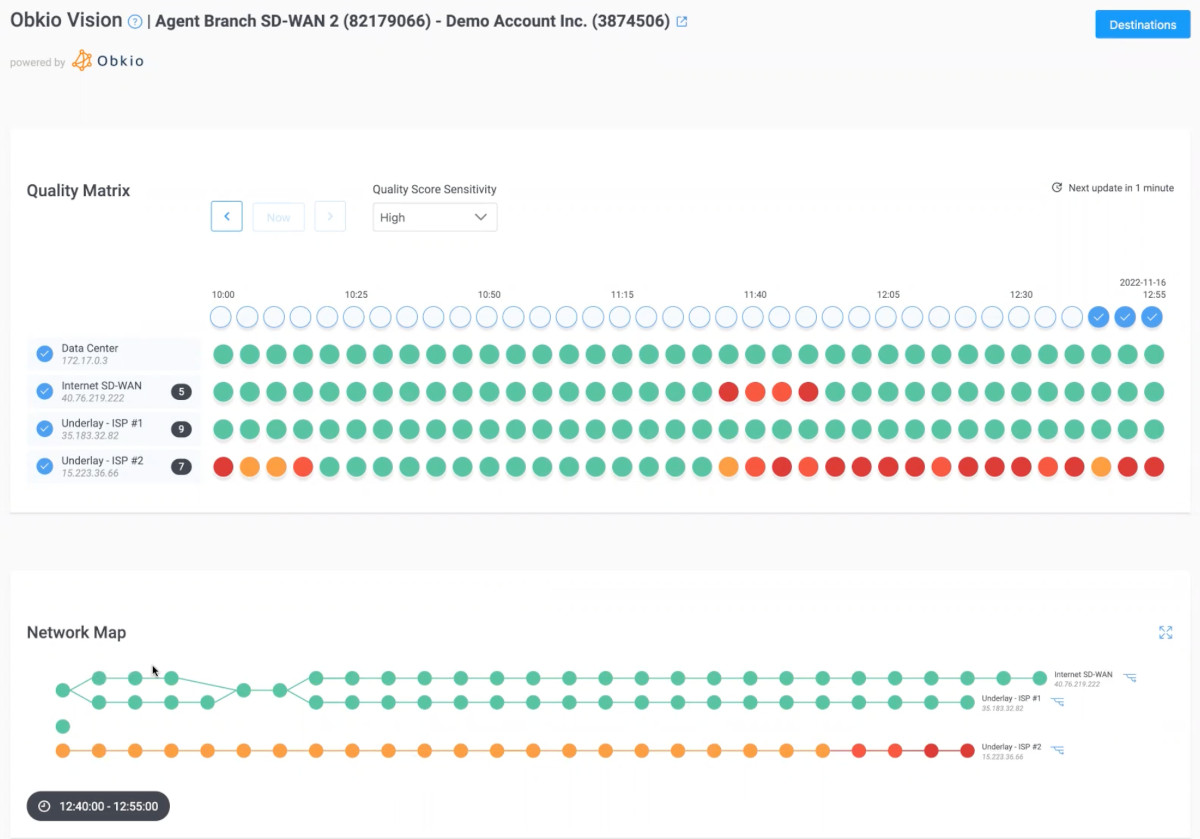
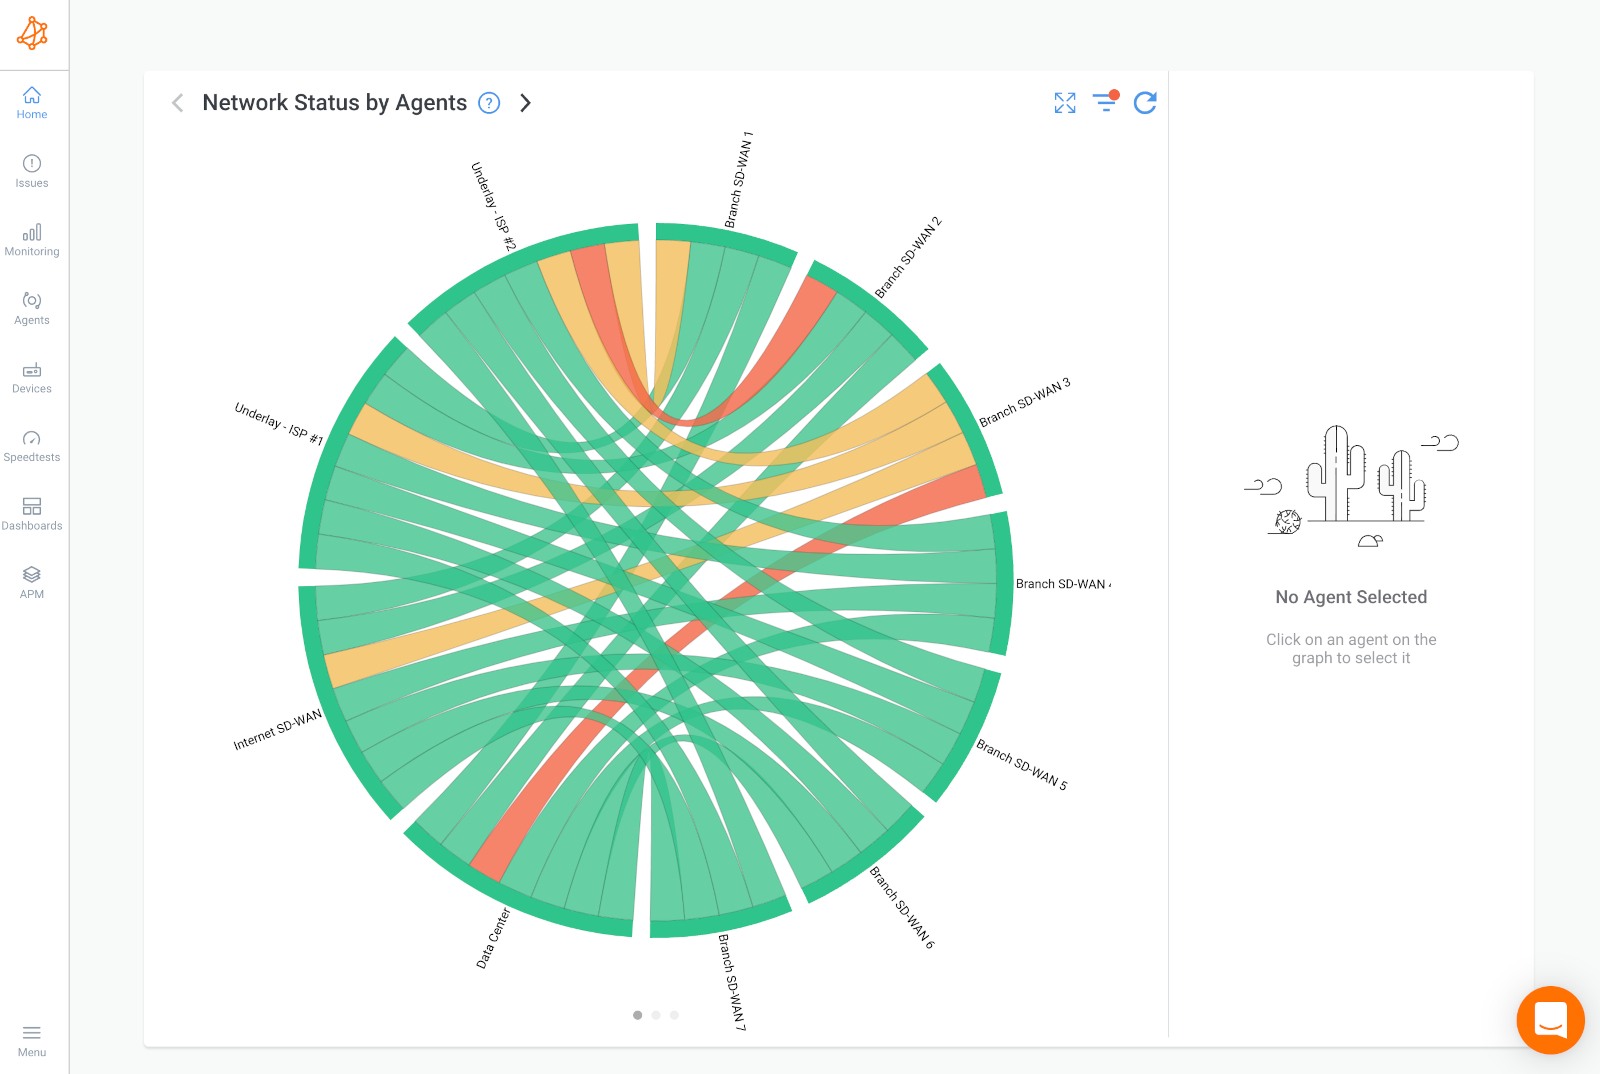
- Use Visual Traceroutes to see if the problem is within your local network or with your ISP.
 Screenshot from Obkio Vision: Visual Traceroute Tool
With the root cause identified, apply targeted fixes. This could involve configuration changes, firmware updates, or hardware replacements. If the issue is beyond your network, contacting your ISP or MSP may be necessary.
- Apply the needed solutions, like adjusting configurations or replacing faulty hardware.
- If external (e.g., ISP-related), contact the provider for support.
- Document all changes made for future reference and troubleshooting.
After implementing solutions, verify the issue is resolved. Ongoing monitoring with a tool like Obkio ensures the problem doesn’t recur and helps identify any new issues proactively.
- Test network performance post-fix to ensure the issue is resolved.
- Continuously monitor using Obkio to detect and address potential future issues.
- Ongoing monitoring allows you to proactively maintain network stability and performance.
In the end, effective network troubleshooting is all about understanding what’s going on under the hood. Just like a skilled mechanic needs reliable tools to diagnose and fix issues, network admins need a powerful, all-in-one toolkit to handle network errors with precision. That’s where Obkio comes in. Think of Obkio as your ultimate set of diagnostic tools, built to tackle every type of network issue, from minor lags to major disruptions, with ease and accuracy.
With Obkio, you’re not just patching over problems – you’re gaining in-depth insights and real-time monitoring that help prevent issues before they disrupt your workflow. So, instead of piecing together quick fixes, you’re using a toolset designed to keep your network running at its best. Whether you’re troubleshooting today’s errors or optimizing for tomorrow’s performance, Obkio has your back, equipping you with the visibility and control needed to master your network.

- 14-day free trial of all premium features
- Deploy in just 10 minutes
- Monitor performance in all key network locations
- Measure real-time network metrics
- Identify and troubleshoot live network problems


 Obkio Blog


