


Table of Contents
Table of Contents
In today's digital landscape, where performance is a key factor in delivering exceptional user experiences, organizations rely on performance monitoring tools to optimize their applications and networks. From Application Performance Monitoring (APM) to Network Performance Monitoring (NPM), these tools provide valuable insights into the performance of critical components in the technology stack.
In this article, we present a curated list of the top 19 performance monitoring tools that cover a wide spectrum, from APM solutions that focus on individual applications to NPM solutions that monitor network infrastructure. By exploring this diverse range of tools, you'll gain a comprehensive understanding of the capabilities they offer and how they can help you optimize performance and ensure seamless connectivity.
Join us as we explore these powerful performance monitoring tools, delving into their features, functionalities, and unique benefits. Whether you're seeking to enhance the performance of your applications or monitor and optimize your network infrastructure, this article will serve as a valuable resource in your search for the perfect performance monitoring tool.
Let's dive into the world of performance monitoring, where we discover the top 19 tools that can empower your organization to deliver outstanding performance and user experiences.
What are Performance Monitoring Tools? 
Performance monitoring tools encompass a range of software solutions designed to measure, analyze, and optimize the performance of applications and networks. These tools provide insights into various performance metrics and help identify bottlenecks, troubleshoot issues, and enhance overall system efficiency.
Application Performance Monitoring (APM) tools focus on monitoring and optimizing the performance of individual applications. They collect data on application response times, resource utilization, error rates, and user experience. APM tools often employ techniques such as code instrumentation, real user monitoring (RUM), and synthetic monitoring to gain visibility into application performance. With APM tools, organizations can proactively identify performance issues, optimize application code, and enhance the end-user experience.

Discover the power of Application Performance Monitoring (APM). Optimize your digital presence with APM insights. Explore Obkio's NPM and APM features.
Learn moreNetwork Performance Monitoring (NPM) tools, on the other hand, concentrate on monitoring and managing the performance of network infrastructure. These tools monitor network traffic, bandwidth utilization, latency, packet loss, and other network-specific metrics. NPM tools provide insights into network health, detect network congestion or bottlenecks, and assist in troubleshooting connectivity issues. By monitoring network performance, organizations can optimize their network infrastructure, ensure reliable connectivity, and deliver an efficient user experience.

Learn about network performance monitoring to optimize network performance. Discover key network metrics, tools & techniques & the benefits for businesses.
Learn moreBoth APM and NPM tools play a critical role in maintaining and improving overall system performance. APM focuses on the performance of individual applications, while NPM concentrates on the underlying network infrastructure that supports those applications. Together, they provide a comprehensive view of the end-to-end performance, enabling organizations to identify and address issues impacting application and network performance, ensuring seamless connectivity and optimal user experience.
APM vs. NPM: Comparing Features for Optimized Application and Network Performance
Application Performance Monitoring (APM) and Network Performance Monitoring (NPM) are two critical aspects of monitoring and optimizing the performance of applications and network infrastructure. APM focuses on individual applications, providing insights into code-level performance and user experience, while NPM focuses on network infrastructure, monitoring factors like network traffic, bandwidth utilization, latency, and packet loss.
Let's dive into a detailed comparison of the features typically found in APM and NPM software to understand their unique contributions and benefits.
In this comparison, we will explore the scope and focus of APM and NPM, metrics and data collection capabilities, monitoring granularity, troubleshooting and root cause analysis features, user experience monitoring capabilities, and integration ecosystems. While there are distinct differences between APM and NPM, it's worth noting that some modern performance monitoring tools offer combined APM and NPM capabilities, providing a comprehensive view of application and network performance.
Understanding the unique features and functionalities of APM and NPM tools empowers organizations to choose the right monitoring solutions to optimize their applications, ensure seamless connectivity, and deliver exceptional user experiences. Let's delve into the details of APM and NPM to unlock the potential for enhanced performance and efficient network operations.

Here's a comparison of features typically found in Application Performance Monitoring (APM) software and Network Performance Monitoring (NPM) software:
Scope and Focus:
- APM: APM software focuses on monitoring and optimizing the performance of individual applications, providing insights into code-level performance, user experience, and transaction tracing.
- NPM: NPM software focuses on monitoring and managing the performance of network infrastructure, including network devices, traffic, bandwidth utilization, latency, packet loss, and network topology.
Metrics and Data Collection:
- APM: APM tools collect data on application response times, resource utilization, error rates, throughput, and user interactions. They often use techniques like code instrumentation, real user monitoring (RUM), and synthetic monitoring to gather performance data.
- NPM: NPM tools collect data on network metrics like bandwidth utilization, latency, packet loss, network device health, and network topology. They either capture and analyze network packets to provide insights into network performance and behaviour or generate synthetic traffic.
Monitoring Granularity:
- APM: APM tools provide granular monitoring at the application level, allowing visibility into individual components, modules, and transactions. They can pinpoint performance bottlenecks within the application code.
- NPM: NPM tools provide visibility into the performance of network infrastructure at a higher level, such as routers, switches, firewalls, and network segments. They offer insights into overall network health and performance.
Troubleshooting and Root Cause Analysis:
- APM: APM tools assist in troubleshooting application performance issues by providing detailed diagnostics, tracing transaction paths, identifying slow database queries, and detecting code-level errors.
- NPM: NPM tools help troubleshoot network connectivity issues by analyzing network traffic, detecting network congestion, identifying packet loss or latency, and pinpointing device or link failures.
User Experience Monitoring:
- APM: APM tools offer real user monitoring (RUM) capabilities to track and analyze user interactions, providing insights into page load times, session durations, and user behavior.
- NPM: NPM tools focus more on network infrastructure performance and user experience monitoring details for network performance as a whole. Some NPM features also have APM features as well.
Integration and Ecosystem:
- APM: APM tools often offer integrations with popular application development frameworks, databases, and other DevOps tools to streamline workflows and enhance network observability.
- NPM: NPM tools integrate with network devices, network monitoring protocols, and management systems to collect data and provide comprehensive network visibility.
It's important to note that while there are differences in features between APM and NPM software, some modern performance monitoring tools offer a combination of both APM and NPM capabilities, providing a holistic view of the application and network performance for end-to-end performance optimization. Organizations often use a combination of APM and NPM tools to ensure seamless connectivity and optimal application performance.

Essential Criteria for Selecting the Best Performance Monitoring Tools
When it comes to choosing the best performance monitoring tools for your applications and network infrastructure, it's important to consider several key criteria. This comprehensive list of criteria will guide you in evaluating and selecting the right tool for your needs. From monitoring capabilities and data collection to scalability, troubleshooting, user experience monitoring, integration, and vendor support, these criteria will help you make an informed decision.
Discover the essential factors to consider and find the perfect performance monitoring tool that will optimize your applications, ensure seamless connectivity, and deliver outstanding user experiences.
Here's a list of criteria to consider when selecting the best performance monitoring tools:
- Monitoring Capabilities: Assess the monitoring capabilities offered by the tool, including application performance monitoring (APM), network performance monitoring (NPM), infrastructure monitoring, and user experience monitoring. Ensure that the tool covers the specific areas you need to monitor for your applications and network infrastructure.
- Metrics and Data Collection: Evaluate the metrics and data collection capabilities of the tool. Look for features such as response times, resource utilization, error rates, throughput, network traffic, bandwidth utilization, latency, and packet loss. Ensure that the tool provides the necessary insights into the performance and health of your applications and network.
- Scalability and Performance: Consider the tool's scalability and performance capabilities. Evaluate how well the tool can handle the volume of data generated by your applications and network. Determine if the tool can handle the growth of your infrastructure and the increasing demands of your applications.
- Alerting and Notification: Check the tool's alerting and notification system. Look for customizable alert thresholds, real-time notifications, and the ability to send alerts through various channels (email, SMS, etc.). Ensure that the tool can alert you promptly about performance anomalies or issues that require attention.
- Troubleshooting and Root Cause Analysis: Assess the tool's troubleshooting and root cause analysis capabilities. Look for features like detailed diagnostics, transaction tracing, code-level visibility, database query analysis, and error detection. Determine how effectively the tool can help you identify and resolve performance issues.
- User Experience Monitoring: Consider whether the tool provides user experience monitoring features. Look for capabilities such as real user monitoring (RUM), session analytics, page load times, and user behavior analysis. User experience monitoring is crucial for understanding how your applications perform from the end-user perspective.
- Integration and Compatibility: Evaluate the tool's integration capabilities with other systems and technologies. Check if it integrates smoothly with your existing infrastructure, application frameworks, databases, and other monitoring or DevOps tools. Compatibility with your technology stack ensures seamless data flow and enables effective monitoring and analysis.
- Ease of Use and User Interface: Consider the tool's ease of use and the intuitiveness of its user interface. Look for features like customizable dashboards, visualizations, and reporting options. An easy-to-use tool with a user-friendly interface simplifies the monitoring process and enables efficient analysis of performance data.
- Pricing and Licensing: Evaluate the tool's pricing structure and licensing options. Consider the cost-effectiveness and value provided by the tool based on your organization's budget and requirements. Determine if the pricing model aligns with your usage and scaling needs.
- Vendor Support and Reputation: Research the vendor's support quality and reputation. Look for reviews, customer feedback, and the vendor's track record in the performance monitoring market. Ensure that the vendor provides timely technical support, regular updates, and a strong commitment to customer satisfaction.
By considering these criteria, you can evaluate performance monitoring tools effectively and select the best solution that aligns with your organization's specific needs and goals.
Top Performance Monitoring Tools: By Category
In our comprehensive guide, we present a carefully curated list of the top 19 performance monitoring tools, covering a wide range of capabilities from Application Performance Monitoring (APM) to Network Performance Monitoring (NPM). Whether you're seeking to optimize application performance or monitor and manage your network infrastructure, this list features the best tools in the industry.
From APM solutions that focus on code-level performance and user experience to NPM solutions that provide insights into network traffic, latency, and packet loss, our list spans a diverse range of functionalities. Each tool has been selected based on its performance monitoring capabilities, features, reputation, and customer satisfaction.

Top 13 Network Performance Monitoring Tools (NPM)
In this section, we present the top 13 Network Performance Monitoring (NPM) tools that are specifically designed to monitor and optimize the performance of your network infrastructure. These tools offer a wide range of features and functionalities dedicated to ensuring seamless connectivity, identifying network bottlenecks, and troubleshooting network issues.
Maintaining the performance and reliability of your network is crucial for efficient operations and a positive user experience. The NPM tools featured in this section provide valuable insights into network traffic, bandwidth utilization, latency, packet loss, and other key metrics. By leveraging these tools, you can proactively monitor and manage your network infrastructure, detect performance anomalies, and optimize your network for peak efficiency.
Join us as we explore the top 13 NPM tools available today, delving into their unique features, capabilities, and benefits. With this comprehensive overview, you'll be equipped with the knowledge to choose the ideal NPM tool that aligns with your organization's monitoring requirements and ensures a robust and reliable network infrastructure.
Let's dive into the world of network performance monitoring and discover the top 13 tools that will empower you to maintain a high-performing network and seamless connectivity.


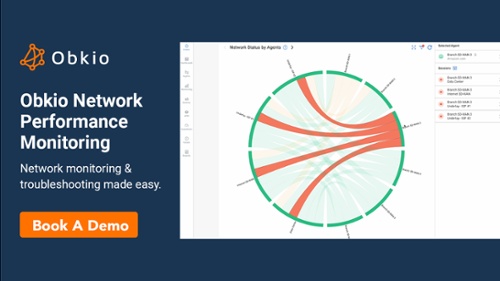
1. Obkio Network Performance Monitoring Tool
Obkio Network Performance Monitoring Tool offers a cloud-based network performance monitoring tool that provides real-time monitoring and performance analytics for cloud networks. This platform offers a range of features, including network latency and loss monitoring, as well as bandwidth monitoring, to help identify network bottlenecks and optimize network performance.
Obkio's key features include continuous network testing, automatic alerting, device tracking, and usage reports.
One of the advantages of Obkio's network monitoring tool is its user-friendly interface. The platform's intuitive interface provides real-time insights into network performance, enabling users to detect and troubleshoot network issues quickly. Users can access the network monitoring and testing features via an easy-to-use interface that offers a range of options to identify and address network issues.
Obkio offers a range of dashboards and visualizations that provide real-time data on network performance. The platform offers a home page, agent details page, network session page, data center dynamic dashboard, branch dynamic dashboard, branch dashboard, visual traceroutes, thresholds, and notifications to help users monitor and optimize network performance.
Obkio’s Pricing:
Obkio offers good news for its customers: its network performance monitoring solution comes with a straightforward pricing model that requires no hour-long training or assistance from their sales team to understand. This transparent pricing model makes it easy for customers to budget for their network monitoring costs without worrying about unexpected charges.
Learn more here : https://obkio.com/pricing/
You can use Obkio's Price Calculator to build your custom plan, and get a customized quote that you can use for your business' budgetting and planning needs.

Obkio’s App Interface:


Be guided through how to identify and troubleshoot network problems with Obkio’s Network Monitoring app tour and features through screenshots.
Learn moreObkio's Free 14-Day Trial:
To help you start monitoring and troubleshooting network issue in minutes, Obkio offers a free 14-day trial of all their premium features. With the help of Obkio's Onboarding Wizard, users can start collecting performance data and identifying network issues in minutes.
If you're interested in seeing Obkio's network monitoring platform in action, a demo is available on their website.
- 14-day free trial of all premium features
- Deploy in just 10 minutes
- Monitor performance in all key network locations
- Measure real-time network metrics
- Identify and troubleshoot live network problems


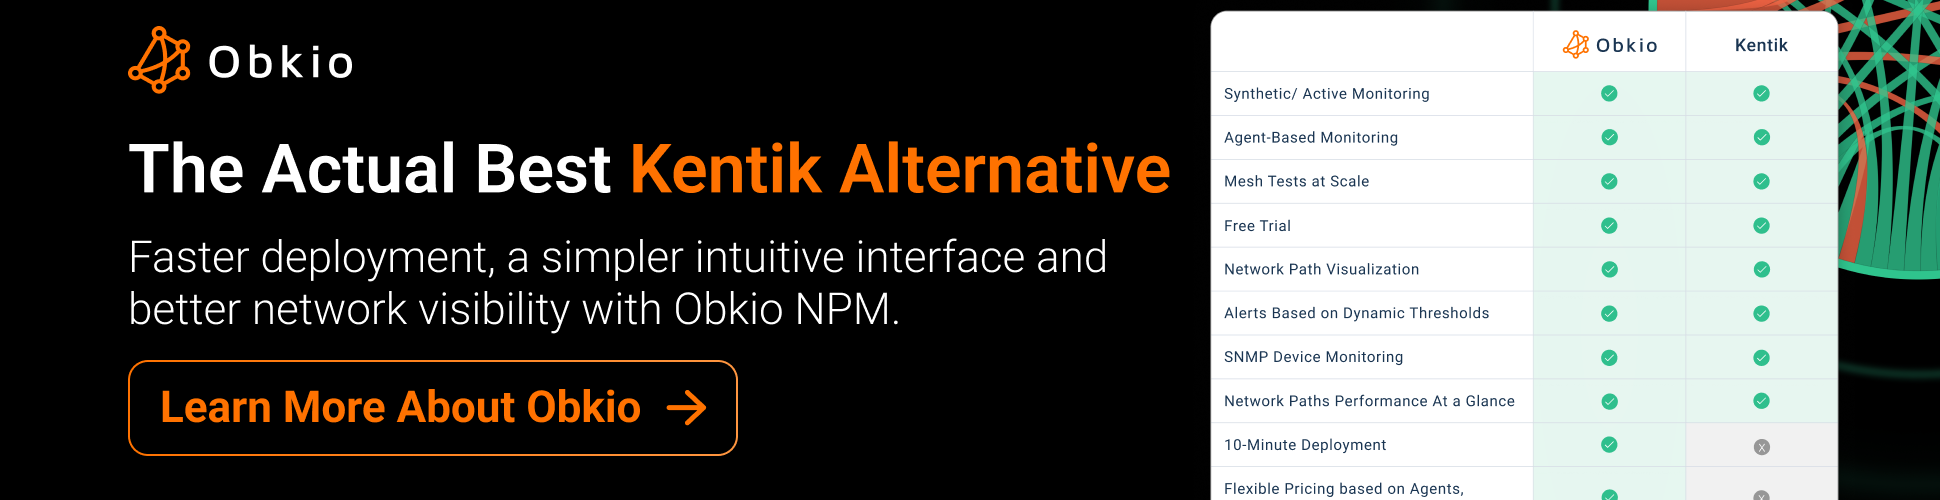
2. Kentik
Kentik is a network traffic intelligence platform that provides real-time network performance monitoring and analytics.
Its features include DDoS protection, network security monitoring, network performance optimization, and API integration. Kentik offers two pricing options - Essentials and Pro, which vary in included FPS, API queries/hour, dashboards, and scheduled reports.
The pricing for Kentik's Network Observability Cloud is based on the number of flow logs per second processed. Users can quickly identify and troubleshoot network issues with Kentik's user-friendly interface.
Kentik App Interface:


See how Obkio's Network Monitoring tool stands up against Kentik as the #1 Kentik Alternative.
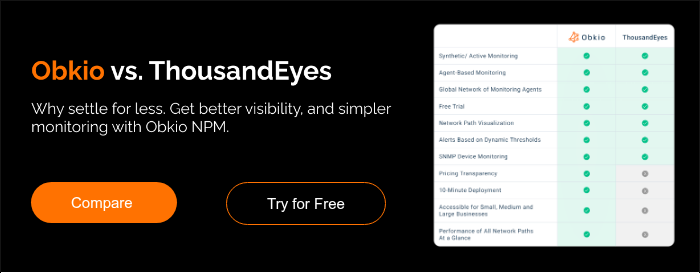
3. ThousandEyes
ThousandEyes is a cloud-based network performance monitoring tool that offers real-time monitoring and analytics for network performance, application performance, and user experience. Its key features include real-time alerts, device tracking, network topology mapping, and application performance monitoring.
ThousandEyes App Interface:


See how Obkio's Network Monitoring tool stands up against ThousandEyes as the best ThousandEyes Alternative.
4. Catchpoint
Catchpoint is a cloud-based network and digital experience monitoring platform that provides real-time monitoring and analytics for network performance, web performance, and user experience. Its key features include real-time alerting, device tracking, network topology mapping, and API integration.
Catchpoint App Interface:


Experience the power of the Catchpoint platform in action! This demo provides an overview of Catchpoint's real-time visibility into global monitoring networks and its various platform dashboards. You'll discover how monitoring teams can leverage Catchpoint to perform synthetic tests, analyze real-time user data, and monitor network performance.

5. AppNeta
AppNeta is a cloud-based network performance monitoring tool that offers real-time monitoring and analytics for network performance and application performance. Its key features include real-time alerting, device tracking, network topology mapping, and API integration. AppNeta offers five pricing options, including Small Office, Large Office, Data Center, and two Global Monitoring options.
AppNeta App Interface:


See how Obkio's Network Monitoring tool stands up against Appneta as the ultimate Appneta Alternative.

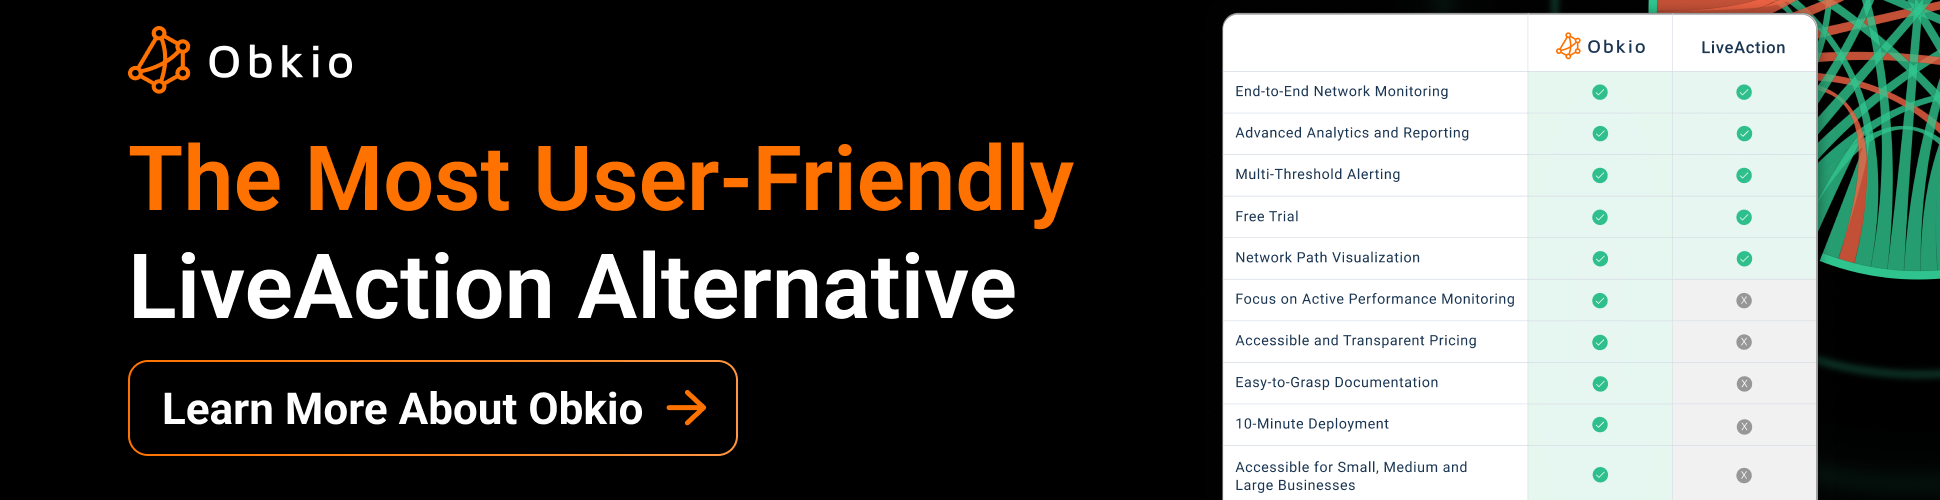
6. LiveAction
LiveAction is a cloud-based network performance monitoring and diagnostics tool that provides real-time monitoring and analytics for network performance.
Its key features include real-time alerts, network topology mapping, application performance monitoring, and API integration. LiveAction offers various pricing options, including LiveNX WAN Perpetual License and LiveNX SMB Perpetual License.
LiveAction App Interface:


7. PRTG Network Monitor
A comprehensive IT management software solution that offers network bandwidth monitoring capabilities. It provides real-time traffic analysis, bandwidth usage reports, device tracking, and more. It can monitor a variety of network devices and applications and offers customizable alerts and notifications to keep users informed of network performance issues. PRTG offers cloud-based network monitoring services that allow users to monitor their network from anywhere and offers flexible deployment options.
PRTG Network Monitor offers a range of pricing options depending on the number of devices and aspects (a feature or capability within PRTG) to be monitored.
PRTG App Interface:


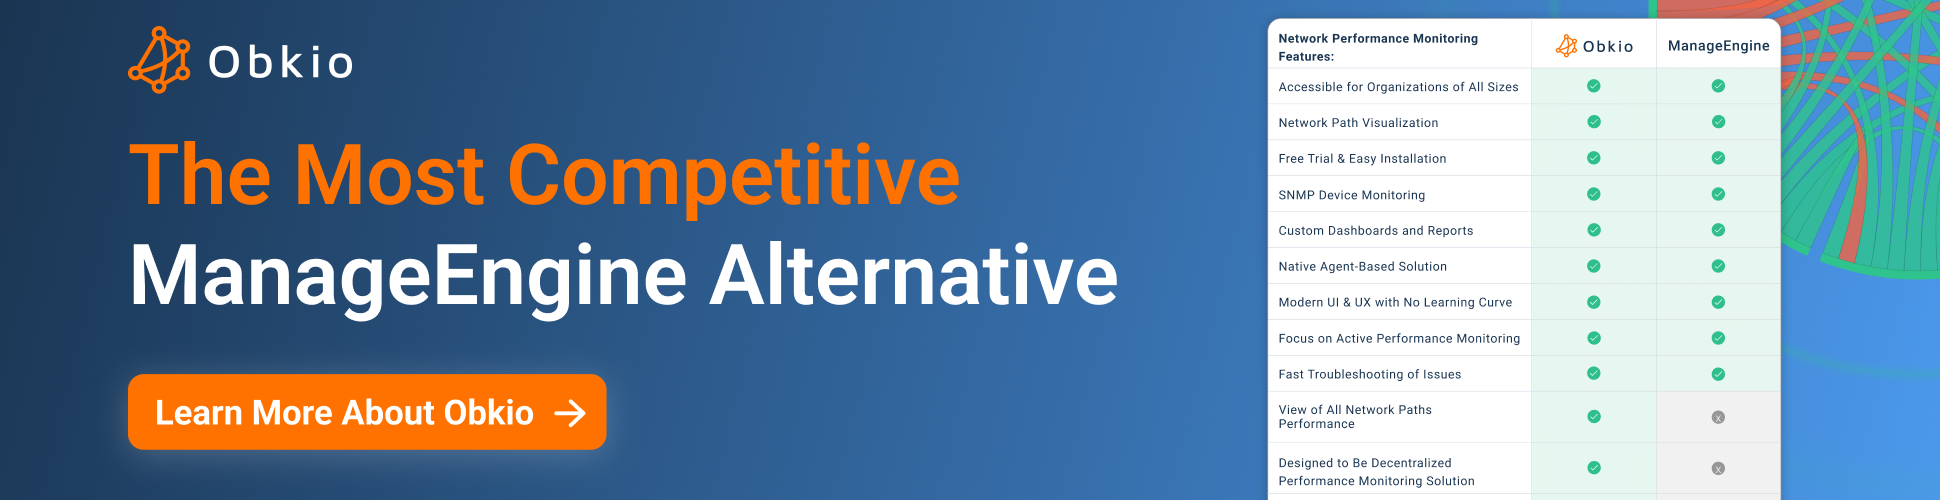
8. Manage Engine OPManager
A popular IT management software solution that offers network bandwidth monitoring capabilities. It provides real-time traffic analysis, bandwidth usage reports, device tracking, and more. It can monitor a range of network devices and applications and offers customizable alerts and notifications to keep users informed of network performance issues. OPManager offers cloud-based network monitoring services that allow users to monitor their network from anywhere and provides a range of deployment options, including on-premises, hosted, or as a virtual appliance.
Manage Engine OPManager offers two editions: Standard and Professional, and both editions are available in different packages based on the number of devices and users.
Manage Engine OPManager App Interface:


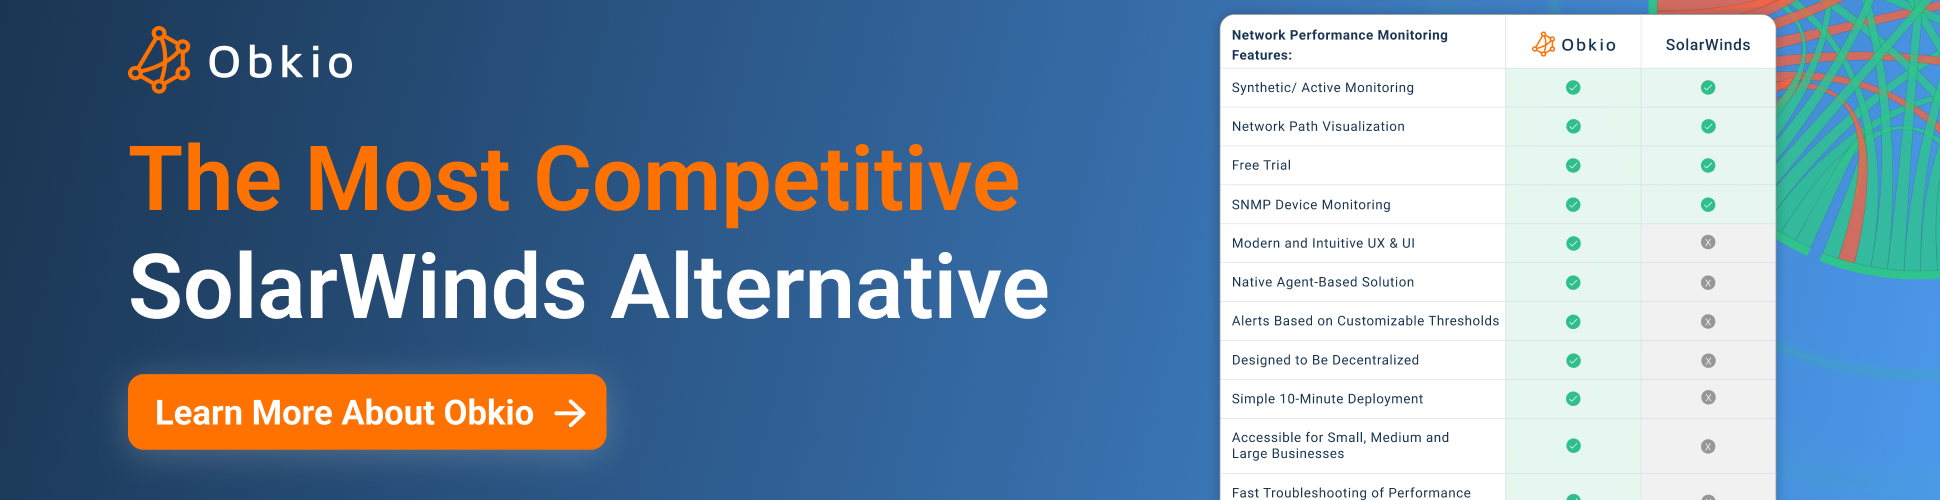
9. SolarWinds Network Performance Monitor
A comprehensive network performance monitoring tool that provides real-time visibility into network performance and health. It offers network device monitoring, traffic analysis, and real-time alerts and notifications to help identify and troubleshoot network issues. SolarWinds offers cloud-based network monitoring services that allow users to monitor their network from anywhere and offers flexible deployment options.
SolarWinds Network Performance Monitor (NPM) is licensed based on the number of network elements being monitored, which include nodes, interfaces, and volumes.
SolarWinds App Interface:


Discover how Obkio stands up against SolarWinds NPM as the simplest, most affordable SolarWinds alternative.
10. ScienceLogic
An IT infrastructure monitoring and management platform that offers real-time visibility into network performance, health, and security. It provides network device monitoring, traffic analysis, and customizable alerts and notifications to help identify and troubleshoot network issues. ScienceLogic offers cloud-based network monitoring services that allow users to monitor their network from anywhere and provides a range of deployment options, including public and private cloud, on-premises, or hybrid.
ScienceLogic App Interface:


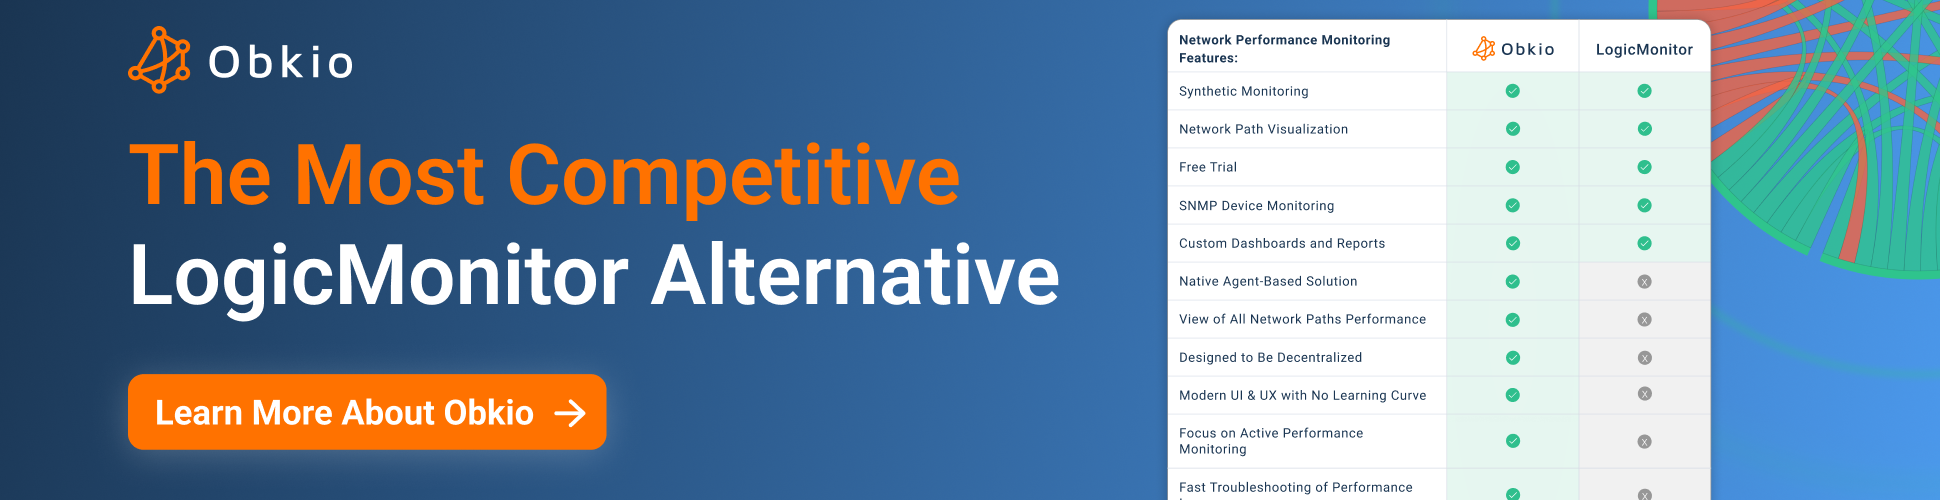
11. LogicMonitor
A cloud-based IT infrastructure monitoring and management platform that provides real-time visibility into network performance and health. It offers network device monitoring, traffic analysis, and real-time alerts and notifications to help identify and troubleshoot network issues. LogicMonitor offers cloud-based network monitoring services that allow users to monitor their network from anywhere and provides a range of deployment options, including public and private cloud, on-premises, or hybrid.
LogicMonitor App Interface:


12. Auvik
A cloud-based network monitoring and management tool that provides real-time visibility into network performance, health, and security. It offers network device monitoring, traffic analysis, and customizable alerts and notifications to help identify and troubleshoot network issues. Auvik offers cloud-based network monitoring services that allow users to monitor their network from anywhere and provides a range of deployment options, including public and private cloud, on-premises, or hybrid.
Auvik App Interface:


13. Icinga
An open-source network monitoring and management tool that provides real-time visibility into network performance and health. It offers network device monitoring, traffic analysis, and customizable alerts and notifications to help identify and troubleshoot network issues. Icinga offers cloud-based network monitoring services that allow users to monitor their network from anywhere and provides a range of deployment options, including public and private cloud, on-premises, or hybrid.
Icinga is a free and open-source network monitoring solution. However, in 2022, Icinga announced that it would move to a subscription-based model for Red Hat Enterprise Linux, SUSE Linux Enterprise Server, and Amazon Linux. Users can still build the agent for free, and the subscription is only required for non-community Linuxes and the official packages.
Icinga App Interface:


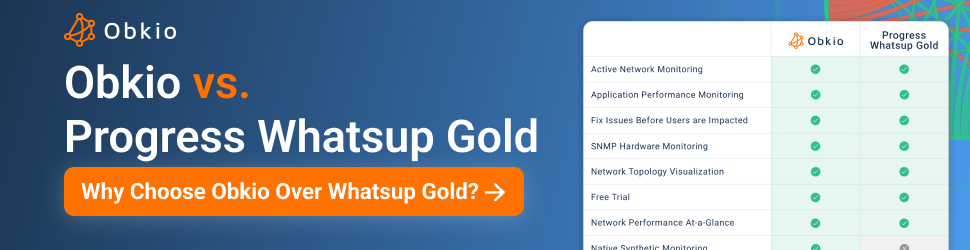
14. Progress WhatsUp Gold
An IT infrastructure monitoring and management platform that offers network device monitoring, traffic analysis, and customizable alerts and notifications to help identify and troubleshoot network issues. It provides real-time visibility into network performance and health and offers cloud-based network monitoring services that allow users to monitor their network from anywhere and provides a range of deployment options, including public and private cloud, on-premises, or hybrid.
Progress WhatsUpGoldUser App Interface:


Best 6 Application Performance Monitoring (APM) Tools
In this section, we present the best 6 Application Performance Monitoring (APM) tools that excel in monitoring and optimizing the performance of your applications. These tools are specifically designed to provide valuable insights into code-level performance, user experience, and transaction tracing.
Applications are at the core of modern businesses, and ensuring their performance and reliability is essential for delivering exceptional user experiences. The APM tools featured in this section offer comprehensive monitoring capabilities to help you identify and resolve performance issues, enhance application responsiveness, and improve overall user satisfaction.
Let's dive into the world of application performance monitoring and discover the best 6 tools that will empower you to deliver high-performing applications, seamless connectivity, and an outstanding user experience.
1. Datadog
Datadog is a cloud-based monitoring and analytics platform that provides monitoring, alerting, tracing, and logging capabilities for applications and infrastructure. It offers full-stack observability with support for over 450 integrations across more than 150 technologies, including AWS, Azure, GCP, Kubernetes, and Docker. Datadog's cloud monitoring services enable users to collect and analyze data from across their entire stack, providing deep insights into system performance and helping them troubleshoot issues quickly.
Datadog offers various pricing plans with different features and capabilities, so it's recommended to review their website and speak with a sales representative to determine the best plan and pricing for a specific use case.
Datadog App Interface:


2. AppDynamics
AppDynamics is an application performance monitoring (APM) solution that provides real-time insights into application performance, user experience, and business impact. It provides end-to-end visibility across application environments, including cloud, on-premises, and hybrid environments, enabling users to quickly identify and resolve issues before they impact end-users. AppDynamics' cloud monitoring services allow users to monitor their applications, microservices, and APIs in real-time and track performance metrics such as response times, error rates, and resource utilization.
AppDynamics pricing may vary based on the specific requirements of each organization, and AppDynamics also provides custom plans for businesses with complex environments.
AppDynamics App Interface:

3. Dynatrace
Dynatrace is an APM and digital experience management (DEM) solution that provides real-time insights into application performance, user experience, and business impact. It uses AI-powered automation to detect anomalies and performance issues, providing root cause analysis and recommendations for remediation. Dynatrace's cloud monitoring services allow users to monitor their applications and infrastructure across cloud, hybrid, and multi-cloud environments, providing visibility into cloud provider-specific metrics such as AWS, Azure, and Google Cloud.
Dynatrace offers full-stack monitoring, infrastructure monitoring, and digital experience monitoring with pricing that varies depending on factors such as the level of services and support needed, the size and complexity of the environment being monitored, and the length of the contract.
Dynatrace App Interface:


4. Splunk
Splunk is a cloud-based platform that provides monitoring, logging, and analytics capabilities for applications and infrastructure. It offers machine learning-driven insights and predictive analytics for detecting and resolving issues, and provides support for over 300 integrations across multiple technology stacks. Splunk's cloud monitoring services allow users to monitor their entire stack, from infrastructure to application performance, and analyze data in real-time to identify issues and troubleshoot problems.
Splunk App Interface:

5. New Relic
New Relic is an APM solution that provides real-time insights into application performance, user experience, and business impact. It offers support for multiple languages, frameworks, and environments, including cloud, on-premises, and hybrid environments, and provides customizable dashboards and alerts for tracking performance metrics. New Relic's cloud monitoring services enable users to monitor their entire stack, including applications, infrastructure, and logs, and provides out-of-the-box integrations with popular cloud platforms such as AWS, Azure, and GCP.
New Relic offers different pricing plans for its observability platform, with varying data and user costs.
New Relic App Interface:


6. Elastic Observability
Elastic Observability is a cloud-based monitoring and observability solution that provides real-time insights into application performance, infrastructure, and logs. It offers support for multiple technologies and integrations, including AWS, Azure, and GCP, and provides customizable dashboards and alerts for tracking performance metrics. Elastic Observability's cloud monitoring services enable users to monitor their entire stack, from infrastructure to application performance, and analyze data in real-time to identify issues and troubleshoot problems.
Elastic Observability offers four pricing tiers based on the level of features and support provided. Each tier includes additional features like security, observability applications for APM, logging, and metrics, and advanced security features, machine learning capabilities for anomaly detection, cross-cluster replication, searchable snapshots, support for searchable cold and frozen tiers, and Elastic Maps Server.
Elastic Observability App Interface:


Navigating the Performance Monitoring Landscape: Find Your Perfect Fit with Obkio
We hope that this article has provided valuable insights and assistance in your research for the perfect performance monitoring tools. Our goal has been to help you navigate the vast landscape of options and find a solution that best fits your specific needs and requirements.
At Obkio, we prioritize a user-first approach, and our network performance monitoring tool is designed with simplicity and ease of use in mind. If you are looking for a hassle-free way to monitor your network performance, we invite you to try Obkio. With our user-friendly platform, you can get started in less than 10 minutes without the need for extensive investment or technical expertise.

Rest assured, we are not salesy, and we respect your decision even if you choose to explore other options. We won't hassle you with unwanted follow-ups. Our focus is to provide you with a reliable performance monitoring solution that empowers you to optimize your applications, ensure seamless connectivity, and deliver exceptional user experiences.
Thank you for considering Obkio, and we look forward to assisting you on your performance monitoring journey.
Put It to the Test: Trying Is the Ultimate Way to Learn!
Networks may be complex. But Obkio makes network monitoring easy. Monitor, measure, pinpoint, troubleshoot, and solve network problems.
- 14-day free trial of all premium features
- Deploy in just 10 minutes
- Monitor performance in all key network locations
- Measure real-time network metrics
- Identify and troubleshoot live network problems
This page is compiled from the information available on the software’s official website. We have made every attempt to ensure the accuracy and reliability of the information provided in this article. However, the information is provided “as is” without warranty of any kind. Obkio is not liable for any inaccuracies in the article due to changes made on their websites or any development made to their products after the date of publication of this article. Please refer to their websites for more information.

