


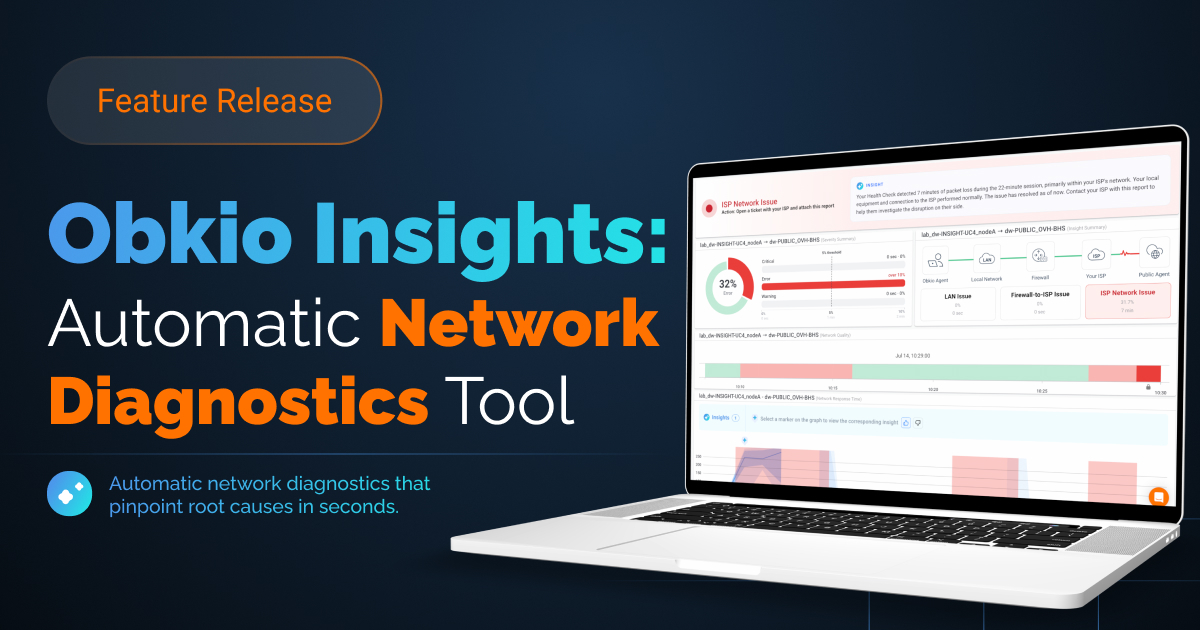


 Obkio Blog


 Subscribe
Table of Contents
Table of Contents
Real user network monitoring (network RUM) measures network performance from the device an employee actually uses, not from a data center or a test box. It adds what synthetic tests can't see, like the machine's CPU and memory load, Wi-Fi signal and gateway latency, so IT can tell whether a slowdown comes from the network, the ISP, or the user's own device.
So let’s say that a user opens a ticket: Teams keeps freezing, uploads crawl, "the Internet is slow." You check your network monitoring tool, but see that every test is green. The firewall looks fine, the ISP link is clean, the SaaS vendor reports no incident.
The problem is still real. It's just happening where your tools can't see: on the user's laptop, on their Wi-Fi, or on the short stretch between their machine and the local gateway. Most network monitoring watches the infrastructure. It doesn't watch the device the person is actually working on.
Real user network monitoring closes that gap. It measures from the user's own machine and records the conditions around each measurement: how loaded the computer was, whether it was on Wi-Fi or wired, how strong the signal was, how fast the gateway answered.
In this article, we'll cover what real user network monitoring is, how it differs from the "RUM" web teams use, what it measures, and how it answers the question behind every "it's slow" ticket: is it the network, the ISP, or the user's machine?
What is Real User Network Monitoring (RUM)? 
Real user network monitoring (network RUM) is the practice of measuring network performance from the devices employees actually use, along with the device and local network conditions around each measurement. It shows how the network performs from the user's seat, and whether a problem comes from the network, the ISP, or the device itself.
Two words in that definition do most of the work.
1. Real user:
The user is someone inside your organization: an employee at the office, a remote worker at home, a clinician at a workstation. The data comes from their laptop or desktop, not from a data center, a cloud region or a dedicated monitoring appliance.
That's a different "user" from the one web teams mean when they say real user monitoring, which is a website visitor. We'll come back to that distinction in the next section.
2. Network:
Network RUM isn't about page load times or JavaScript errors. It covers what shapes every connection the user makes: the machine's resources, its network interface, the Wi-Fi link, the local gateway, the DHCP and DNS services the device depends on, and the path out to the Internet.
Put together, they give IT the one view infrastructure monitoring can't: the user's side of the story, measured instead of described in a ticket.
Hybrid work made that view harder to do without. When people work from home, coworking spaces and branch offices, a large share of the path sits on hardware IT doesn't own: a home router, a shared access point, a consumer ISP. Network RUM is how you get visibility there without sending someone on site.
You'll also see it called endpoint network monitoring or user-side network monitoring. The idea is the same: put the measurement where the experience happens.
How Real User Network Monitoring Works
Network RUM turns the user's own computer into a monitoring point. Instead of waiting for a ticket, it measures continuously from wherever the person actually works.
- An agent runs on the employee's computer: A software agent installs on the laptop or desktop and runs in the background, at the office, at home or on the road.
- It tests the network from that machine: The agent sends small amounts of test traffic to the local gateway, to public targets and to the applications people rely on, measuring network metrics like latency, jitter and packet loss along the way.
- It records the conditions around each test: At the same moments, it collects data from the machine itself (CPU, memory, network interface) and from the local connection (Wi-Fi or wired, signal strength, gateway latency).
- Every result is stored with its context: A packet loss spike is never just a number; it comes with the state of the device and the Wi-Fi at that exact moment.
- A central platform correlates the data: Results from every user and site land in one place, so IT can compare users, spot patterns across a site or ISP, and get alerted when performance degrades.
What IT gets is a measured timeline of each user's experience, instead of a description of the problem written after the fact.
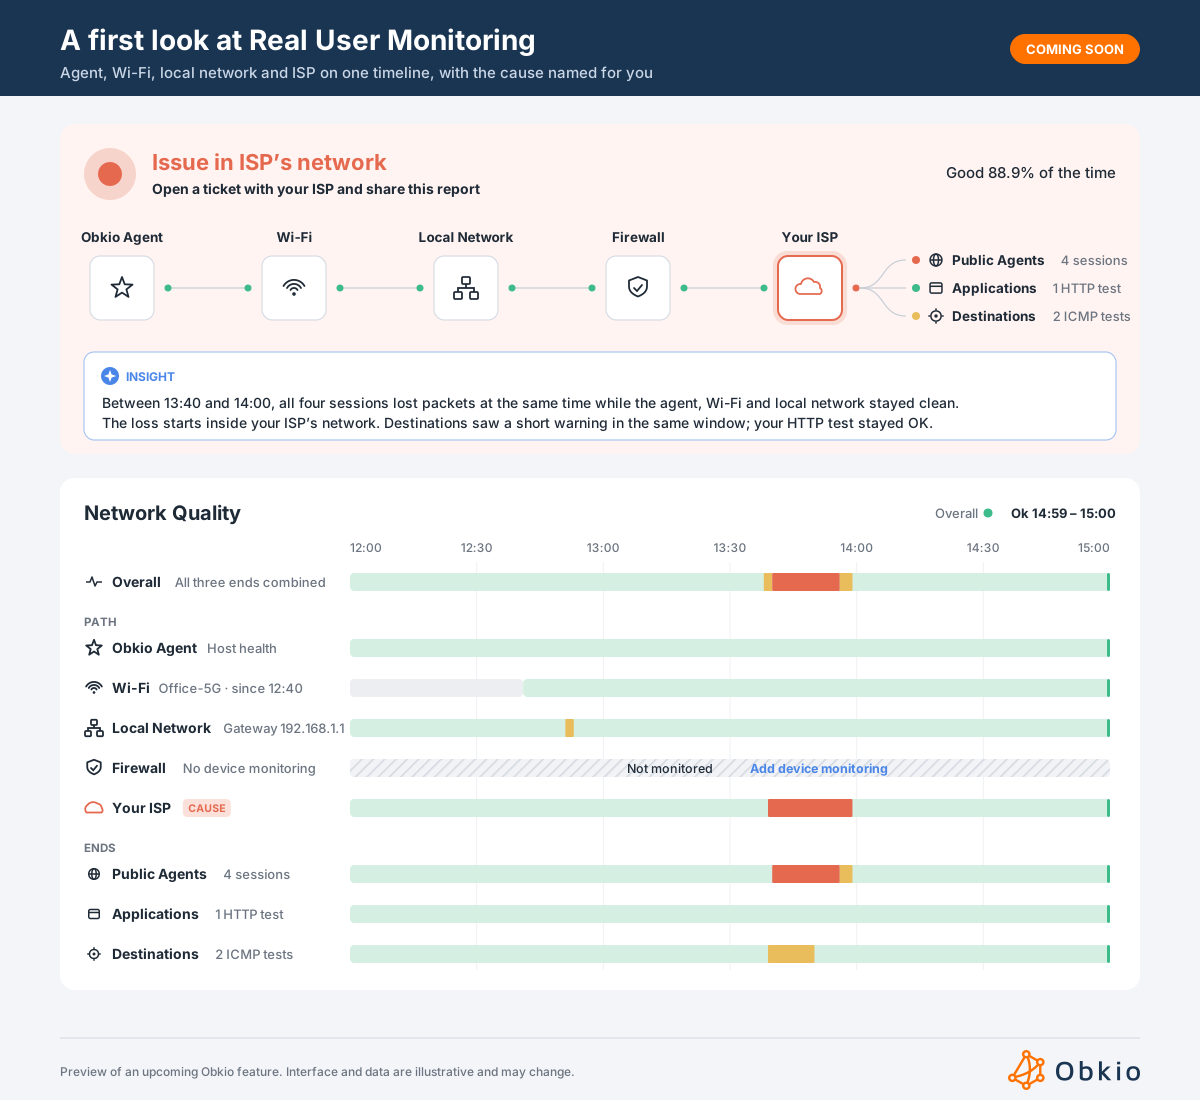
With Obkio’s upcoming Real User Monitoring feature, those five steps end up on a single timeline, and the platform’s diagnostics point to where the problem started.
Network RUM vs. Web Performance RUM
Search for "real user monitoring" and almost every result describes something else: a script in a website or mobile app that records how fast pages load for visitors. That's web performance RUM, and it's built for a different team with a different question.
Both use real users instead of simulated ones. That's where the overlap ends.
- Who's measured: Web RUM measures visitors to your website or app, usually customers. Network RUM measures your own employees, wherever they work.
- Where the data comes from: Web RUM runs as JavaScript in the visitor's browser or an SDK in your app. Network RUM runs as an agent on the employee's computer.
- What it measures: Web RUM tracks page load times, Core Web Vitals, front-end errors and user sessions. Network RUM tracks the device's resources, the Wi-Fi or wired connection, the local gateway and network quality along the path.
- What it can see: Web RUM only sees what happens inside your own site or app. Network RUM sees the conditions under every app the employee uses, from Teams to the CRM.
- Who uses it: Web RUM is for developers, product and e-commerce teams. Network RUM is for IT teams, network administrators and MSPs.
- The question it answers: Web RUM asks "Is our site fast for visitors?" Network RUM asks "Why is the network slow for this person?"
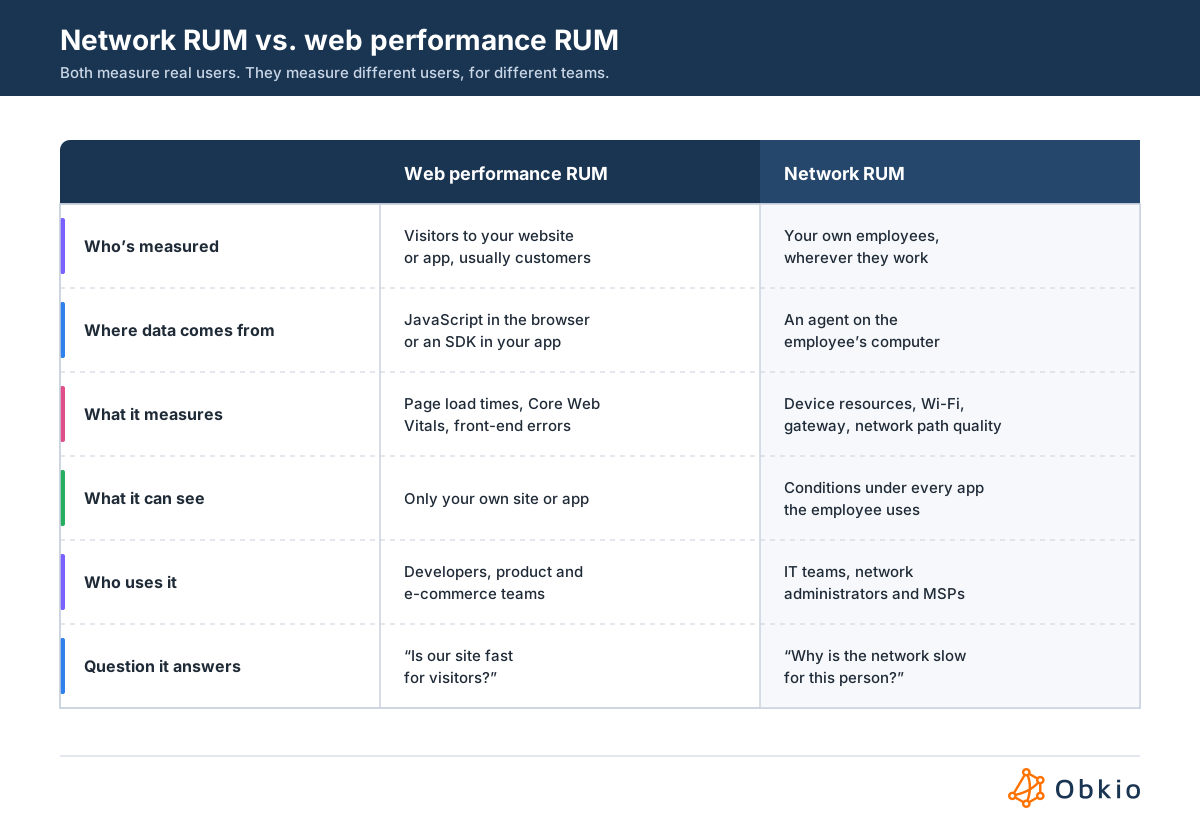
The two aren't competitors. A company can run web RUM on its customer-facing site and network RUM for its staff, and the data never overlaps. For a broader look at tools that measure the user's side, see our guide to end user experience monitoring tools.
The rest of this article is about network RUM.
Real User Monitoring Metrics: What Network RUM Measures
Network RUM collects two layers of data from the user's machine. The first tells you whether the machine itself can be trusted as a test point. The second tells you what's happening between the machine and the rest of the network.
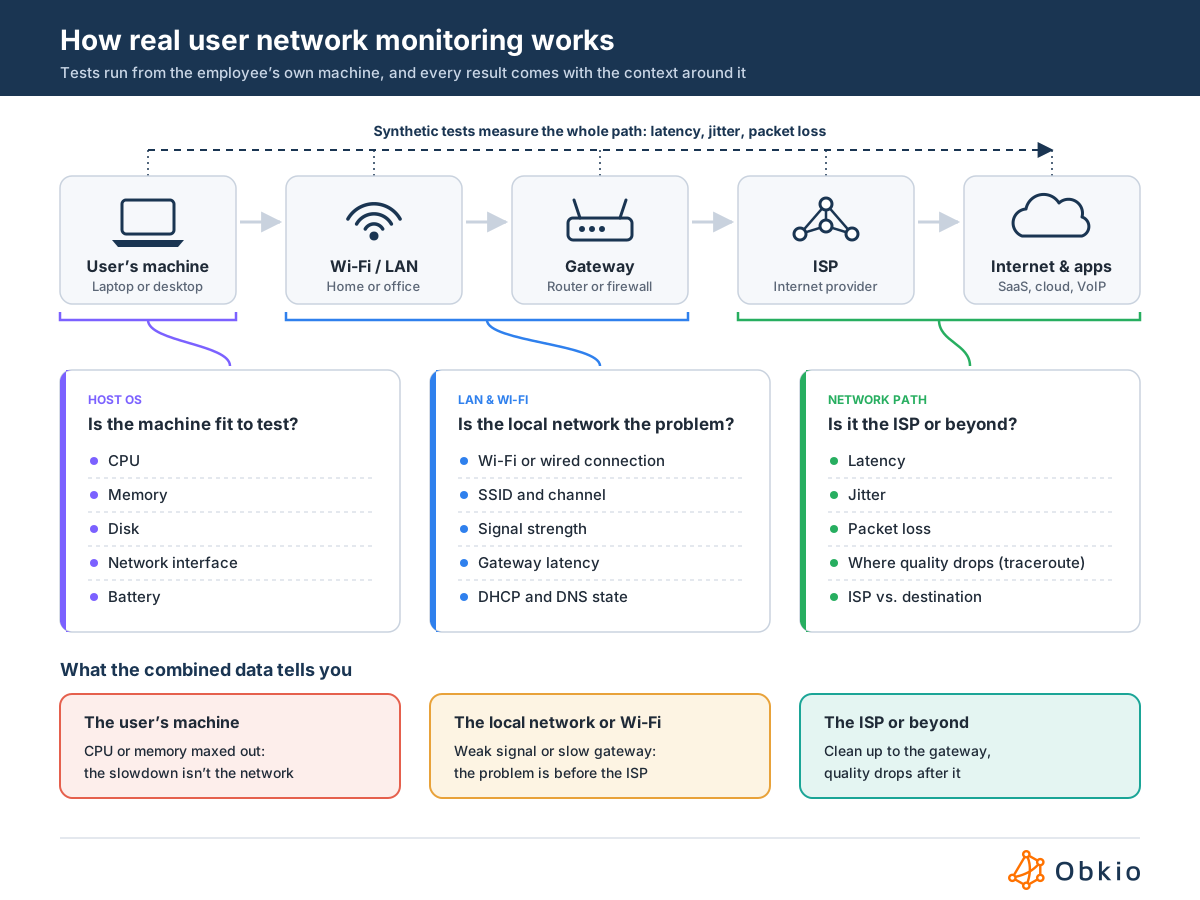
Host OS: Is the machine fit to test?
Every network test that runs on a laptop depends on that laptop's CPU, memory and network card. When the machine struggles, results degrade with it, and a slow machine can look exactly like a slow network.
- CPU usage: a processor pinned near 100% delays packet processing and makes every app feel sluggish. Video calls, antivirus scans and browser tabs are the usual suspects.
- Memory: when RAM runs out, the operating system swaps to disk and everything slows down, network stack included.
- Disk activity: updates, backups and file syncing compete for the same resources and make apps feel slow on a healthy network.
- Network interface: link speed, errors and drops on the network card. A wired port that negotiated 100 Mbps instead of 1 Gbps, or a card dropping packets, looks like a network problem from every other angle.
- Battery: on battery power, many laptops throttle the CPU and put the Wi-Fi card into power-saving mode, which adds latency.
Host OS data doesn't diagnose network problems on its own. Its job is to qualify every other measurement: if the machine was saturated when a test degraded, the network probably isn't to blame.
LAN and Wi-Fi: Is the local network the problem?
The second layer covers the first hop, from the machine to the local gateway (LAN). It's the part of the path IT usually can't see, especially when the user is at home.
- Connection type: Wi-Fi or wired. It's the fastest way to narrow down a complaint, because the two fail in very different ways.
- SSID: which network the device is joined to. A laptop on the guest network, a phone hotspot or the wrong office SSID explains a lot of "it worked yesterday" tickets.
- Signal strength: measured in dBm. Around -67 dBm or stronger is generally considered enough for voice and video; below roughly -75 dBm, retransmissions and drops start to climb.
- Channel: which Wi-Fi channel the access point is using. Crowded channels, especially on 2.4 GHz, mean interference from neighbouring networks.
- Gateway latency: the round trip from the machine to its router or firewall. It should stay at a few milliseconds. When it spikes, the problem is local, before traffic ever reaches the ISP.
- DHCP and DNS state: whether the device got a valid IP address, which DNS servers it uses and how quickly they answer. A failed lease or a slow DNS server makes "the Internet" look down when the connection is fine.
For a deeper look at the wireless side, see our guide to WiFi monitoring.
The third layer, the path from the gateway through the ISP to the application, is what synthetic network tests already measure. Network RUM doesn't replace those tests. It adds the context around them.

Learn what WiFi monitoring measures, how to check WiFi performance, and how to catch slow connections before remote teams notice.
Learn more

How to Deploy Real User Network Monitoring
Network RUM is quick to install and easy to over-deploy. Starting small, with a clear question to answer, gets you useful results in days instead of a dashboard nobody opens.
Step 1: Start with a pilot group
Pick the users who generate the most "it's slow" tickets: a handful of remote workers, one branch office or one difficult client if you're an MSP. Their problems give you the fastest proof that the data helps, and a small group keeps the first weeks manageable.
Step 2: Choose your RUM data categories
Decide whether you need host OS data, LAN and Wi-Fi data or both. Base it on the problems you're chasing and on your privacy policy: if most complaints come from home Wi-Fi, the LAN and Wi-Fi category matters most. Tell the pilot users what's collected and why before you install anything.
Step 3: Deploy the Real User Monitoring agent
Push the agent the same way you push other software, through your endpoint management or software deployment tool. That keeps installs consistent, makes updates automatic and lets you remove it cleanly if a user leaves the pilot. Check that each agent reports in before moving on.
Step 4: Pair the agent with network path tests
Set up tests from each machine to three kinds of targets: its local gateway, a public target close to the user, and the apps people depend on, like Teams or your main SaaS tools. Each target answers a different question. Without targets past the gateway, network RUM can tell you the local side is clean, but not whether the ISP or the application is at fault.
Step 5: Build a network performance baseline
Give it a week or two of normal working days before judging anything. Every user's setup is different, so the baseline is what turns "it's slow" into "latency is three times higher than this user's usual Tuesday morning."
Step 6: Set alerts on what users actually feel
A CPU spike on its own isn't an incident, and alerting on every metric buries you in noise. Alert on the symptoms users notice, like packet loss to Teams during work hours or a site-wide jump in latency. Then use the real user monitoring data to explain the alert before anyone escalates it.
Step 7: Use it on the next ticket, then expand
Make the RUM timeline the first thing you check on every slowness complaint from the pilot group. Track how quickly those tickets close compared with before. Once it's clearly saving time, extend it to more users and sites.

What Problems Does Real User Network Monitoring Solve?
Most network monitoring is built to answer one question: is the infrastructure healthy? Routers, firewalls, ISP links and cloud services each get their own checks, and when they're all green, the network is considered fine.
Users don't experience infrastructure, though. They experience a laptop, a Wi-Fi connection and the apps on the other end. That leaves a whole category of tickets where every dashboard is green, and the user is still having a bad day. They drag out network troubleshooting; they're hard to prove one way or the other, and they bounce between teams.
That's where network RUM earns its place. These are the problems it changes most.
"It's slow" tickets with nothing to go on
A user reports a slowdown from yesterday afternoon. By the time IT looks, it's gone, and the only evidence is the user's memory. With network RUM, there's a measured record of that machine at that moment: network quality, device load and Wi-Fi conditions, all on the same timeline. IT can look back instead of asking the user to call next time it happens, which is what makes intermittent connection problems solvable.
Chasing problems that aren't the network's
Some slowdowns start on the user’s device. A laptop with a maxed-out CPU or no free memory will fail network tests, drop calls and make apps crawl, while the network itself is fine. Without host OS data, that looks like an ISP problem and gets escalated as one. With it, IT can rule the network out in minutes.
The Wi-Fi blind spot for remote and hybrid staff
When people work from home, the first hop runs over a router IT didn't buy and can't log into. Weak signal, a crowded channel or a router across the house can wreck call quality, and none of it shows up in office monitoring. Network RUM brings that hop into view without sending anyone to the user's kitchen. See remote worker monitoring.
Ticket ping-pong between IT, the ISP and the user
The user blames IT, IT suspects the ISP, the ISP says its line tests clean. Without shared evidence, the ticket bounces until someone gives up. RUM data shows where on the path the problem sits, so the ticket goes to the right owner the first time. When it is the ISP, a clean local side makes the case much harder to dismiss. Here's how to prove your ISP is the problem.
One user, one site or everyone?
When complaints come in, the first question is “how many sites are being affected?” Comparing RUM data across users answers it fast: one person on weak Wi-Fi is a local fix, a whole office with high gateway latency points to the site's LAN, and every site degrading at once points to a shared ISP or cloud service.
Bad calls on Teams, Zoom and VoIP
Real-time calls are the first thing to suffer from jitter and packet loss, and the cause is often local: a weak Wi-Fi signal, a laptop on battery saver, a CPU busy with a screen share. Network RUM separates those from network problems, so call complaints stop defaulting to "the network."
MSPs proving it's not their network
For MSPs, every unexplained slowdown risks becoming "our network is bad." Network RUM gives technicians the data to show when the problem is a client's home Wi-Fi or an overloaded laptop, and to close tickets without a site visit.

Is your Internet slow? Learn how to tell if the problem is your network, your ISP, or your machine, and how to fix slow Internet fast.
Learn more
Real User Monitoring vs. Synthetic Monitoring: Why You Need Both
Synthetic monitoring and real user monitoring are usually framed as rivals: simulated traffic against real traffic. For network RUM, that framing doesn't hold. Network RUM still runs synthetic tests. What changes is where they run from, and what comes attached to each result.
Synthetic monitoring sends small amounts of test traffic between known points on a schedule, like an office, a data center or a cloud region, and measures latency, jitter and packet loss. It's consistent; it runs whether or not anyone is working, and it gives you a clean baseline. More on synthetic monitoring.

Network RUM runs those same tests from the employee's own machine and records the device and local network conditions around every result.
On their own, each one leaves a gap:
- Synthetic tests from fixed locations can't see the last few meters: the user's Wi-Fi, their home router or their laptop. And when a test runs on a user's machine without context, a degraded result could be the network or the machine running it.
- Device and Wi-Fi data alone can tell you a laptop was busy, or the signal was weak, but not how the path beyond the gateway was performing at that moment.
Together, they answer the two questions every slowdown raises. Synthetic tests answer "is the path degraded, and where?" RUM context answers "can I trust that result, and is the cause on the user's side?"
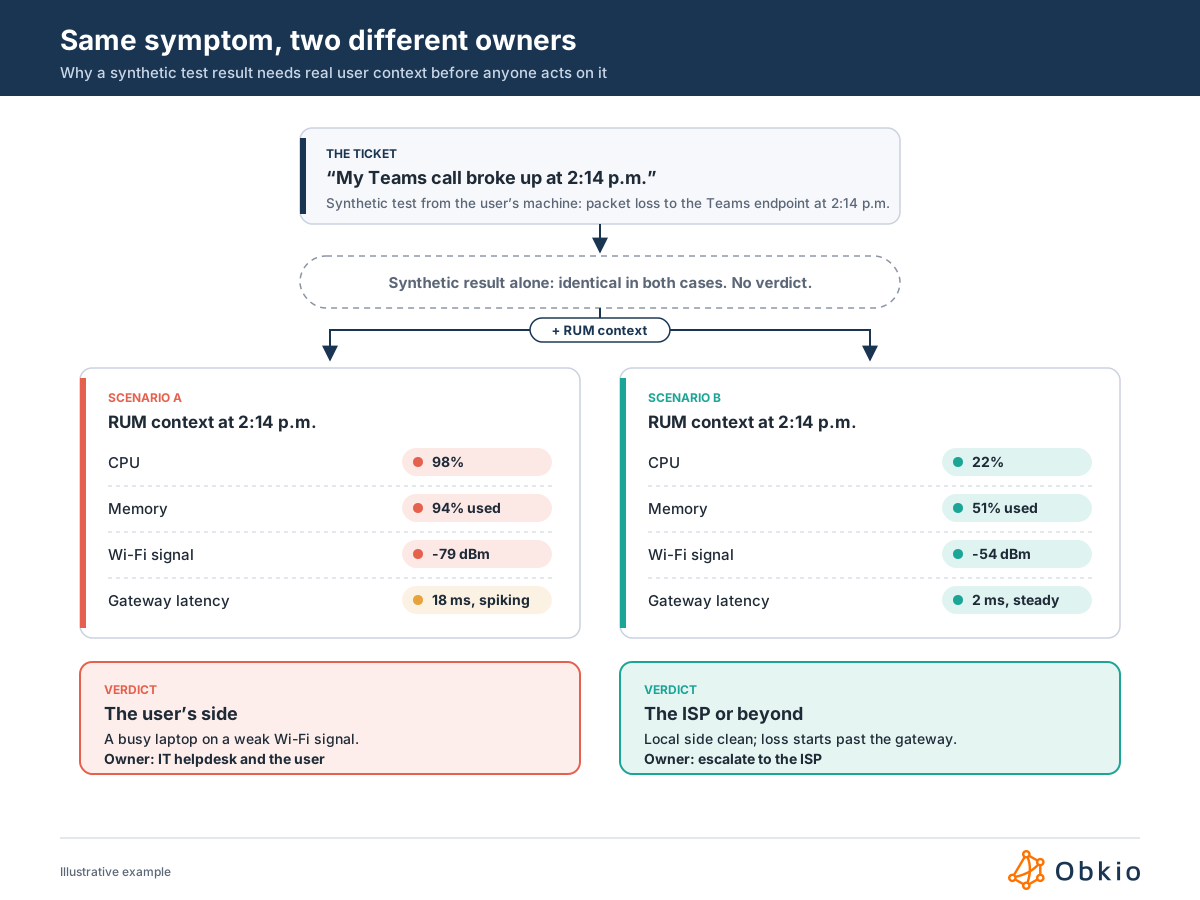
Here's how that plays out on a single ticket. A user says their Teams call broke up at 2:14 p.m. The synthetic test from their machine shows packet loss to the Teams endpoint at that minute.
- If RUM data shows the laptop's CPU at 98% and a Wi-Fi signal of -79 dBm, the cause is on the user's side: a busy machine on a weak connection.
- If RUM data shows a quiet CPU, a strong signal and gateway latency steady at 2 ms, the local side is clean, and the loss started further out, at the ISP or beyond.
Same symptom, same test result, two different owners. Without the context, both tickets look identical.
How Real User Monitoring Identifies Network, ISP or User Machine Issues
Every degraded test result raises the same question: whose problem is it? Network RUM answers it by checking the path in order, from the user's machine outward, and stopping at the first layer that isn't healthy.
Check the machine first: If CPU or memory was saturated when the test degraded, the result can't be trusted, and the slowdown the user felt most likely started on the device. The fix is on the machine: close what's hogging it, update it or replace it.
Then the local network: If the machine was healthy but gateway latency spiked, the Wi-Fi signal was weak, or DHCP or DNS failed, the problem sits between the machine and the gateway: the Wi-Fi, the home router or the office LAN.
Then the ISP and beyond: If the machine and the first hop were both clean, the problem is further out. A visual traceroute shows whether quality drops inside the ISP's network or closer to the application.
Then compare across users: One user affected points to their own setup. Everyone at one site points to that site's LAN or ISP. Every site at once points to a shared provider or the application itself.
False positives: when a busy laptop looks like an ISP outage
This is the mistake RUM context prevents most often. A test running on a saturated machine reports high latency and packet loss, exactly like a congested ISP would. Without host data, the alert fires, the ticket goes to the ISP, and the ISP finds nothing wrong. With it, IT can discount the result before anyone escalates.
Privacy: What a Real User Monitoring Tool Should (And Shouldn't) Collect
Putting an agent on employees' computers raises a fair question from staff, HR and security teams: what exactly is it watching? A good network RUM tool can answer that in one sentence. It measures how the machine and the network perform, not what the person does.
It's also worth drawing a clear line early: network RUM isn't employee monitoring software. Its job is to explain why the network feels slow, not to track productivity.
What it should collect: performance metadata only.
- Resource usage on the machine, like CPU, memory and disk load as percentages.
- Network interface status, like link speed, errors and drops.
- Connection details, like Wi-Fi or wired, signal strength, channel and SSID.
- Network measurements, like gateway latency, packet loss, jitter, and DHCP and DNS status.
What it shouldn't collect:
- The content of network traffic, or packet captures of what users send and receive.
- Browsing history, websites visited or app usage time.
- Keystrokes, screenshots or files.
- Anything used to score or rank how people work.
What to check before you deploy:
- Control by category: You should be able to turn data categories on or off, so you collect host data, LAN and Wi-Fi data, or both, depending on what you need and what your policies allow.
- Documented fields: The vendor should list every field the agent collects, in plain language your security team can review.
- Retention and access: Know how long the data is kept and who on your team can see it.
- A notice for employees: A short explanation of what's collected and why goes a long way. People are usually on board once they see it's there to fix their own complaints faster.
One detail to flag: SSIDs from home networks sometimes include a family name or address. If that's a concern, it's a good reason to choose a tool that lets you leave Wi-Fi details out.
Privacy rules for workplace monitoring vary by country and province, so loop in your legal or compliance team before a wide rollout.
Network Monitoring and Diagnostics with Obkio
Network RUM is only as useful as the path data next to it. Obkio is a network monitoring and diagnostics solution built around that path view, from the user's machine to the applications they rely on.
- Monitoring Agents run continuous synthetic tests from users' computers, offices and cloud regions, measuring latency, jitter and packet loss to gateways, public agents and the apps your team uses.
- Obkio Insights reads that data automatically and names the root cause, like an issue in your ISP's network, so you know who owns the fix.
- Visual Traceroutes show exactly where on the path quality drops.
- Network Device Monitoring polls firewalls, routers and switches over SNMP to catch overloaded devices.
- Shareable Links let you send the evidence to an ISP or a client, with no Obkio account needed on their side.
Start for free and find out where your next "it's slow" ticket really comes from.


Frequently Asked Questions About Real User Network Monitoring
What is the difference between real user monitoring and synthetic monitoring?
Synthetic monitoring sends test traffic between known points on a schedule to measure latency, jitter and packet loss. Real user monitoring measures from the devices people actually use. Network RUM combines them: it runs synthetic tests from the employee's machine and records the device and Wi-Fi conditions around each result.
Is real user monitoring the same as end user experience monitoring?
They overlap but aren't identical. End user experience monitoring is the broader goal of measuring what users experience. Real user monitoring is one way to do it. Web RUM measures website visitors in the browser, while network RUM measures employees' network performance from their own computers.
What metrics does real user monitoring collect?
Network RUM collects two layers of metrics. Host OS metrics cover CPU, memory, disk, network interface and battery. LAN and Wi-Fi metrics cover connection type, SSID, signal strength, channel, gateway latency, and DHCP and DNS status. Synthetic tests add latency, jitter and packet loss along the path.
Does real user network monitoring track what employees do on their computers?
It shouldn't. Network RUM collects performance metadata, like CPU load, Wi-Fi signal and gateway latency. It doesn't need traffic content, browsing history, keystrokes or screenshots. Choose a tool that documents every field it collects and lets you turn data categories on or off.
Can real user monitoring tell if the problem is Wi-Fi or the ISP?
Yes. If gateway latency spikes or the Wi-Fi signal is weak while the problem happens, the cause is local, between the machine and the router. If the machine and the first hop are clean but quality drops further out, the problem is at the ISP or beyond.


