Table of Contents
Table of Contents
Network Fault Monitoring detects when network devices or connections fail, alerting you when a router goes down, a link breaks, or a device stops responding. It answers the question: "Is my network up or down?"
Network Performance Monitoring measures how well your network actually performs, tracking latency, packet loss, throughput, and user experience between network endpoints. It answers: "Why is my network slow?"
The key difference: Fault monitoring tells you when something breaks. Performance monitoring tells you when something degrades before users complain.
When users report network issues, they typically describe two problems: "the network is down" or "the network is slow." Network Fault Monitoring handles the first scenario: detecting outages and device failures through binary up/down status checks. But the second scenario requires Network Performance Monitoring to measure actual user experience with metrics like latency (measured in milliseconds), packet loss (as a percentage), and application response times.
Most organizations need both approaches. Network Fault monitoring provides immediate alerts when critical infrastructure fails. Performance monitoring identifies degradation patterns that fault tools miss entirely, like a network connection that's technically "up" but delivering 300ms latency instead of the expected 50ms, causing VoIP calls to break up and applications to timeout.
This article compares both monitoring approaches, explains when to use each, and shows why network performance monitoring has become essential for modern networks where user experience matters more than simple device availability.
Modern networks face challenges that fault monitoring alone cannot address:
- Cloud applications require end-to-end performance visibility beyond your network perimeter
- Remote workers experience performance issues that never trigger fault alerts
- SD-WAN and hybrid networks need continuous performance measurement across multiple paths
- VoIP and video conferencing demand specific latency and jitter thresholds (under 150ms for quality calls)
- SLA compliance requires proof of performance, not just uptime
Understanding the distinction between fault and performance monitoring helps you choose the right tool for your specific network challenges—or recognize when you need both working together.
When it comes to monitoring, it seems like everyone has his own idea of what it is, or what it should be.
Fortunately, this is not so much the case with Network Fault Monitoring and pretty much everyone agrees on what it is.
Network Fault Monitoring is a process or system that involves monitoring and detecting faults or abnormalities in a computer network. It aims to identify and address network issues promptly to ensure the smooth operation of the network and minimize downtime.
The primary purpose of network fault monitoring is to proactively identify and resolve problems in the network infrastructure. It involves monitoring various network components such as routers, switches, servers, firewalls, and other devices to detect any anomalies or deviations from normal operation.
- Connectivity issues: This includes detecting network outages, link failures, or intermittent connection problems.
- Performance degradation: Monitoring systems can identify network bottlenecks, high latency, packet loss, or slow response times.
- Device failures: Fault monitoring helps in identifying hardware or software failures in network devices such as routers or switches.
- Security breaches: Monitoring systems can detect unauthorized access attempts, unusual network traffic patterns, or potential security breaches.
- Configuration errors: Identifying misconfigurations or improper settings in network devices that can lead to network disruptions or network disconnections.
Network fault monitoring operates on a centralized hub-and-spoke architecture where a central monitoring server continuously polls network devices to verify they remain operational and responsive.
Step 1: Device Discovery and Enrollment Administrators configure the monitoring system with IP addresses or hostnames of devices to monitor—routers, switches, firewalls, servers. The system establishes baseline connectivity and determines which protocols each device supports (SNMP, ICMP, SSH).
Step 2: Continuous Polling The monitoring server sends regular status queries to each enrolled device:
- SNMP polling: Queries device status every 1-5 minutes using SNMP GET requests
- ICMP ping tests: Sends ping packets every 30-60 seconds to verify reachability
- Port checks: Tests that critical services (HTTP port 80, HTTPS port 443) respond
Step 3: Passive Alert Collection Simultaneously, the system listens for unsolicited alerts:
- SNMP traps: Devices proactively send alerts when errors occur (interface down, high CPU)
- Syslog messages: Network devices forward error logs to the central collector
- Flow data: Analyzes NetFlow or sFlow for anomalous traffic patterns
Step 4: Fault Detection The system identifies faults when:
- A device stops responding to ping requests (3 consecutive failures)
- SNMP polling receives timeout errors or SNMP agent unreachable responses
- Devices send SNMP traps reporting critical events (link down, power supply failure)
- Syslog entries contain error-level messages indicating failures
- Interface counters show excessive CRC errors or packet drops
Step 5: Alert Generation When faults are detected, the system generates notifications:
- Severity classification: Critical (device down), warning (high CPU), informational (configuration change)
- Alert details: Device name, fault type, timestamp, affected interfaces
- Notification delivery: Email alerts, SMS messages, dashboard updates, ticketing system integration
Step 6: Administrator Response Network administrators receive alerts and investigate:
- Access device console or management interface remotely
- Review error logs to determine root cause
- Execute diagnostic commands (show interface status, show system health)
- Implement fixes (reload device, replace failed component, restore configuration)
SNMP (Simple Network Management Protocol) The industry standard for network device monitoring. SNMP enables monitoring systems to query device status (GET requests), receive unsolicited alerts (SNMP traps), and modify configurations (SET requests). SNMP versions 2c and 3 provide authentication and encryption for secure monitoring.
ICMP (Internet Control Message Protocol) The foundation of ping tests. ICMP echo requests verify basic network reachability and measure round-trip response times. While limited in diagnostic capability, ICMP requires no device configuration and works across all IP-enabled devices.
Syslog Protocol Enables centralized log collection from network devices. Devices forward system messages, error logs, and event notifications to a central syslog server. Administrators can search historical logs, correlate events across devices, and identify patterns preceding failures.
NetFlow/sFlow Flow-based monitoring protocols that analyze traffic patterns. While primarily used for bandwidth analysis, flow data can detect anomalies like sudden traffic drops indicating link failures or unusual traffic patterns suggesting security incidents.
There are two main types of Network Fault Monitoring: Active and Passive.
Passive Network Fault Monitoring works by collecting alerts from networking devices (often sent using SNMP traps) which are raised whenever something abnormal happens.
This type of Network Fault Monitoring relies on the networking devices themselves to identify faults and notify a centralized monitoring system.
In a way, a passive Network Fault Monitoring system is simply a glorified notification system that can send various types of notifications based on the detected faults.
The main drawback of such systems is that a complete failure of a piece of equipment will often result in its inability to send out an alert and the problem might fail to be quickly detected.
Unlock the secrets of network monitoring basics in this article. Dive into everything you need to get started with ease – it's not rocket science!
Learn more

Active Network Fault Monitoring was invented to address the shortcomings of the passive approach. Instead of relying on devices to report faults, it actively (hence the name) monitors them.
It will, for instance, use ping to ensure that devices are up and that they can be reached, and raise an alarm whenever something abnormal is detected such as, a device that no longer responds.
It is just as centralized as passive Network Fault Monitoring; as all tests are typically performed from the centralized monitoring system.
Network Fault Monitoring focuses on device availability and binary status checks. Your fault monitoring system should track these critical infrastructure components:
- Routers: Edge routers, core routers, branch routers - monitor uptime and reachability
- Switches: Core switches, access switches, distribution layer switches - track operational status
- Firewalls: Perimeter firewalls, internal firewalls, next-gen firewalls - verify responsiveness
- Load balancers: Application delivery controllers, traffic distributors - confirm active status
- Wireless access points: Enterprise WAPs, controller status - monitor connectivity
- WAN links: MPLS circuits, point-to-point links, metro Ethernet - detect link failures
- Internet circuits: Primary and backup Internet connections - verify carrier connectivity
- VPN tunnels: Site-to-site VPNs, remote access VPN concentrators - monitor tunnel status
- Fiber connections: Building entry points, inter-floor connections - identify physical failures
- DNS servers: Internal and external DNS - ensure name resolution availability
- DHCP servers: IP address assignment services - verify lease distribution capability
- Domain controllers: Active Directory infrastructure - monitor authentication services
- Email servers: On-premises Exchange or mail gateways - track service availability
- File servers: Network-attached storage, file shares - confirm accessibility
- SNMP traps: Passive alerts from devices reporting faults
- ICMP ping tests: Active polling to verify device reachability
- Syslog monitoring: Error and event log collection from network devices
- SNMP polling: Regular status checks of device health indicators
- Port monitoring: TCP/UDP port availability for critical services
- Device uptime percentage: Calculate availability for SLA reporting (99.9%, 99.99%)
- Link status: Interface up/down state changes
- Error counters: CRC errors, frame errors, collision rates on interfaces
- Device health: CPU over 90%, memory over 85%, temperature warnings
- Power supply status: Redundant power supply failures in critical devices
The best type of Network Fault Monitoring is, of course, one that combines both active and passive Network Fault Monitoring approaches, which can provides several advantages for effective network management. Here are some key advantages of implementing fault monitoring:
Rapid Failure Detection: Fault monitoring identifies device and link failures within seconds of occurrence. When a router crashes or a circuit goes down, SNMP traps or failed ping responses trigger immediate alerts, enabling IT teams to respond before widespread user impact.
Simple Implementation Deploying fault monitoring requires minimal infrastructure—typically a single monitoring server that polls devices using standard protocols (SNMP, ICMP). No distributed agents or complex configurations needed. Setup time ranges from hours to days, not weeks.
Low Cost Entry Point: Fault monitoring tools cost significantly less than performance monitoring solutions. Many network devices include basic fault monitoring capabilities built-in, and open-source options (Nagios, Zabbix) provide free alternatives for budget-conscious organizations.
Clear Status Reporting: Binary up/down status provides unambiguous reporting. Devices either respond or don't respond—no interpretation required. This clarity simplifies compliance reporting and availability SLA calculations (99.9% uptime is easily proven).
Minimal Network Overhead: Fault monitoring consumes minimal bandwidth. SNMP polling and occasional ping tests generate negligible traffic compared to continuous synthetic monitoring. This matters in bandwidth-constrained environments or when monitoring hundreds of devices.
Established Standards: SNMP has been the industry standard for decades. Nearly every network device supports SNMP monitoring out of the box, ensuring compatibility across multi-vendor environments without custom integrations.
While network fault monitoring offers numerous benefits, there are also some potential disadvantages associated with its implementation. Here are a few:
Cannot Detect Performance Degradation: Fault monitoring's critical limitation: devices report "UP" while delivering unusable performance. A connection experiencing 500ms latency and 5% packet loss still responds to pings, generating no alerts while users experience severe problems.
No User Experience Visibility: Fault monitoring measures device status, not user experience. When users complain that "Salesforce is slow" or "Teams calls are choppy," fault monitoring provides no diagnostic data because nothing has failed. All devices show green status.
Limited Troubleshooting Value: Knowing a device is down identifies the problem location but not the root cause. Fault monitoring can't distinguish between power failures, configuration errors, hardware defects, or upstream provider issues—it only confirms something stopped responding.
Reactive Rather Than Proactive: Fault monitoring alerts you after complete failure occurs. It cannot predict impending issues, identify degradation trends, or warn administrators before problems impact users. You discover failures simultaneously with users, not before.
False Positives and Alert Fatigue: Temporary network glitches, momentary packet loss, or brief device unresponsiveness trigger alerts even when no real problem exists. High false positive rates lead to alert fatigue, where administrators ignore or delay responding to genuine failures.
No Service Provider Visibility: Fault monitoring only tracks devices you control. When performance issues originate in your ISP's network or a cloud provider's infrastructure, fault monitoring offers no diagnostic data. The circuit shows "UP" with no insight into degrading performance.
Missing Context for Prioritization: When multiple devices fail simultaneously, fault monitoring generates multiple alerts with equal priority. It doesn't indicate which failure causes the most user impact or which requires immediate attention versus deferred maintenance.
Learn about network performance monitoring to optimize network performance. Discover key network metrics, tools & techniques & the benefits for businesses.
Learn more

As much as Network Fault Monitoring was clearly defined, things are not so clear with Network Performance Monitoring (also called NPM).
Network Performance Monitoring or NPM refers to the end-to-end monitoring of network performance and end-user experience. It differs from traditional monitoring because performance is monitored from the end-user perspective, and is measured between two points in the network.
For example:
- The performance between a user, who works in the office, and the application they use in the company’s data center
- The performance between two offices in a network
- The performance between the head office and the Internet
- The performance between your users and the cloud
The goal of network performance monitoring is to ensure that the network is operating efficiently and effectively and to identify and address both network availability issues (hard issues) or network performance issues (soft issues) that may arise. This typically involves collecting data on network traffic, bandwidth, latency, and packet loss, and other key network metrics, as well as using various tools and techniques to analyze and interpret this data.
Some vendors of bandwidth usage monitoring tools will claim their tool is a Network Performance Monitoring tool. To a certain extent, they are right.
After all, available bandwidth is a valid measure of a network’s performance. But there are other network metrics that you should also be measuring.

Like with Fault Monitoring, there are also various different types of Network Performance Monitoring that use different performance monitoring techniques to measure network performance and identify network issues.
Some of those types include:
- Passive Network Performance Monitoring Tools: Passive network performance monitoring tools collect and analyze data on network traffic as it flows through the network.
- Active Network Performance Monitoring Tools: Active network performance monitoring tools monitor network performance by sending data packets across the network to simulate user traffic and test network performance.
- SNMP-Based Network Monitoring Tools: SNMP-based network monitoring tools use the Simple Network Management Protocol (SNMP Network Monitoring) to monitor and manage network devices.
- Application Performance Monitoring (APM) Tools: Application Performance Monitoring (APM) tools are software programs designed to monitor the performance and availability of applications in real-time.
- Synthetic Network Performance Monitoring Tools: Synthetic Network Performance Monitoring tools are designed to simulate user behavior on a network to measure network performance.
- Network Packet Analyzer Tools: Network packet analyzers, also known as packet sniffers, protocol analyzers, or network analyzers, capture and analyze the network packets sent and received over a network.
- Flow-Based Network Monitoring Tools: Flow-based network monitoring tools collect information about network traffic by analyzing flow data.
A network performance monitoring tool works by continuously monitoring various aspects of a computer network to assess its health, performance, and availability. The tool collects data from network devices, analyzes the information, and provides administrators with insights and metrics related to network performance.
Regardless the type of Network Performance Monitoring tool you choose, there are certain similarities in the way the NPM tools work:
 Diagram showing how Obkio's Network Performance Monitoring Tool works
- Data Collection: The monitoring tool interacts with network devices and infrastructure to gather relevant data. It can use Synthethic Traffic, network monitoring protocols like Simple Network Management Protocol (SNMP), flow-based protocols (e.g., NetFlow, sFlow), packet analysis, or other methods to collect data. The tool collects information such as bandwidth utilization, latency, packet loss, device CPU usage and memory usage, error rates, and other performance metrics.
- Data Analysis: Once the monitoring tool collects the network data, it analyzes the information to generate meaningful insights and metrics. This analysis can involve evaluating historical trends, comparing current performance against predefined thresholds, identifying patterns, and detecting anomalies or deviations from normal behavior. The analysis may also include correlating data from multiple devices or segments to provide a holistic view of network performance.
- Visualization and Reporting: Network performance monitoring tools present the analyzed data in user-friendly dashboards and reports. These visualizations can include charts, graphs, tables, and other representations that provide a clear overview of the network's performance. Administrators can access real-time or historical data, drill down into specific devices or metrics, and customize the display based on their requirements. The reporting feature enables the generation of regular reports for monitoring network health, SLA compliance, or historical performance analysis.
- Alerting and Notifications: Network performance monitoring tools incorporate alerting mechanisms to notify administrators about potential issues or deviations from normal performance. Administrators can configure thresholds for various metrics, and when those thresholds are exceeded or specific conditions are met, the monitoring tool generates alerts. Alerts can be sent via email, SMS, or other notification channels to inform administrators about critical events, allowing them to take prompt action.
- Troubleshooting and Root Cause Analysis: When performance issues occur, network performance monitoring tools provide valuable insights for troubleshooting and root cause analysis. The tool can help identify the specific device, link, or segment experiencing performance degradation, and provide relevant data and metrics to aid in problem identification. With this information, administrators can investigate the underlying causes, make informed decisions, and implement appropriate remediation measures.
Network Performance Monitoring measures actual user experience and network quality between endpoints. Your performance monitoring system should track these critical metrics and paths:
- Latency (Round-Trip Time): Measure in milliseconds between endpoints
- Acceptable: 20-50ms for local/regional connections
- Warning: 100-150ms for most applications
- Critical: Over 150ms for VoIP, over 300ms for general use
- Packet loss: Percentage of packets that fail to reach destination
- Acceptable: Under 0.5% for most applications
- Warning: 0.5-1% causes noticeable degradation
- Critical: Over 1% significantly impacts performance, over 3% causes VoIP failures
- Jitter: Variation in packet delay, critical for real-time applications
- Acceptable: Under 10ms for excellent VoIP quality
- Warning: 10-30ms may cause minor quality issues
- Critical: Over 30ms causes choppy audio, over 50ms makes calls unusable
- Throughput: Actual data transfer rate achieved between endpoints
- Compare against circuit capacity to identify network congestion
- Measure upload and download speeds independently
- MOS (Mean Opinion Score): Voice quality rating from 1-5
- Acceptable: 4.0 or higher for business VoIP
- Warning: 3.5-4.0 indicates degrading quality
- Critical: Under 3.5 produces poor call quality
- Office to data center: Internal application access, file server connectivity
- Office to Internet: Cloud application access, web browsing, SaaS performance
- Office to cloud providers: AWS, Azure, Google Cloud, Microsoft 365, Salesforce
- Site-to-site connections: Branch offices to headquarters, multi-site WAN performance
- Remote worker connections: Home offices, remote locations to corporate resources
- Data center to data center: Replication traffic, disaster recovery paths
- VoIP and UC platforms: Monitor latency under 150ms, jitter under 30ms, packet loss under 1%
- Video conferencing: Track Zoom, Teams, WebEx performance - require under 100ms latency
- Cloud applications: Salesforce, Microsoft 365, ServiceNow - measure response times
- Virtual desktop infrastructure (VDI): Citrix, VMware Horizon - monitor user experience metrics
- Database connections: Application-to-database latency, query response times
- Backup and replication: After-hours performance during data transfer windows
- LAN performance: Inter-VLAN routing, internal network quality
- WAN performance: MPLS, SD-WAN paths, point-to-point circuits
- Internet performance: ISP quality, bandwidth consistency, routing efficiency
- Wireless networks: WiFi performance in different building areas
- Service provider networks: Carrier performance beyond your network edge
- Path visualization: Hop-by-hop latency through network segments
- Bandwidth utilization trends: Identify network congestion patterns over time
- Performance baselines: Establish normal ranges to detect anomalies
- SLA compliance tracking: Document provider performance against contracts
- Historical trending: Week-over-week, month-over-month performance analysis
- Proactive alerts: Threshold breaches before complete degradation occurs
- Real-time monitoring: Tests every 500ms to 1 second for immediate detection
- Standard monitoring: Tests every 5-10 seconds for general performance tracking
- Scheduled testing: On-demand tests for troubleshooting or validation

Network Performance Monitoring (NPM) offers several advantages for effectively managing and optimizing computer networks. Here are some key advantages of implementing NPM:
Detects Degradation Before Failure: Performance monitoring identifies problems while devices still function. Gradual latency increases from 30ms to 150ms over several days trigger alerts before reaching critical thresholds, enabling proactive intervention before user impact.
Measures Actual User Experience: Performance monitoring tracks the metrics users care about: application response times, VoIP call quality, video conferencing stability. You measure real user experience, not just device availability, aligning IT metrics with business objectives.
Pinpoints Root Cause Location: End-to-end performance measurement identifies exactly where problems occur—your LAN, WAN, ISP network, or cloud provider infrastructure. Hop-by-hop visibility shows whether latency increases at your firewall, your carrier's router, or the application server.
Service Provider Accountability: Performance monitoring provides concrete evidence when providers fail to meet SLA commitments. Document that your ISP delivers 200ms latency instead of contracted 50ms maximum, supporting escalations and potential service credits.
Proactive Capacity Planning: Historical performance data reveals utilization trends and growing bandwidth demands. Identify when circuits approach capacity before users experience slowness, scheduling upgrades during planned maintenance windows rather than emergency responses.
Validates Network Changes: Before and after measurements prove whether infrastructure changes (new circuits, SD-WAN deployment, QoS configurations) actually improve performance. Replace subjective assessments with objective metrics showing 120ms latency reduction.
Supports Modern Applications: Cloud applications, VoIP, video conferencing, and VDI require specific performance thresholds. Performance monitoring ensures these latency-sensitive applications receive adequate network quality, measuring jitter, MOS scores, and packet loss rates.
Reduces MTTR (Mean Time to Repair): Specific performance metrics accelerate troubleshooting. Instead of hours testing hypotheses, administrators immediately see "packet loss increased to 3% on the ISP connection at 2:15 PM," directing investigation to the exact problem source.
Continuous Visibility Performance monitoring tests network quality constantly (every 500ms to few seconds), providing real-time awareness. Intermittent problems that occur outside business hours or last only minutes get detected and recorded for analysis.
Overall, Network Performance Monitoring offers significant advantages by providing real-time visibility, proactive issue detection, rapid troubleshooting, capacity planning, improved network performance, enhanced security, and compliance support. By leveraging NPM tools, organizations can optimize their network infrastructure, ensure efficient operations, and deliver a seamless user experience.
So now that we know a little about both monitoring techniques seperately, how do they compare, and which should you use?
Network Fault Monitoring (NFM) and Network Performance Monitoring (NPM) are two key aspects of network management that play distinct but complementary roles. While NFM focuses on identifying and resolving faults or abnormalities that can cause disruptions in the network infrastructure, NPM is dedicated to monitoring and optimizing network performance to ensure efficient operations and a seamless user experience.
- Network Fault Monitoring alerts you when devices or links fail (binary: up/down).
Network Performance Monitoring measures actual user experience with metrics like latency (20-50ms), packet loss (<1%), and throughput.
Use Fault Monitoring when: You need to know if a router is down
- Use Performance Monitoring when: Users report "the network is slow" but nothing is down
Operates from a &&single central monitoring server&& that polls all devices. The hub-and-spoke model simplifies management—one console tracks everything—but provides no visibility into network paths or segments between the monitoring server and target devices. If your monitoring server successfully pings a remote office router, you know the router responds, but you learn nothing about the quality of the connection between locations.
Deploys distributed monitoring agents at multiple network locations (offices, data centers, cloud regions). Agents actively test network paths between endpoints, measuring the actual performance users experience. This distributed approach provides end-to-end visibility across segments you don't control, including ISP networks and cloud provider infrastructure.
Evaluates device status in binary terms: a device either responds (UP) or doesn't respond (DOWN). No middle ground exists. A router experiencing 500ms latency and 5% packet loss still responds to pings and SNMP queries, reporting "UP" status while delivering unusable performance.
Continuously measures actual network quality: 28ms latency, 0.2% packet loss, 450 Mbps throughput. Granular metrics reveal degradation long before complete failure. When latency gradually increases from 30ms to 120ms over several days, performance monitoring identifies the trend and alerts administrators before users experience problems.
- Device reachability: Does the device respond to ping?
- Service availability: Are critical TCP/UDP ports accepting connections?
- Interface status: Are network interfaces administratively up?
- System health: CPU usage, memory consumption, temperature
- Error counters: CRC errors, frame errors on interfaces
- Latency: Round-trip time in milliseconds between endpoints
- Packet loss: Percentage of packets that fail to arrive
- Jitter: Variation in packet delay for real-time applications
- Throughput: Actual data transfer rate achieved
- MOS scores: Voice quality measurements for VoIP
- Path visualization: Hop-by-hop performance through the network
Learn how to measure network performance with key network metrics like throughput, latency, packet loss, jitter, packet reordering and more!
Learn more

- A device stops responding to three consecutive ping attempts
- SNMP queries return timeout errors
- Devices send SNMP traps reporting critical events (link down, power failure)
- Interface status changes from up to down
- System resources exceed critical thresholds (CPU >95%, memory >90%)
- Latency exceeds configured thresholds (e.g., >100ms when baseline is 30ms)
- Packet loss rises above acceptable levels (>1% for most applications)
- Jitter impacts real-time application quality (>30ms for VoIP)
- Throughput drops below expected rates indicating congestion
- Performance degrades gradually over time compared to established baselines
Identifies which device failed but provides limited diagnostic data. When a router goes down, fault monitoring confirms the failure location. It cannot determine whether the cause is a power outage, hardware failure, configuration error, or upstream provider issue. Administrators must manually investigate to determine root cause.
Pinpoints exactly where performance degrades along the network path. Hop-by-hop measurement reveals whether latency increases at your firewall (indicating local congestion), your ISP's first router (provider network issue), or the cloud application server (destination problem). This specificity dramatically reduces mean time to repair.
- Overnight and weekend monitoring when IT staff isn't actively watching networks
- Hardware failure detection requiring immediate response (core switch failure)
- SLA reporting focused on uptime percentage (99.9% availability)
- Budget-constrained environments needing basic visibility
- Simple environments with limited cloud application dependencies
- VoIP and video conferencing quality management
- Cloud application performance optimization (Salesforce, Microsoft 365)
- Remote worker support and troubleshooting
- SD-WAN path selection validation
- Service provider SLA compliance verification
- Proactive detection before user complaints
- Troubleshooting "network is slow" problems
The fundamental distinction becomes clear in real-world scenarios: Fault monitoring answers "Is it working?" while performance monitoring answers "How well is it working?"
When users complain about slow Salesforce but fault monitoring shows all devices online, you face a diagnostic dead end. Fault monitoring confirms connectivity exists but provides no data about the quality of that connectivity. Performance monitoring immediately shows 200ms latency spikes and 1.5% packet loss on the path to Salesforce servers—the specific metrics needed to diagnose and resolve the issue.
This distinction explains why most organizations ultimately deploy both approaches: fault monitoring for immediate failure alerting and availability reporting, performance monitoring for user experience optimization and quality assurance.
While there is some overlap between Network Fault Monitoring and Network Performance Monitoring, they have distinct focuses and objectives. NFM emphasizes fault detection and resolution to ensure and test network stability, while NPM focuses on monitoring and optimizing performance to enhance user experience and network efficiency.
These monitoring approaches complement rather than compete with each other. Fault monitoring provides essential infrastructure visibility—you must know immediately when critical devices fail. Performance monitoring adds the user experience layer—you must know when networks deliver poor quality even while devices remain operational.
Organizations typically implement fault monitoring first (lower cost, simpler deployment) and add performance monitoring as they adopt latency-sensitive applications (VoIP, video, cloud applications) or experience troubleshooting challenges that fault monitoring cannot resolve. The most effective network management strategies leverage both tools to achieve complete visibility from infrastructure status through user experience quality.
Upgrade your network management strategy with Obkio's advanced Network Performance Monitoring tool. Gain comprehensive visibility into your network infrastructure, optimize performance, and deliver a seamless user experience.

With real-time monitoring, proactive alerts, and powerful analytics, Obkio empowers you to go beyond fault detection and focus on optimizing your network's performance. Boost productivity, minimize downtime, and ensure efficient delivery of applications and services.
And unlock the full potential of your network!
- 14-day free trial of all premium features
- Deploy in just 10 minutes
- Monitor performance in all key network locations
- Measure real-time network metrics
- Identify and troubleshoot live network problems

Network Fault Monitoring excels at protecting infrastructure availability and detecting hard failures. Deploy fault monitoring when your primary concern is knowing immediately when critical network components stop functioning.
Use Network Fault Monitoring for:
When uptime is your primary SLA metric, fault monitoring provides binary status reporting that clearly documents when devices go offline. This matters for compliance reporting, vendor accountability, and availability-based SLAs that measure "five nines" (99.999%) uptime.
Fault monitoring detects when routers, switches, firewalls, or servers become completely unresponsive. If a core switch loses power or a router's operating system crashes, fault monitoring alerts you within seconds through SNMP traps or failed ping responses.
When fiber cuts, cable disconnections, or circuit failures occur, fault monitoring immediately flags the affected connections. This binary detection works well for identifying which specific link in your network has physically failed.
For small IT teams that can't monitor networks 24/7, fault monitoring provides essential overnight and weekend coverage. When a critical device goes down at 2 AM, fault monitoring ensures someone gets alerted to respond.
Organizations with limited monitoring budgets often start with fault monitoring because it requires minimal infrastructure—typically just a single monitoring server polling devices. Setup costs and ongoing maintenance remain relatively low.
Fault monitoring cannot detect performance degradation, identify the source of slowness, measure user experience quality, or pinpoint issues in service provider networks. A device can report "UP" status while delivering 500ms latency that makes applications unusable.
Network Performance Monitoring becomes essential when user experience matters more than simple device availability. Deploy performance monitoring when you need to measure, optimize, and prove network quality.
Use Network Performance Monitoring for:
Voice and video applications require specific performance thresholds: under 150ms latency, under 30ms jitter, and under 1% packet loss. Performance monitoring measures these metrics continuously and alerts you when calls will sound garbled or video will freeze—even when all devices show "UP" status.
When your users access Salesforce, Microsoft 365, or AWS applications, performance monitoring measures the actual experience from your office to the cloud provider. You can identify whether slowness originates in your network, your ISP, or the cloud provider's infrastructure.
With distributed workforces, performance monitoring deployed at remote locations tracks home office and branch office network quality. You can proactively identify when a remote worker's Internet connection degrades before they complain about Zoom quality.
SD-WAN solutions automatically route traffic across multiple Internet connections based on performance. Performance monitoring validates that your SD-WAN is working correctly and provides the data needed to optimize path selection policies.
Performance monitoring identifies degradation patterns before complete failures occur. When latency gradually increases from 30ms to 150ms over several days, performance monitoring catches the trend and alerts you to investigate before users experience problems.
When you purchase Internet circuits or MPLS connections with performance SLAs, performance monitoring provides the data to hold providers accountable. You can document when your provider delivers 200ms latency instead of the contracted 50ms maximum.
When users report slowness but fault monitoring shows all devices online, performance monitoring identifies the actual problem: packet loss on a specific segment, high latency through your ISP, or jitter affecting real-time applications.
Performance monitoring data helps you optimize application delivery by identifying bottlenecks, validating QoS configurations, and proving whether network performance meets application requirements.
Performance monitoring detects issues that fault monitoring misses entirely—the degradation, slowness, and quality problems that frustrate users while devices report healthy status.
In practice, both NFM and NPM are often used together as part of a comprehensive network management strategy. NFM addresses immediate faults and stability concerns, while NPM focuses on ongoing performance optimization. The combination of both techniques allows for proactive management, swift issue resolution, and the maintenance of a reliable and high-performing network infrastructure.
Understanding the practical difference between these monitoring approaches becomes clear when examining actual network problems IT teams face daily.
Sales team reports that Salesforce takes 15-20 seconds to load records, but your network dashboard shows all devices online with green status indicators.
- Fault Monitoring Response: All routers, switches, and firewalls report operational status. Your ISP circuit shows "UP" and responding to pings. No alerts triggered. The monitoring system provides no actionable information because nothing has failed.
- Performance Monitoring Response: Identifies 200ms average latency spikes occurring every 30 seconds on the path to Salesforce servers, with packet loss reaching 1.2% during peak hours. The performance data pinpoints the issue to a congested ISP peering connection, providing evidence to escalate with your provider.
Resolution Time: Fault monitoring cannot diagnose this issue. Performance monitoring identifies the root cause within minutes, reducing troubleshooting from hours to minutes.
Executives complain about choppy audio, echo, and dropped calls during important client meetings. IT checks the phone system and network—everything appears functional.
- Fault Monitoring Response: PBX server is online. Network switches are operational. SIP trunk shows active. Fault monitoring confirms devices are "UP" but offers no insight into why calls sound poor.
- Performance Monitoring Response: Reveals jitter levels at 45ms (threshold: 30ms) and latency averaging 180ms (threshold: 150ms for quality VoIP). The data shows performance degradation occurs specifically during video conference traffic bursts, indicating insufficient QoS prioritization.
Resolution Time: Without performance data, IT might spend days replacing handsets, reconfiguring the PBX, or arguing with the carrier. Performance monitoring identifies the QoS misconfiguration immediately, enabling resolution within hours.
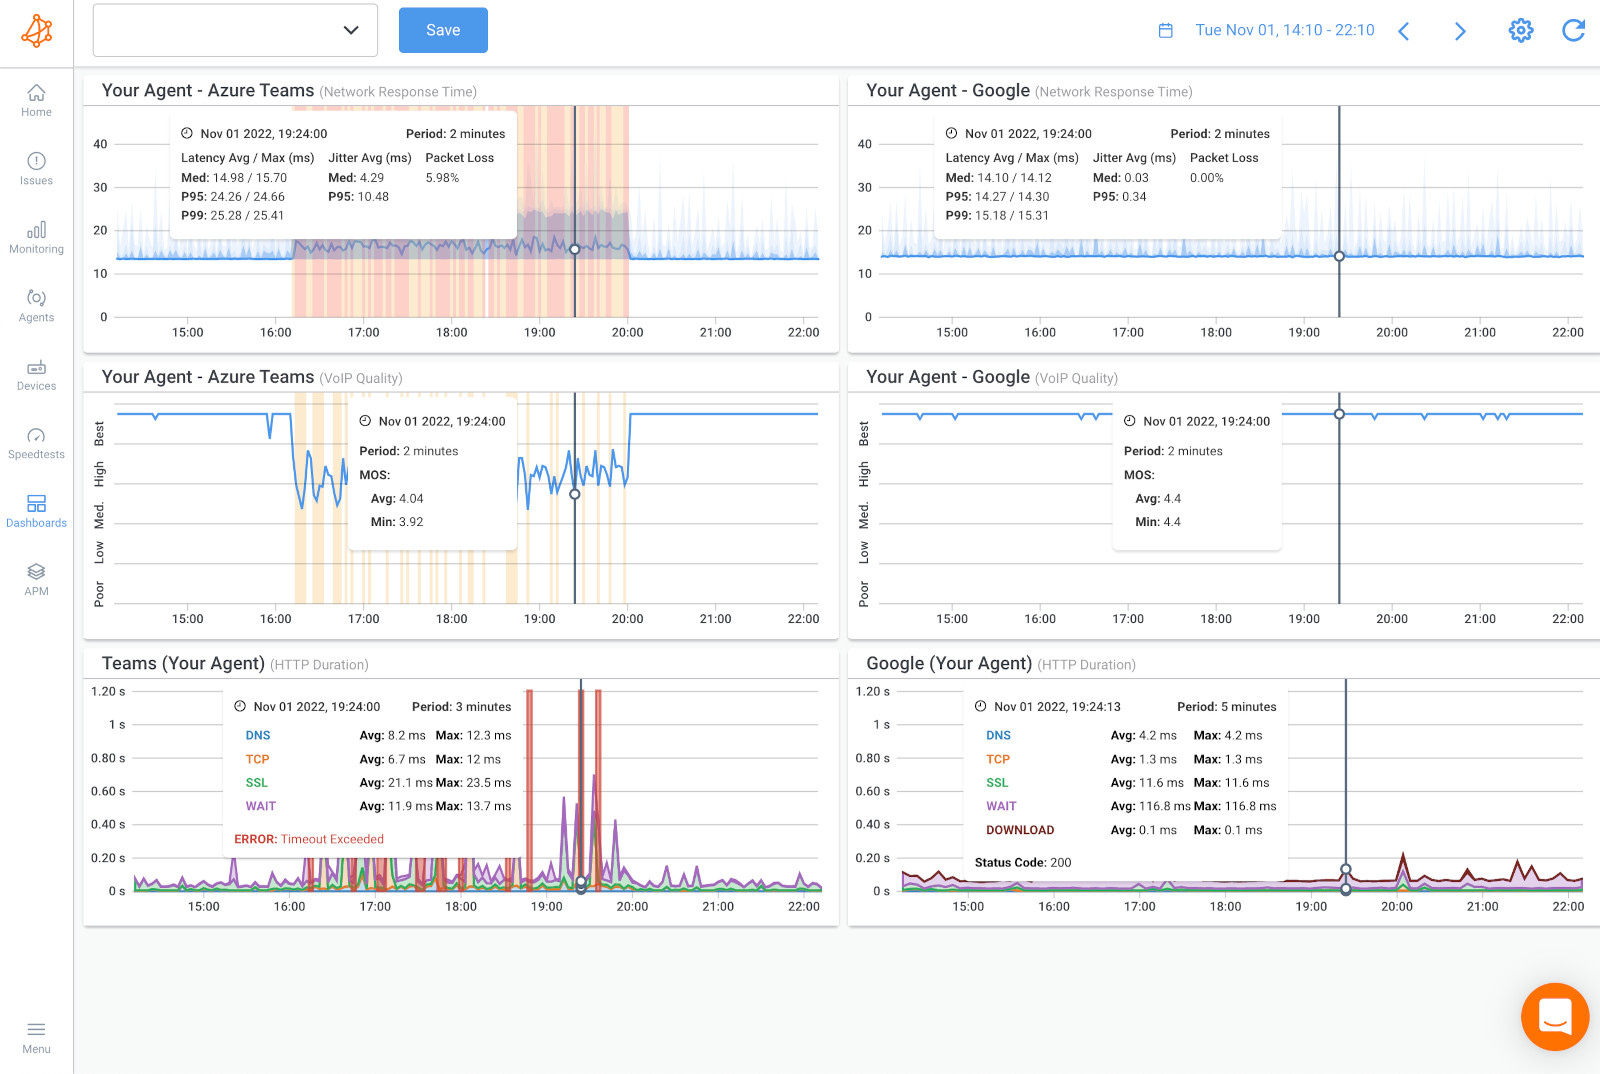
 Screenshot from Obkio's Network Performance Monitoring Tool
Remote employee reports that Microsoft Teams meetings freeze constantly and VPN disconnects multiple times daily. Local IT cannot reproduce the issue from the office.
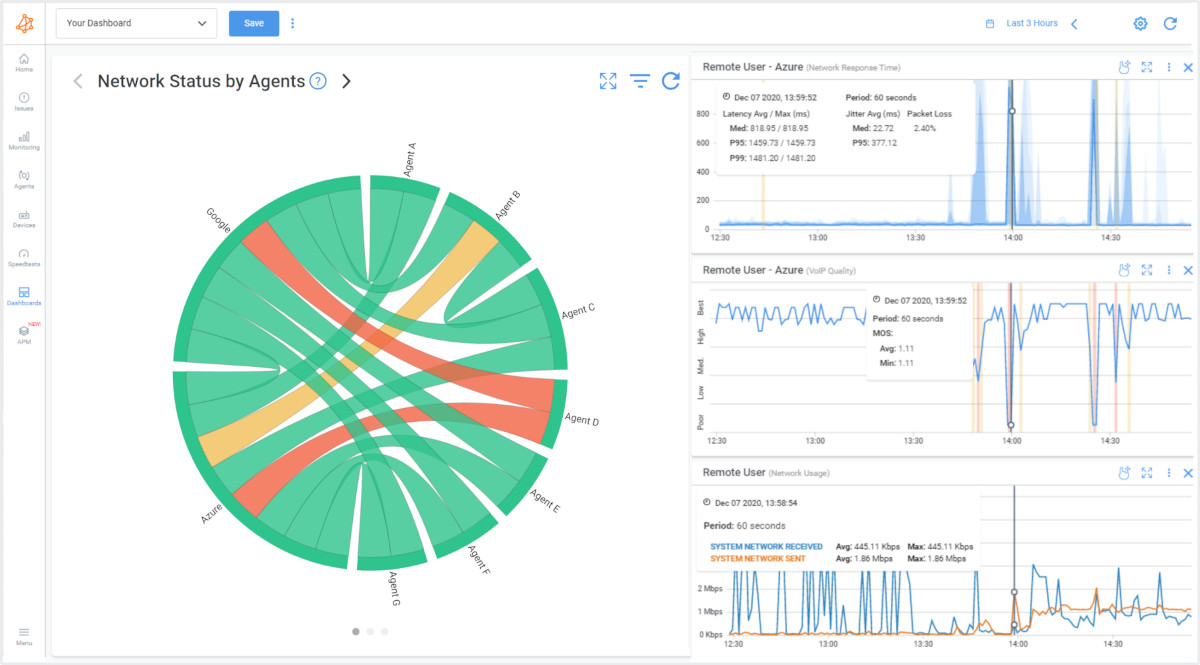
- Fault Monitoring Response: Office network performance shows all devices operational. VPN concentrator is online and accepting connections. Fault monitoring sees successful authentication logs but cannot measure the remote worker's actual network experience.
- Performance Monitoring Response: Agent deployed at the remote location measures 8% packet loss and 300ms latency on the home Internet connection during business hours. Performance graphs correlate the disconnections with severe packet loss events, proving the issue originates with the employee's ISP, not the corporate network.
Resolution Time: Without performance monitoring, this becomes a finger-pointing exercise between IT, the VPN vendor, and the home ISP. Performance data provides definitive proof, enabling the remote worker to escalate effectively with their Internet provider.
 Screenshot from Obkio's Network Performance Monitoring Tool
Company implements SD-WAN with primary fiber and backup cable Internet for redundancy. Users report intermittent application slowness despite SD-WAN showing both circuits "active."
- Fault Monitoring Response: Both Internet circuits respond to ping tests. SD-WAN controller shows both paths available. Fault monitoring confirms devices are reachable but cannot detect that the cable backup circuit delivers inconsistent performance.
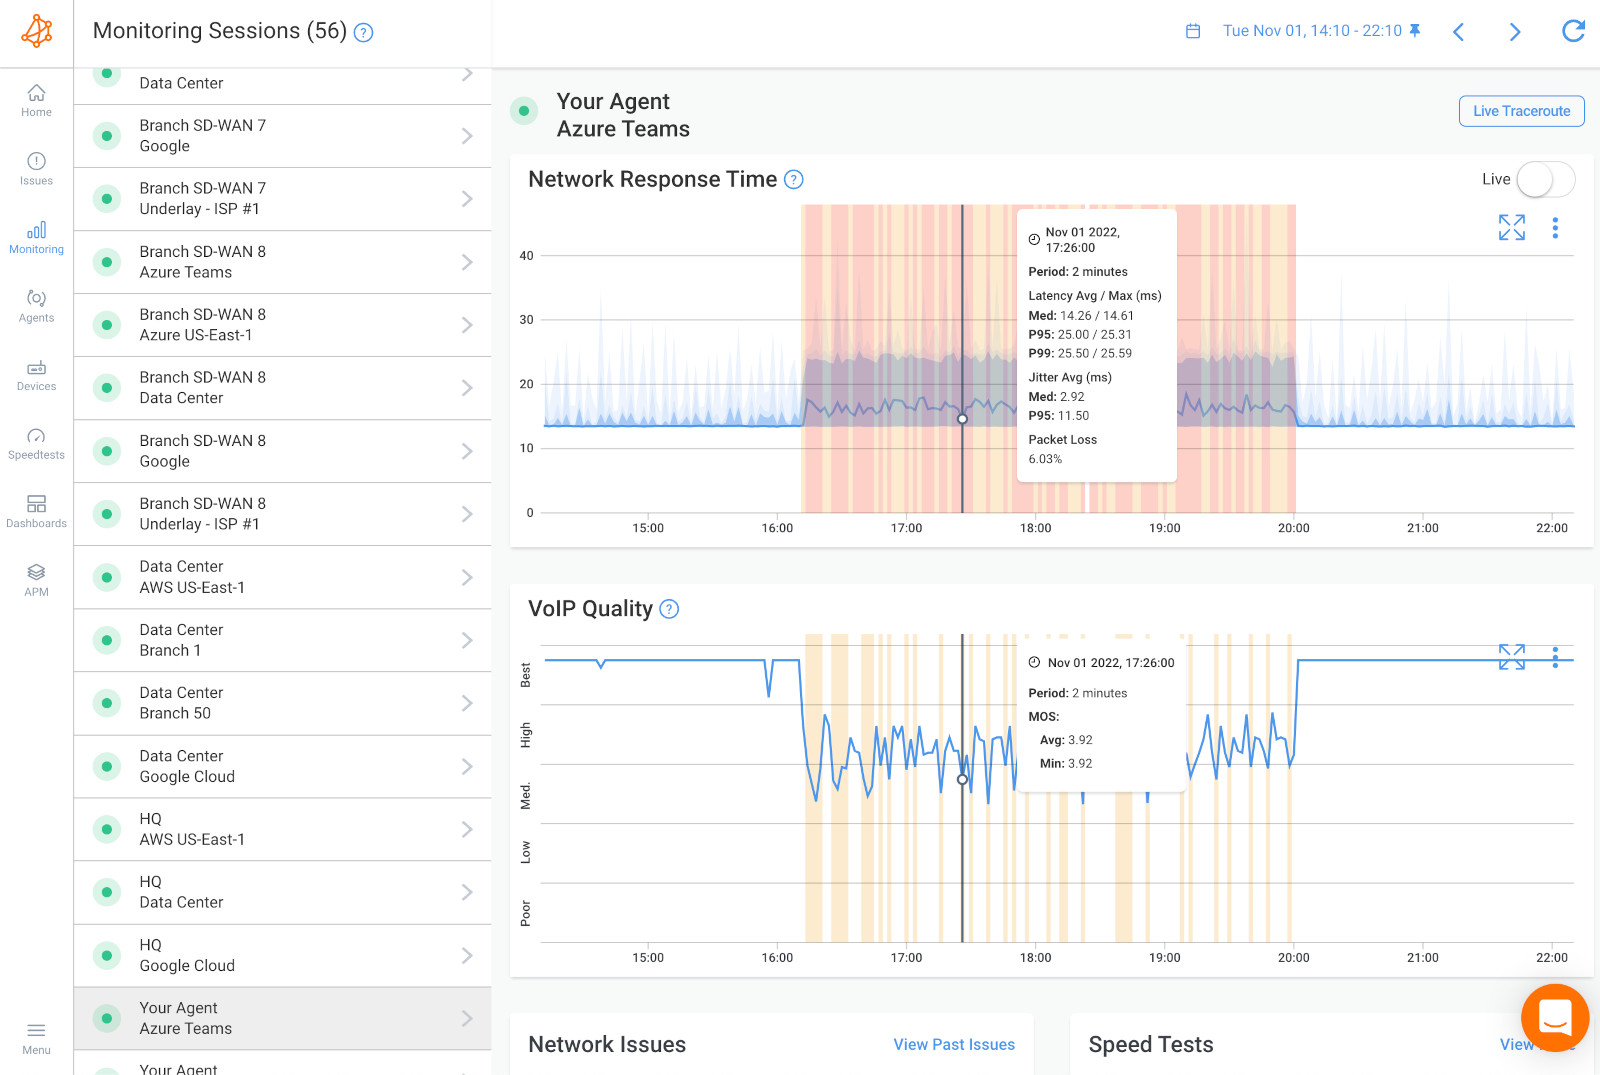
- Performance Monitoring Response: Continuous measurement reveals the cable circuit experiences latency between 80-400ms with high jitter, while the fiber maintains consistent 25ms latency. Performance data shows the SD-WAN is incorrectly routing latency-sensitive traffic over the unstable cable connection despite policy configurations.
Resolution Time: Performance monitoring validates SD-WAN operation and provides specific latency measurements to correct policy configurations, turning days of troubleshooting into a targeted fix.
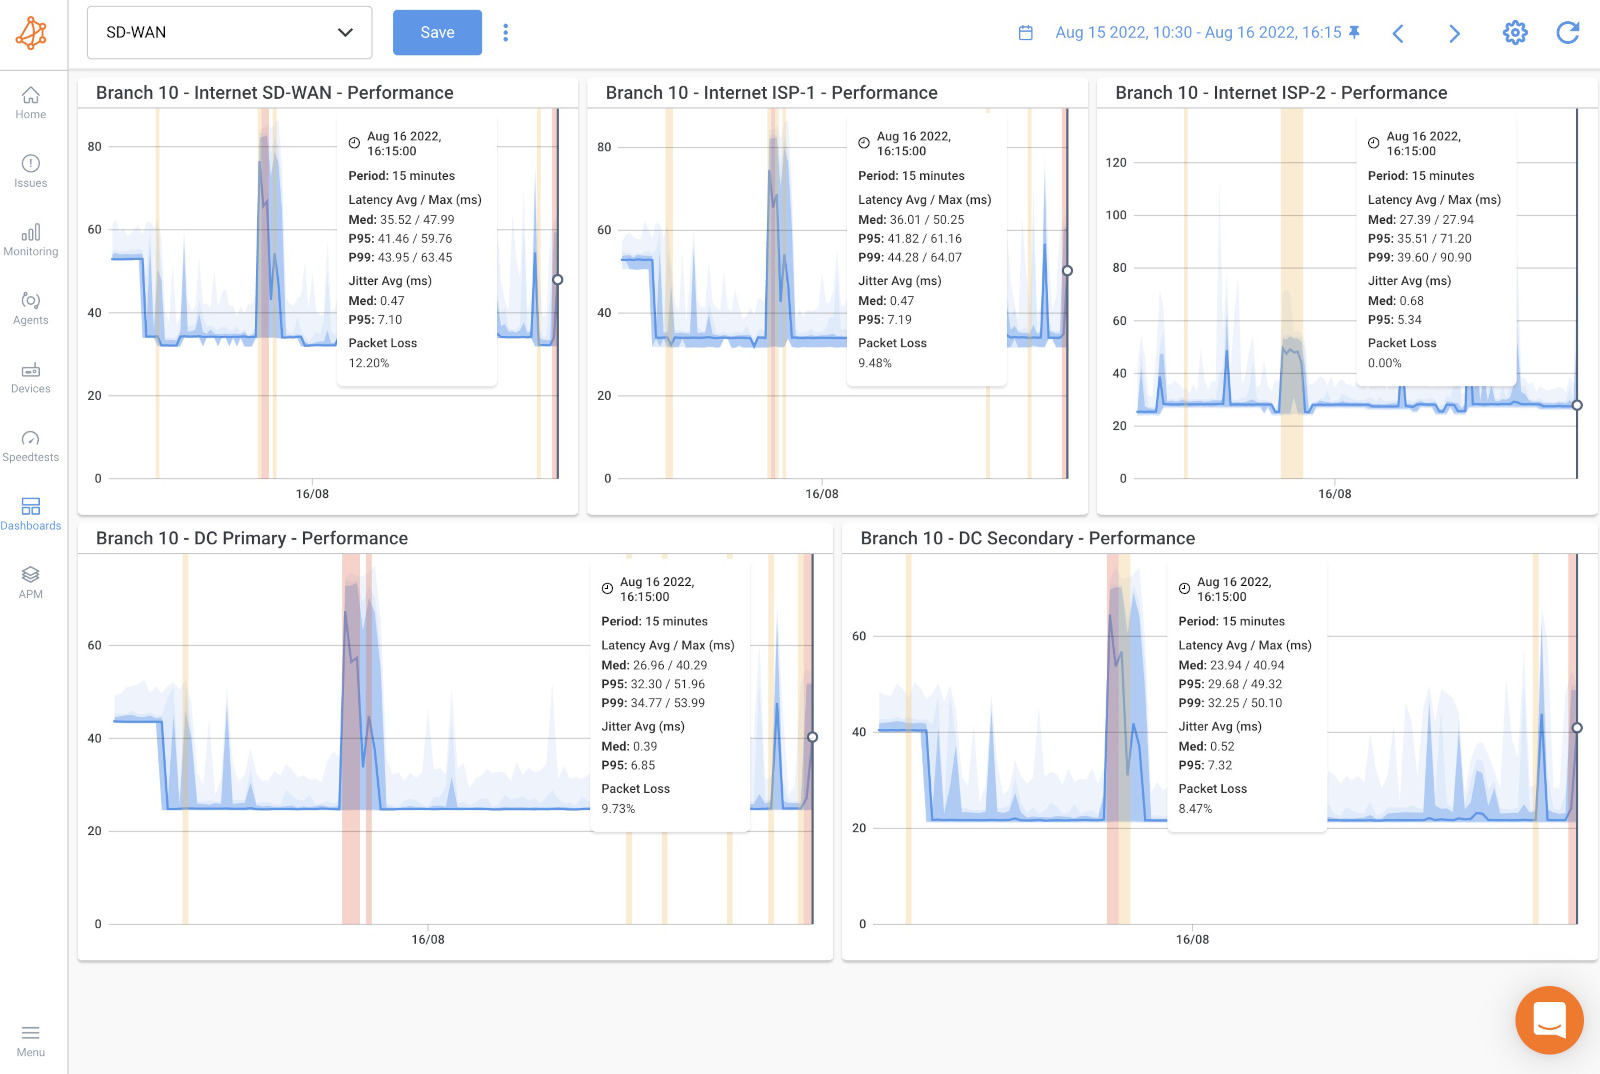 Screenshot from Obkio's Network Performance Monitoring Tool
Company migrates from on-premises Exchange to Microsoft 365. Some users report email is "slower than before," but management demands proof before considering infrastructure changes.
- Fault Monitoring Response: Office Internet connection shows online. Microsoft 365 status dashboard reports no outages. Fault monitoring confirms connectivity exists but cannot quantify whether performance meets user expectations.
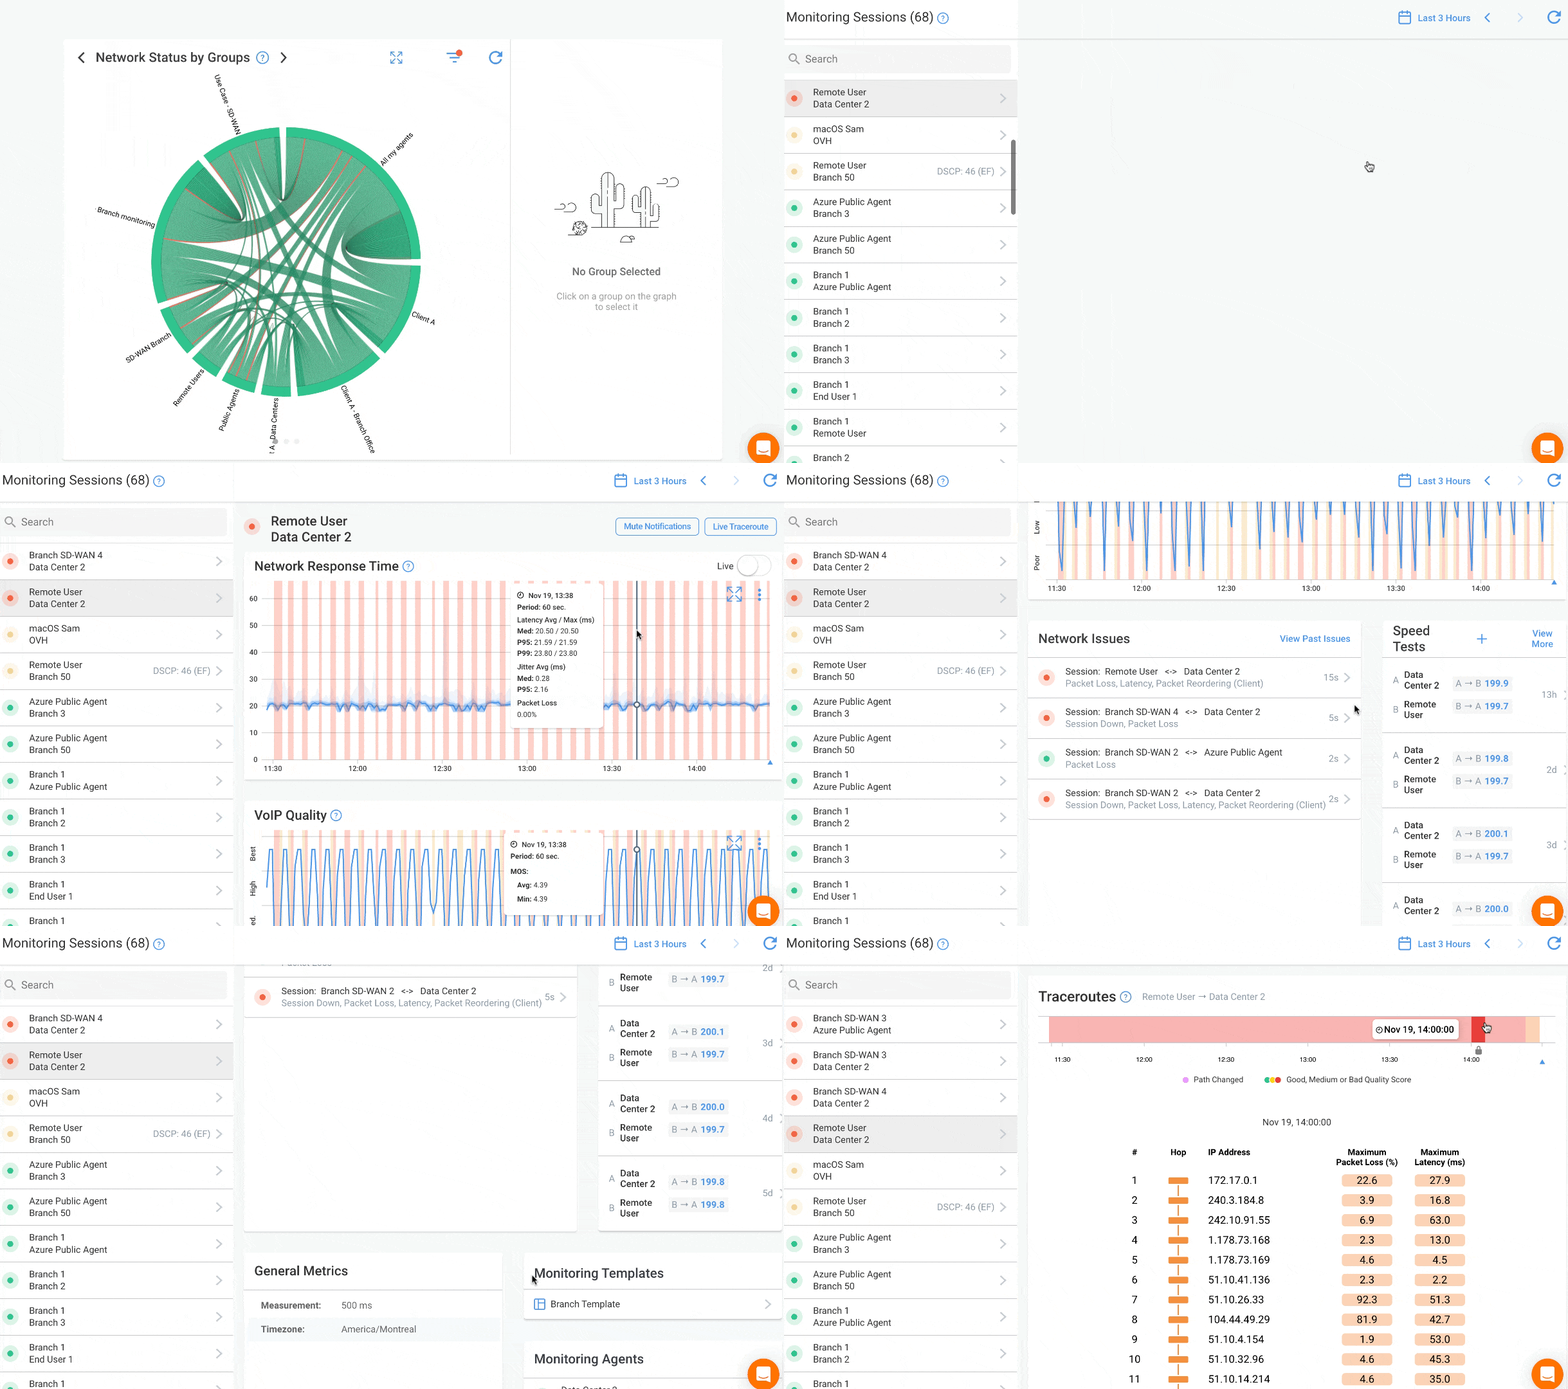
- Performance Monitoring Response: Baseline measurements from before migration showed 35ms latency to on-premises Exchange. Post-migration monitoring reveals 120ms average latency to Microsoft 365 datacenters, with peaks to 200ms during peak hours. Performance data proves the complaint is valid and documents the degradation with specific metrics.
Resolution Time: Performance monitoring provides the business case for bandwidth upgrades or SD-WAN implementation with objective data. Without performance metrics, this remains subjective user complaints versus IT assertions that "everything works."
 Screenshot from Obkio's Network Performance Monitoring Tool
These scenarios illustrate why fault and performance monitoring serve different purposes. Fault monitoring excels at alerting you when infrastructure fails—a capability every network requires. Performance monitoring measures the actual user experience and detects the degradation patterns that cause most real-world complaints.
In each scenario above, fault monitoring showed green status while users experienced genuine problems. Only performance monitoring provided the specific metrics (latency in milliseconds, packet loss percentages, jitter measurements) needed to diagnose root causes and implement targeted solutions.
Learn how to perform a network assessment with Obkio Network Monitoring to optimize network performance for a new service deployment or migration.
Learn more

For gaining comprehensive visibility and effectively monitoring and optimizing network performance as a whole, Network Performance Monitoring (NPM) is the preferred technique. NPM provides a broader and more holistic approach to network management, focusing on monitoring key performance metrics, analyzing trends, and optimizing resource allocation to ensure efficient operations and a satisfactory user experience.
By implementing NPM, you can track and analyze various performance indicators such as bandwidth utilization, latency, packet loss, application response times, and resource utilization. This comprehensive monitoring allows for a deeper understanding of network behavior, identification of performance bottlenecks, and proactive optimization of network resources.
NPM enables you to:
- Monitor and analyze performance across the entire network infrastructure, including devices, links, and applications.
- Track performance metrics in real-time or over a specified time period to identify trends and patterns.
- Set predefined thresholds and receive alerts or notifications when performance deviates from expected levels. Conduct capacity planning and optimize resource allocation based on historical performance data and growth patterns.
- Troubleshoot performance issues by analyzing detailed performance metrics and identifying the root cause of problems. Optimize network configurations, prioritize critical traffic, and ensure efficient delivery of applications and services.
While Network Fault Monitoring (NFM) is essential for prompt fault detection and resolution, NPM offers a more comprehensive and proactive approach to network performance monitoring and optimization. By focusing on NPM, you can gain better visibility into the overall network performance, identify performance bottlenecks, and take proactive measures to ensure optimal network operations.
1. What's the main difference between fault monitoring and performance monitoring?
Fault monitoring detects when network devices or connections completely fail (binary UP/DOWN status). Network Performance monitoring measures how well your network actually performs by tracking latency, packet loss, jitter, and throughput between endpoints.
Fault monitoring answers "Is it working?" while performance monitoring answers "How well is it working?" A device can report "UP" in fault monitoring while delivering 500ms latency that makes applications unusable, performance monitoring would detect this degradation.
2. Do I need both fault monitoring and performance monitoring?
Most organizations benefit from both approaches. Fault monitoring provides essential infrastructure alerting when devices fail completel. You need immediate notification when a core router crashes.
Network Performance monitoring detects degradation and user experience issues that fault monitoring misses entirely—slow applications, poor VoIP quality, cloud connectivity problems. Start with fault monitoring for basic visibility, then add performance monitoring when deploying VoIP, cloud applications, or SD-WAN, or when troubleshooting "network is slow" complaints that fault monitoring cannot diagnose.
3. How much does network performance monitoring cost compared to fault monitoring?
Fault monitoring typically costs significantly less. Open-source options (Nagios, Zabbix) provide free fault monitoring, while basic commercial tools start around $500-2,000 for small networks. Performance monitoring ranges from $1,000-10,000+ annually depending on the number of monitoring locations and features. Performance monitoring requires distributed agents (additional hardware or virtual machines) while fault monitoring needs only a central server. However, performance monitoring reduces troubleshooting time and prevents user experience issues, often justifying higher costs through improved productivity and reduced downtime.
4. Will Network erformance monitoring slow down my network?
No. Network performance monitoring generates minimal traffic—typically 64-byte packets every few seconds between agents, consuming less than 100 Kbps per monitoring session. A network monitoring 10 paths continuously uses approximately 1 Mbps total bandwidth. This is negligible on modern networks with multi-megabit or gigabit connections. The synthetic traffic mimics real user traffic patterns, so it doesn't introduce artificial load or impact application performance.
5. How do I know if my slow network issue needs network performance monitoring?
If users complain about network slowness but fault monitoring shows all devices "UP" with green status, you need performance monitoring. Common scenarios requiring performance monitoring include: choppy VoIP calls, slow cloud application response times, video conferencing freezes, remote workers experiencing disconnections, intermittent application timeouts, or "network feels slow" complaints you cannot diagnose with existing tools.
If you spend hours troubleshooting performance issues without identifying root causes, performance monitoring provides the specific metrics (latency, packet loss, jitter) needed for diagnosis.
6. Can network performance monitoring identify problems in my ISP's network?
Yes—this is a key advantage. Network performance monitoring measures end-to-end paths including segments you don't control. When synthetic traffic traverses your network, your ISP's infrastructure, and reaches cloud providers, hop-by-hop measurement identifies exactly where latency increases or packet loss occurs.
You can document that your ISP delivers 200ms latency instead of contracted 50ms maximum, supporting service escalations and SLA compliance claims. Fault monitoring only tracks devices you directly manage, providing no visibility into provider networks.
7. What's the difference between active and passive monitoring?
Active monitoring proactively sends test traffic (ping tests, synthetic transactions) to measure performance or verify device availability. The monitoring system initiates tests at regular intervals.
Passive monitoring observes existing network traffic or waits for devices to report problems (SNMP traps, syslog messages).
Active monitoring detects issues even when devices cannot self-report failures. Passive monitoring consumes no bandwidth but depends on devices remaining functional enough to generate alerts. Most effective monitoring combines both approaches.
8. How quickly does performance monitoring detect issues?
Network performance monitoring detects degradation in real-time based on your configured test frequency. Tests running every 500 milliseconds detect issues within one second. Standard deployments testing every 5-10 seconds identify problems within 30-60 seconds.
The key advantage over fault monitoring isn't just speed—it's detecting degradation before complete failure. Performance monitoring alerts you when latency increases from 30ms to 100ms (before users complain), while fault monitoring only alerts after complete device failure (after users already experience problems).
Network Performance Monitoring is typically more complex than Network Fault Monitoring. But this complexity brings a level of sophistication that simply cannot be matched otherwise.
Network Performance Monitoring is like having an army of administrators constantly running tests from various points on your network. In fact, it’s actually better than an army of administrators because it can run tests much faster than any human could and it will react faster to any abnormal test result.
One word of caution, though: When shopping for a Network Performance Monitoring tool, you need to make absolutely sure that this is really what you’re getting.
There are far too many monitoring tools of various types calling themselves Network Performance Monitoring tools but many of them, while they provide a useful type of network monitoring—such as bandwidth usage, for instance, don’t truly monitor performance.
At least not in the sense that we intend it, that is as a tool that measures the true performance of the network by simulating real user activity rather than extrapolating it from other measurements.
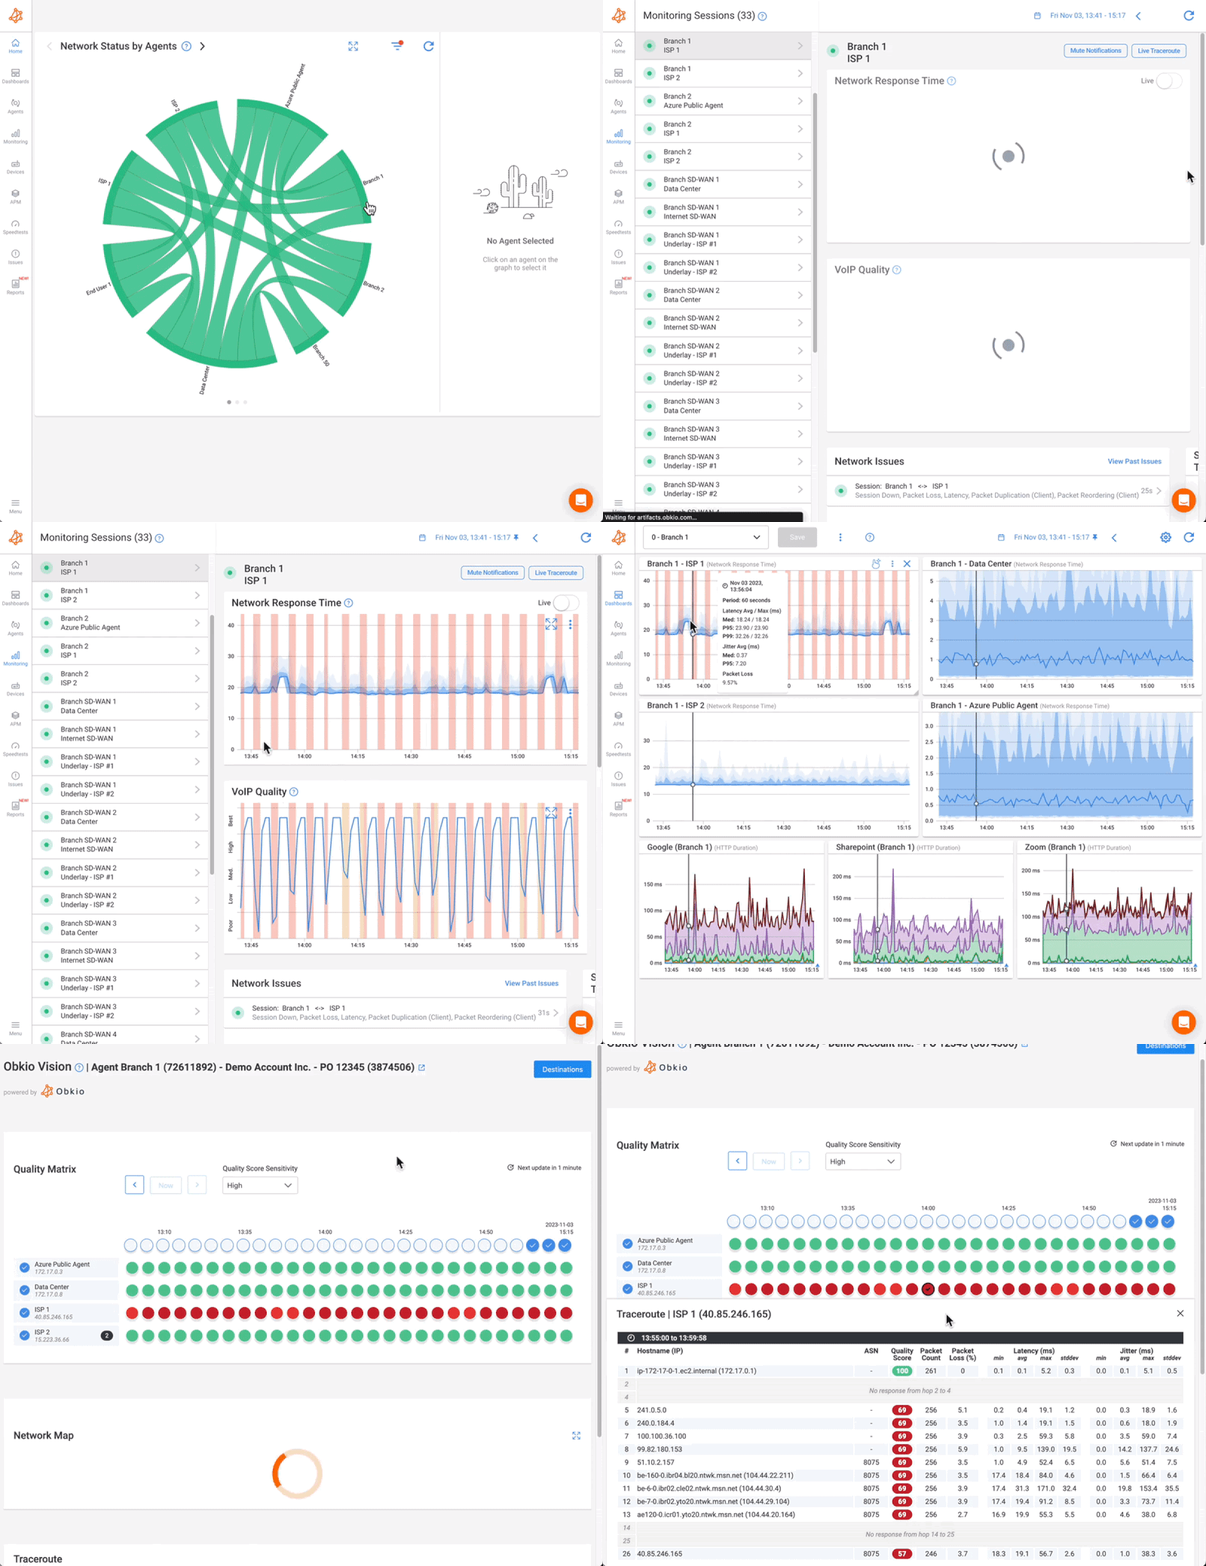
Choosing the Right Network Monitoring Technique: Network Fault Monitoring vs. Network Performance Monitoring
In today's increasingly connected and data-driven world, ensuring optimal network performance is critical for businesses to thrive. Network Performance Monitoring (NPM) plays a pivotal role in proactively managing and optimizing network operations to deliver a seamless user experience. When it comes to choosing the right NPM tool, Obkio stands out as a comprehensive solution that empowers organizations to take their network management to the next level.
Obkio's Network Performance Monitoring tool goes beyond mere fault detection, providing a holistic view of network performance and enabling administrators to make data-driven decisions. With real-time monitoring, powerful analytics, and proactive alerts, Obkio empowers organizations to identify and resolve performance bottlenecks before they impact users or critical applications.

By leveraging Obkio, businesses can gain comprehensive visibility into their network infrastructure, track key performance metrics, and optimize resource allocation. The intuitive dashboard and customizable reports provide actionable insights that drive performance optimization and efficient network operations. With Obkio's tool, businesses can proactively plan for future capacity needs, ensure efficient delivery of applications and services, and ultimately enhance productivity and customer satisfaction.
Don't settle for outdated fault monitoring tools that only scratch the surface of network management. Embrace Obkio's Network Performance Monitoring tool and unlock the full potential of your network infrastructure. Experience the power of proactive network optimization and take your business to new heights.
Ready to optimize your network performance?


 Obkio Blog


