Table of Contents
Table of Contents
Your network is like the beating heart of your digital world. And who's there making sure it's in tip-top shape? That's right – the network admins, the unsung heroes of the networking world. In our deep dive today, we're talking all about navigating Network Health Monitoring to ensure the peak performance of your network!
Think of it like checking the pulse of your network. We're not just fixing things when they break; we're keeping a constant eye on the rhythm, making sure everything flows smoothly. It's like having a toolkit for your network's well-being, and we're about to unpack it all. Stick around, and let’s get into the nitty-gritty of keeping those digital heartbeats strong!
Network health is the lifeblood of an organization's digital existence. Imagine your network is the central nervous system of your operations, relaying information, connecting devices, and facilitating communication. Just like in the human body, where a healthy heart ensures the efficient flow of blood and sustains life, a healthy network ensures the smooth flow of data and sustains digital activities.
Network health extends beyond the IT department; it directly impacts user experiences, productivity, and even the bottom line of businesses. Network disruptions, downtime, or inefficiencies can lead to a cascade of issues, affecting everything from daily operations to customer satisfaction.
To grasp what network health monitoring is all about, let's draw a parallel with a familiar concept: the heartbeat. In the same way that a heartbeat reflects the vitality of a living organism, the pulse of a network encapsulates its dynamic state, efficiency, and resilience.
Just as a fluctuating or irregular heartbeat signals potential health issues in a person, anomalies in the network pulse indicate network issues, or network locations that need immediate attention. Think of it like this: comparing network health to a heartbeat highlights how we need ongoing, continuous monitoring of things for a healthy digital life.
Throughout this guide, we'll keep coming back to this metaphor, exploring how administrators can listen to and interpret the digital heartbeat of their networks, ensuring a steady and robust flow of information.
As always, we need to start with the basics!
Network health monitoring is the process of constantly keeping an eye on the performance, reliability, and overall well-being of a computer network. It involves the continuous observation of key metrics and parameters that define the network's functionality. Just as you'd track your heart rate during a workout, network health monitoring involves keeping tabs on various metrics like bandwidth usage, latency, and device connectivity in real-time.
The goal is to catch any issues before they turn into major problems. It's a bit like preventive medicine for your network, helping administrators identify and fix potential hiccups before they disrupt the smooth operation of your digital world. This ongoing monitoring ensures that your network stays in top-notch condition, providing a seamless experience for users and keeping everything running smoothly behind the scenes.
When we talk about network health monitoring, we're essentially looking at the vital signs and performance indicators that reveal the overall condition of a computer network. Here are the fundamental components that make up the core of network health monitoring:
- Bandwidth Utilization: This measures how much of the available network bandwidth is being used at any given time. It helps administrators understand the level of traffic on the network and ensures that there's enough capacity to handle the data flow without causing congestion.
- Latency: Latency is the time it takes for data to travel from one point to another on the network. It's a crucial metric, especially for real-time applications like video conferencing or online gaming. Low latency ensures a responsive and smooth user experience.
- Packet Loss: Networks transfer data in packets, and packet loss occurs when some of these packets fail to reach their destination. Monitoring packet loss helps administrators identify potential issues with network stability and reliability.
- Device Connectivity: Keeping track of the status and connectivity of devices on the network is essential. This includes monitoring the online/offline status of devices, detecting unauthorized devices, and ensuring a secure and stable network environment.
- Network Traffic Patterns: Understanding how data moves through the network is key to optimizing its performance. Monitoring traffic patterns helps identify trends, peak usage times, and potential bottlenecks that could impact overall efficiency.


Network health monitoring involves collecting a diverse set of data to gain a comprehensive view of the network's condition. Here are the types of data typically collected:
- Performance Metrics: Metrics like response time, throughput, and error rates provide insights into how well the network is performing. These metrics help administrators assess the quality of service and identify areas for improvement.
- Event Logs: Monitoring systems keep detailed logs of events and activities on the network. This includes information about device connections, configuration changes, and security events. Analyzing these logs is crucial for troubleshooting and security management.
- Alerts and Notifications: Automated alerts and notifications are generated when certain predefined conditions are met. This could include exceeding bandwidth thresholds, detecting unusual network behaviour, or identifying potential security threats. Alerts help administrators respond quickly to emerging issues.
- Historical Data: Storing historical data allows administrators to analyze trends and patterns over time. This long-term perspective is valuable for capacity planning, trend analysis, and anticipating future network needs.
By focusing on these fundamental components and collecting diverse types of data, network health monitoring equips administrators with the information they need to keep their networks running smoothly and address challenges before they impact users and operations.
Network health refers to the overall well-being and performance of a computer network. Several factors contribute to network health, and addressing these factors is essential to ensure the network operates efficiently and securely.
- Bandwidth: Sufficient bandwidth is crucial for the smooth functioning of a network. It determines how much data can be transmitted over the network at any given time. High bandwidth is essential for handling large volumes of data and supporting multiple users or devices simultaneously.
- Latency: Low latency is important for real-time applications and responsiveness. Latency is the time delay between sending and receiving data. A network with low or good latency provides a more responsive and efficient user experience.
- Reliability: A reliable network ensures consistent connectivity and network uptime. Redundancy and network failover mechanisms help prevent network downtime in case of hardware failures or other issues.
- Security: Network security is critical to protect against unauthorized access, data breaches, and other cyber threats. Firewalls, intrusion detection/prevention systems, and encryption protocols contribute to network security.
- Scalability: A healthy network should be scalable to accommodate growth in terms of users, devices, and data traffic. Scalability ensures that the network can handle increased demand without a significant decrease in performance.
- Quality of Service (QoS): QoS mechanisms prioritize certain types of network traffic over others. This ensures that critical applications, such as voice and video communication, receive the necessary resources for optimal performance.
- Network Topology: The network topology, whether it's a star, ring, bus, or mesh, can impact performance and reliability. The chosen topology should align with the organization's requirements and provide the necessary redundancy and fault tolerance.
- Hardware and Software: The choice of networking hardware (routers, switches, access points, etc.) and software (operating systems, network protocols, etc.) can significantly influence network health. Up-to-date and well-maintained hardware and software contribute to stability and security.
By addressing these factors, organizations can maintain a healthy and robust network infrastructure that meets the demands of users and applications while minimizing the risk of downtime and security breaches.
As we can see, Network Health Monitoring is a core practice for ensuring optimal network performance and user experience. So how do you get started? Let’s get into that!
One of the main aspects of Network Health Monitoring is, well, Monitoring. Enter Network Performance Monitoring tools, the unsung heroes in the realm of Network Health Monitoring. Far beyond mere data collection, these tools act as the vigilant pulse-takers of your network, providing real-time insights and ensuring its continuous well-being.
While the term "performance" might conjure images of speed tests and latency checks, NPM tools extend their capabilities far beyond speedometers for your network. They serve as comprehensive health monitors, capturing a rich tapestry of data that paints a vivid picture of your network's condition. From bandwidth utilization to device connectivity, they delve into the intricacies that define a healthy, robust digital infrastructure.
Proactive Pulse-Keeping
Network Performance Monitoring tools operate proactively, providing administrators with real-time metrics, alerts, and historical data. It's not just about diagnosing ailments; it's about preventing them. By setting thresholds, generating alerts, and offering visual representations of network dynamics, these tools empower administrators to take pre-emptive action, ensuring the continuous and optimal performance of their networks.
Welcome to the future of Network Health Monitoring - where your toolkit is now more advanced than ever! In this toolkit, you have Obkio’s Performance Monitoring tool.
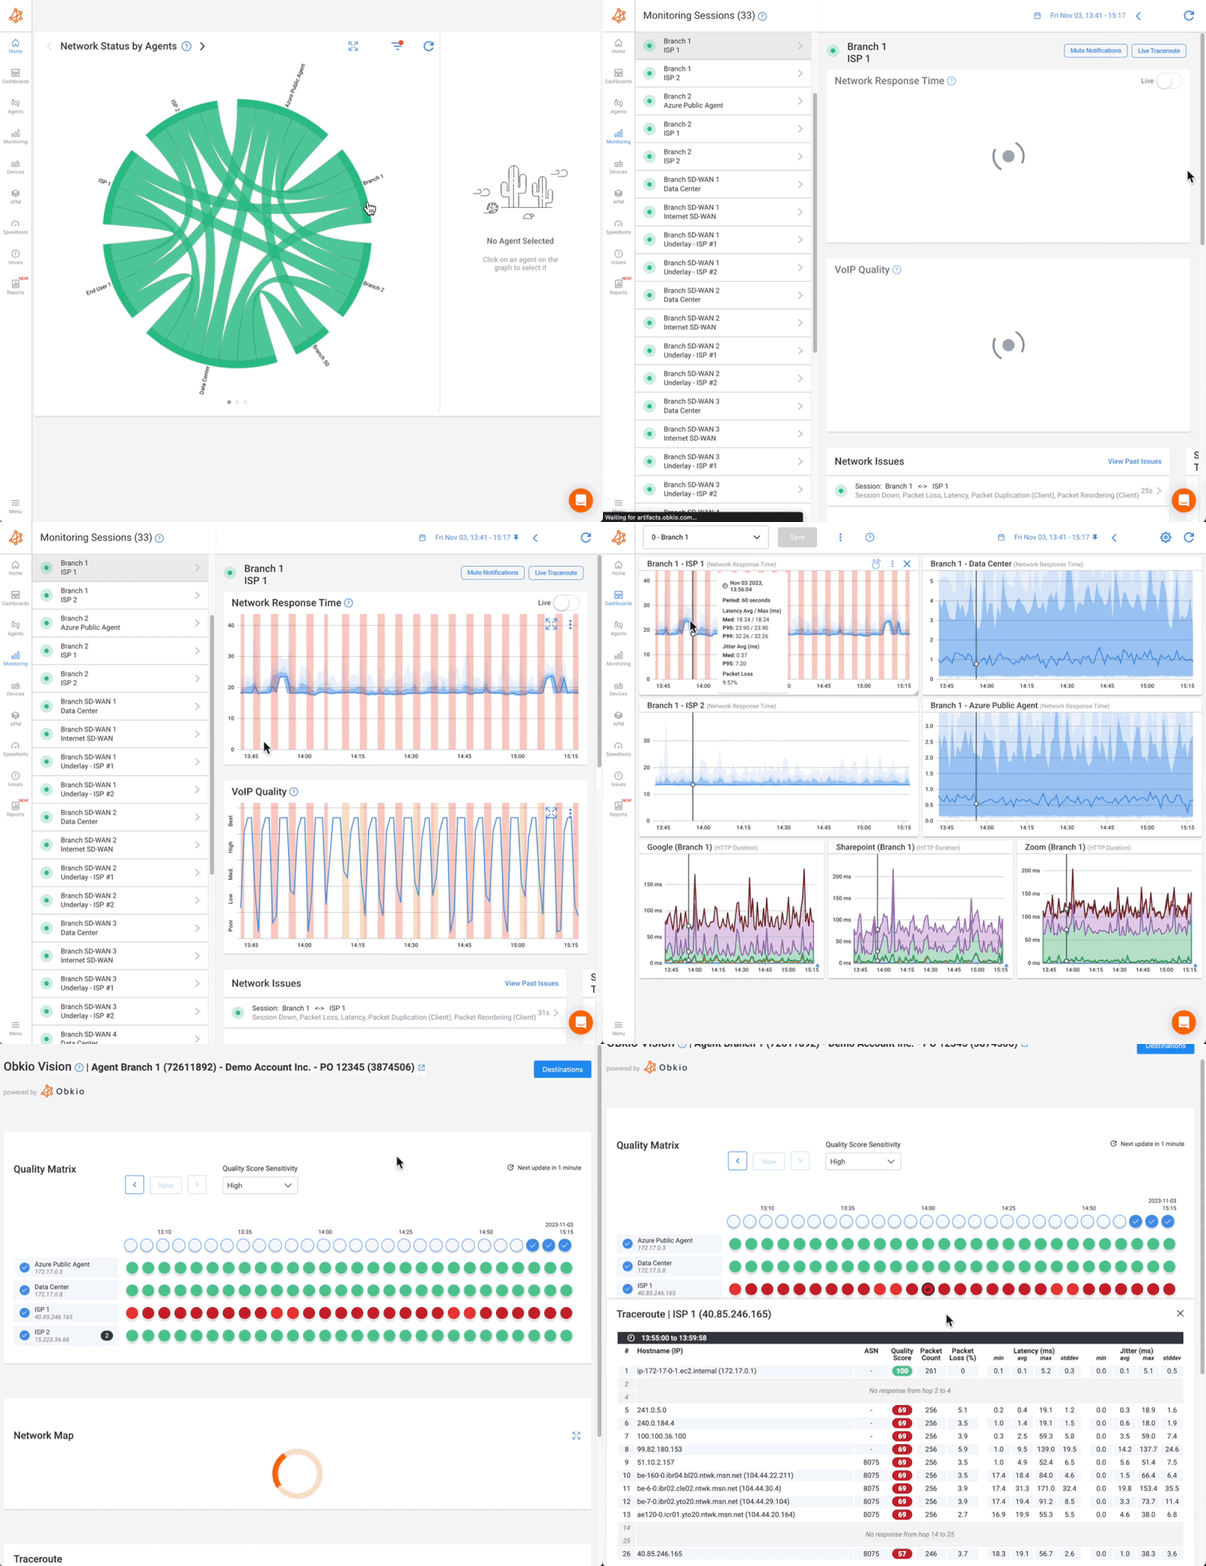
Obkio is an active, end-to-end NPM tool that continuously monitors network performance and health by measuring core network health metrics. Using Agents deployed in all network locations, Obkio gives you a complete overview of your network health to proactively pinpoint the earliest signs of network issues, and identify areas for optimization.
Key Features:
- Proactive Monitoring: Obkio goes beyond diagnostics, actively identifying and addressing issues before they impact performance.
- Actionable Insights: With real-time metrics, alerts, and seamless integration, Obkio empowers administrators with actionable intelligence for network optimization.
- Comprehensive Health Check: From bandwidth utilization to latency, packet loss, and throughput, Obkio monitors key metrics to provide a holistic view of your network's health.
- Synthetic Monitoring: Unlike packet capture tools, Obkio’s Agents generate and exchange synthetic traffic to simulate user behaviour and proactively identify potential bottlenecks or issues.
- Network Device Monitoring: Keep a vigilant eye on the status and connectivity of devices within your network, ensuring optimal performance and security.
- Application Performance Monitoring (APM): Obkio extends its capabilities by offering Application Performance Monitoring (APM) monitor the performance of applications, providing insights into user experiences and responsiveness.
Embark on a journey with Obkio and secure the future of your Network Health Monitoring!

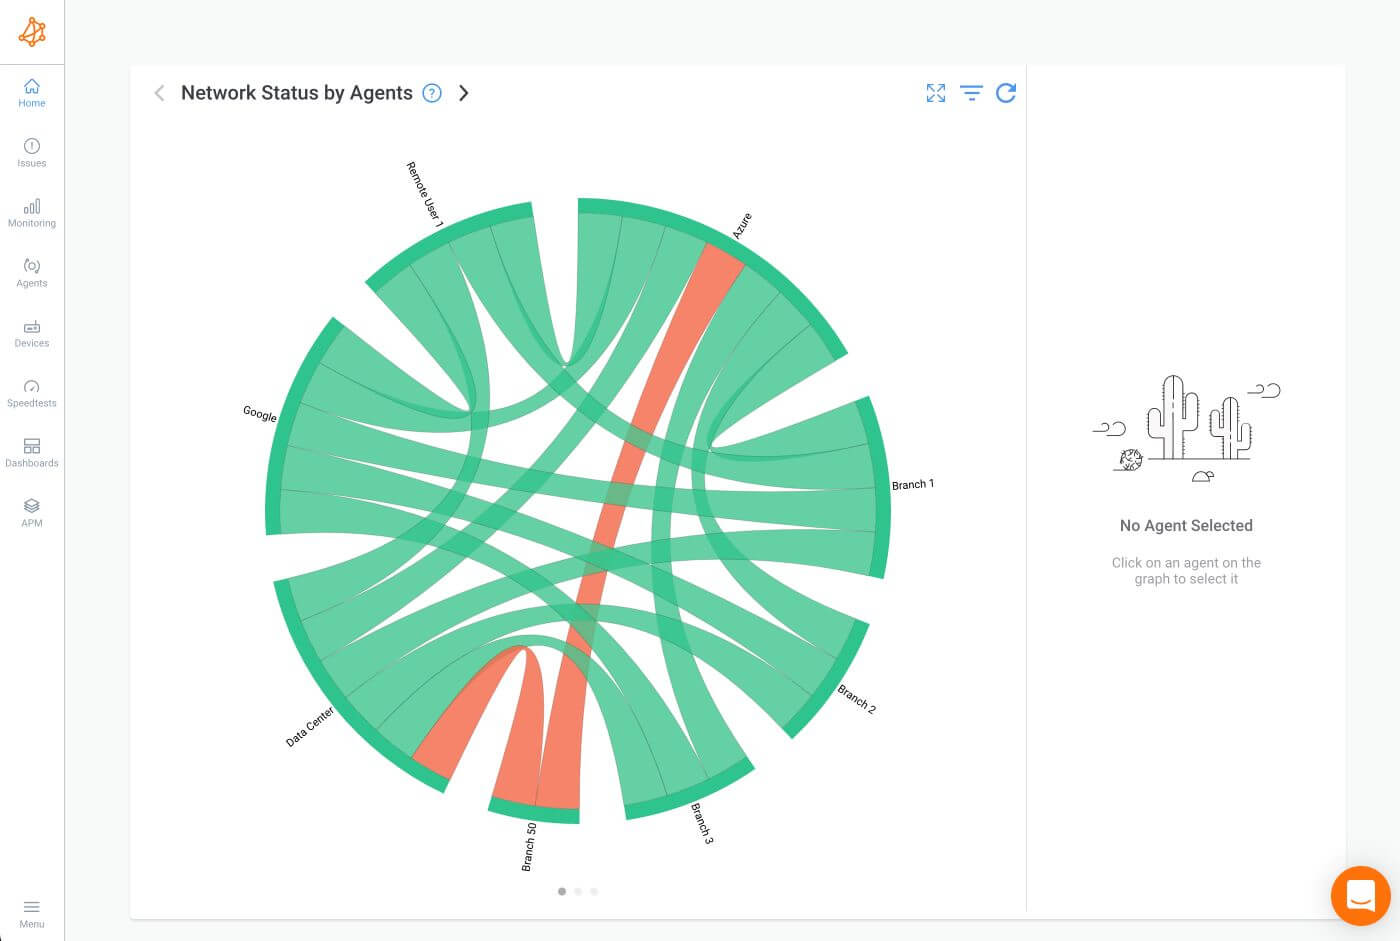
Obkio monitors end-to-end network performance and health using Network Monitoring Agents deployed in key network locations like offices, data centers and clouds. The Agents exchange synthetic traffic to give you a complete overview of your network health, even during downtimes with no real user traffic. This allows you to proactively identify network issues, even before users experience them!
For your end-to-end network health monitoring setup, you’ll need the following Monitoring Agents (which Obkio’s Onboarding Wizard will help you deploy):
- Local Agents: Installed in the targeted office location where you want to monitor network health and network performance. There are several Agent types available (all with the same features), and they can be installed on MacOS, Windows, Linux and more.
- Public Monitoring Agent: These are deployed over the Internet and managed by Obkio. They compare performance up to the Internet and quickly identify if the problem is global or specific to the destination. For example, monitor network health between your branch office and Google Cloud.
The Agents monitor key network metrics related to network health by sending and monitoring synthetic traffic through your network every 500 ms for the most precise network health measurements.
Monitoring network devices is another crucial aspect of comprehensive Network Health Monitoring. Network devices, such as routers, switches, firewalls, and servers, are the building blocks of a network infrastructure.
Lucky for you, Obkio’s Network Device Monitoring feature is a fast and easy solution to get detailed information about the performance of your core network devices like routers, switches, firewalls, and other infrastructure components. Monitoring these devices provides valuable insights into their status, performance, and connectivity, contributing to the overall health and functionality of the network.
- Early Issue Detection: Monitoring devices allows administrators to detect potential issues or abnormalities early on. This proactive approach enables them to address problems before they escalate and impact the network's performance.
- Capacity Planning: Monitoring the usage and performance of network devices over time provides data for capacity planning. Administrators can anticipate future network needs, plan for expansion, and ensure that devices can handle increasing workloads.
- Troubleshooting: When network issues arise, monitoring devices helps pinpoint the source of the problem. This facilitates efficient troubleshooting and reduces the time it takes to identify and resolve issues, minimizing downtime.
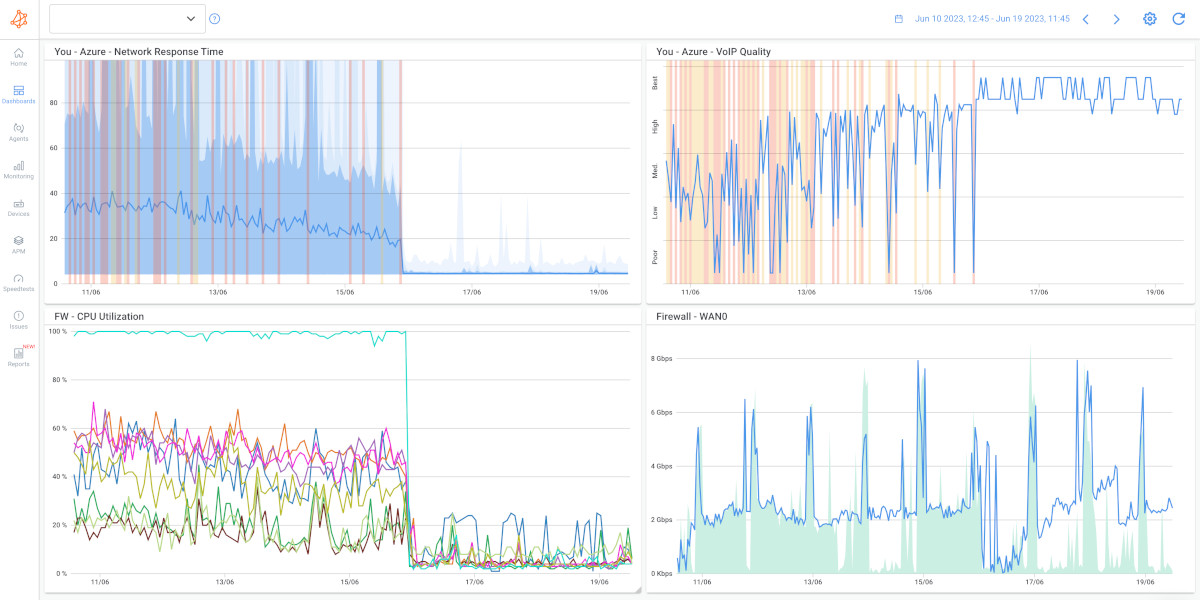
Obkio’s agents act as the eyes and ears of the monitoring system, actively participating in the network and continuously collecting data. They collect a variety of data that is crucial for understanding and optimizing your network health.
- Bandwidth Utilization: Obkio measures the amount of bandwidth being used at any given time. This data is crucial for understanding the network's capacity and usage patterns.
- Latency Measurement: Latency, the time it takes for data to travel from source to destination, is monitored. Low latency is essential for ensuring responsive network performance.
- Packet Loss Monitoring: Obkio's Packet Loss Monitoring tool keeps track of packet loss, identifying instances where data packets fail to reach their intended destination. Minimizing packet loss is critical for network reliability.
- Device Connectivity: The status and connectivity of network devices, including routers, network switches, and servers, are continuously monitored. This helps identify potential points of failure or issues with device connectivity.
- Throughput Analysis: Measures the actual data transfer rate across the network, providing insights into the efficiency of data transmission.
- Jitter Monitoring: Jitter monitoring tools observe variations in the delay of received packets, ensuring a stable and predictable network performance.
- CPU Utilization: Monitors the CPU utilization of network devices such as routers and switches, helping administrators understand resource usage and potential bottlenecks.
By continuously collecting a diverse set of metrics, including throughput, jitter, and CPU utilization, Obkio ensures that administrators have a comprehensive understanding of their network's health and can take proactive measures to optimize performance and troubleshoot issues effectively.
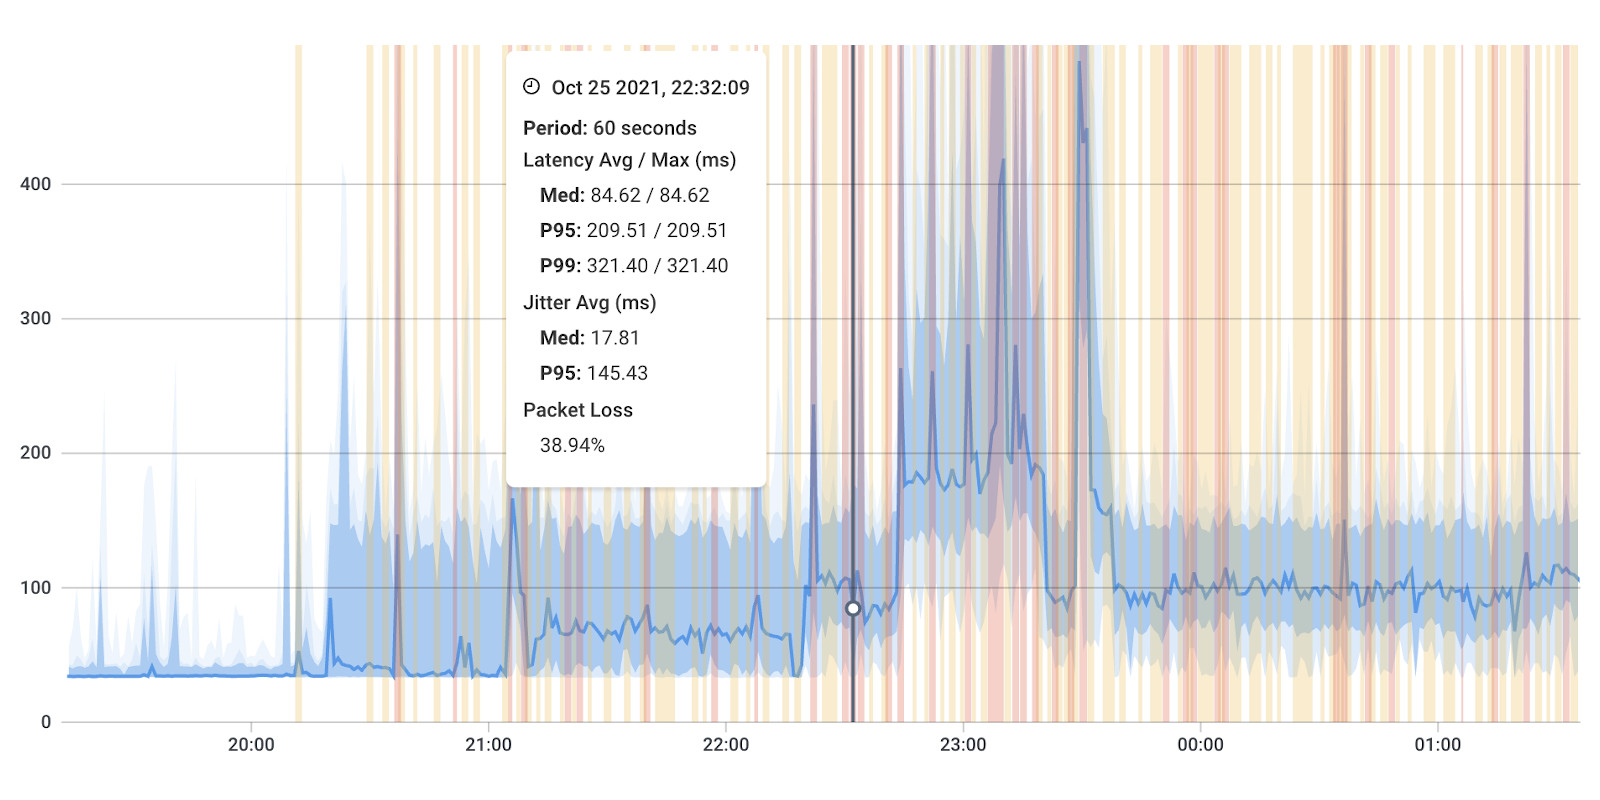
Obkio goes beyond providing raw data; it transforms data into actionable insights. From real-time alerts to visual representations and historical data analysis, Obkio empowers administrators with the tools they need to proactively manage, optimize, and troubleshoot their network, ensuring optimal performance and reliability.
Obkio's monitoring system is equipped with a robust alerting mechanism. Administrators can configure thresholds for various metrics, such as bandwidth utilization, latency, jitter, and more. When these thresholds are exceeded, Obkio generates real-time alerts and notifications. This proactive approach ensures that administrators are promptly informed of potential issues, allowing for swift intervention and issue resolution.
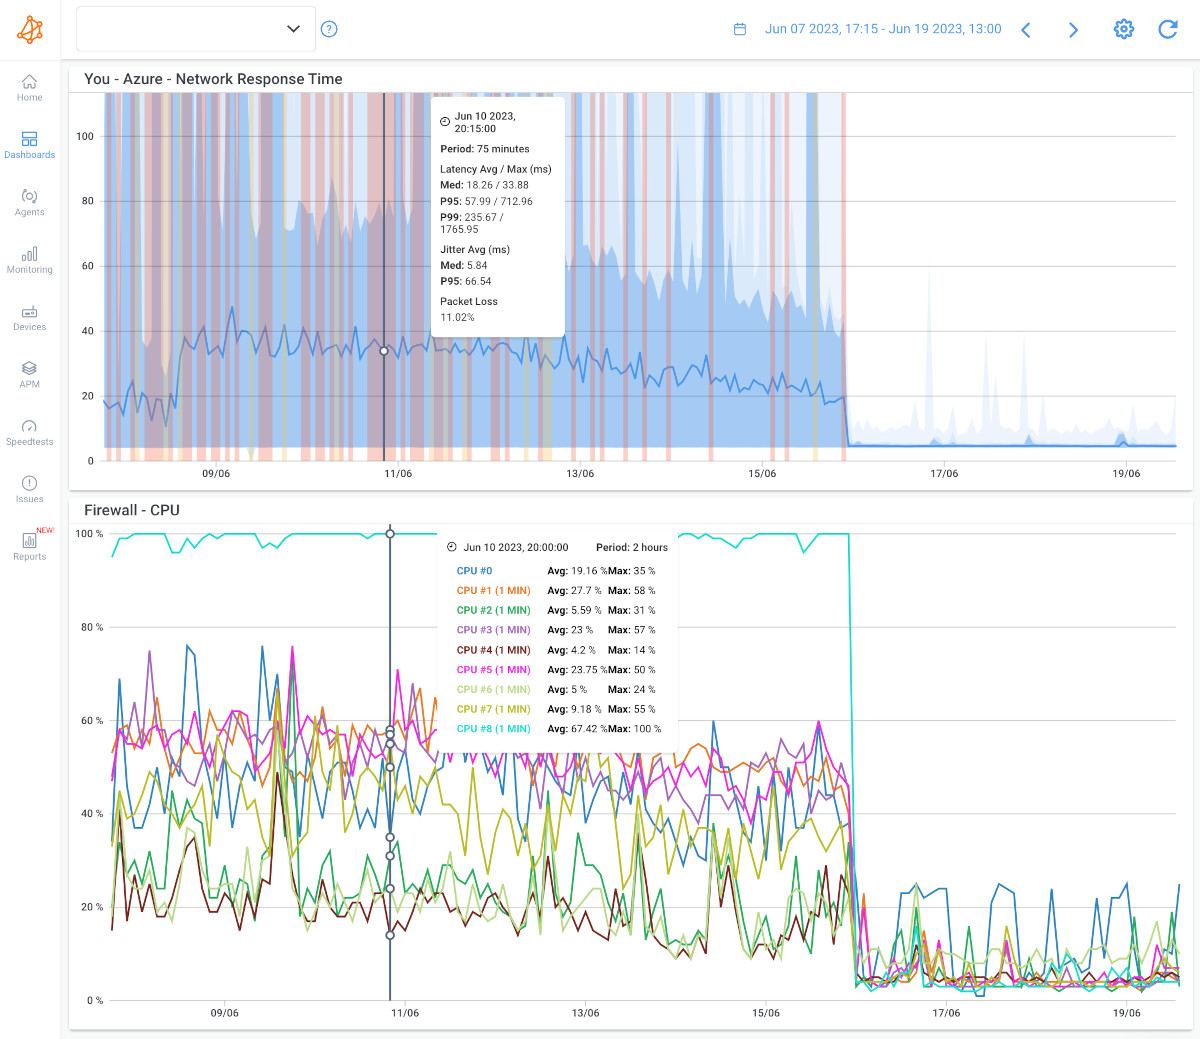
Obkio’s app transforms data into visually intuitive representations, including graphs, charts, and dashboards. These visualizations offer a quick and comprehensive overview of the network's performance. Trends, patterns, and anomalies are easily identifiable, empowering administrators to make informed decisions. Visual representations also facilitate communication with non-technical stakeholders, providing a clear snapshot of the network's health.
Historical data is a treasure trove for administrators. Obkio stores and archives performance data over time, enabling trend analysis and long-term insights. By examining historical patterns, administrators can identify recurring issues, plan for future network needs, and gain a deeper understanding of the network's evolution. This historical perspective is invaluable for capacity planning and anticipating potential challenges.
Visual Traceroutes offer a visual representation of the network path that data takes from source to destination. This tool provides administrators with a clear map of the network, helping identify potential bottlenecks, latency points, or unexpected routing. Visual Traceroutes play a crucial role in troubleshooting, offering a visual aid to pinpoint issues along the network path.
Network Health Monitoring is the backbone of a robust and resilient digital infrastructure. To ensure the seamless operation of your network, it's essential to conduct thorough and proactive monitoring. This Network Health Monitoring Checklist serves as a comprehensive guide, outlining key areas and considerations for monitoring your network's health.
Monitoring the health of physical components, such as servers, switches, routers, and firewalls, is essential for ensuring the overall stability and reliability of your network.
Servers:
- Monitor server health, including CPU utilization, memory usage, and storage capacity.
- Track server uptime and availability.
Switches:
- Monitor switch performance, including port utilization and error rates.
- Check for connectivity and status of individual switch ports.
Routers:
- Monitor router performance, including CPU usage and interface statistics.
- Track routing tables and ensure proper routing.
Firewalls:
- Monitor firewall rule effectiveness and traffic filtering.
- Check for security events and unauthorized access attempts.
This section delves into the dynamics of network connectivity and bandwidth utilization. By monitoring bandwidth, latency, and packet loss, you gain insights into the efficiency and responsiveness of your network, allowing for proactive management of potential bottlenecks.
Bandwidth Utilization:
- Monitor overall network bandwidth usage to ensure efficient utilization.
- Identify bandwidth-intensive applications or users.
Latency:
- Monitor latency to ensure responsive network performance.
- Identify sources of latency, such as network congestion or routing issues.
Packet Loss:
- Monitor packet loss to ensure data integrity.
- Investigate and address sources of packet loss.
Throughput:
- Measure throughput, actual data transfer rates to ensure efficient data transmission.
- Identify and address any throughput bottlenecks.
Jitter:
- Monitor jitter to ensure stable and predictable network performance.
- Address sources of jitter that may impact real-time applications.
CPU Utilization:
- Monitor CPU utilization on critical network devices.
- Identify and address high CPU usage that may impact performance.
Historical Data Analysis:
- Regularly analyze historical data for trends and patterns.
- Use historical data for capacity planning and performance optimization.
Explore the health of individual devices within your network, ensuring they are online, properly connected, and functioning as expected. Monitoring device status and connectivity is crucial for identifying and addressing potential points of failure.
Device Status:
- Monitor the status of network devices (routers, switches, firewalls) to ensure they are online.
- Receive alerts for any device going offline unexpectedly.
Device Connectivity:
- Monitor connectivity between devices to ensure seamless communication.
- Identify and troubleshoot any connectivity issues.
Network security is paramount, and this section emphasizes monitoring for security events, firewall rules, and overall network security effectiveness. Vigilant monitoring helps safeguard against unauthorized access and potential security breaches.
Security Events:
- Monitor for security events and anomalies.
- Regularly review logs for signs of unauthorized access or suspicious activity.
Firewall Rules:
- Regularly review and update firewall rules.
- Ensure that firewall configurations align with security policies.
Shift focus to the realm of applications, assessing their availability, responsiveness, and impact on user experience. By monitoring application performance using APM, you can optimize their operation and deliver a seamless experience to end-users.
Application Availability:
- Monitor the availability and responsiveness of critical applications.
- Identify and address any application downtime.
User Experience:
- Use synthetic monitoring to simulate end-user interactions.
- Assess the user experience for key applications.


Network Health Monitoring is a dynamic process that requires strategic planning and execution. Two key considerations in this process are the approach to monitoring—real-time versus periodic checks. Choosing the right approach to network health monitoring is pivotal for maintaining a resilient and responsive digital infrastructure. Let’s dive into choosing the right approach for your business!
Real-time monitoring involves a constant, uninterrupted stream of data that provides immediate insights into the current state of the network. This continuous monitoring ensures that administrators have a real-time view of network performance, allowing them to detect issues the moment they occur.
Proactive Issue Resolution:
With real-time monitoring, administrators can proactively address issues the moment they occur. This minimizes downtime, enhances user experience, and ensures the network operates at peak performance.
Early Warning Systems:
Real-time monitoring serves as an early warning system, alerting administrators to anomalies, potential security threats, or abnormal behaviour. This proactive approach is essential for preventing major disruptions.
Continuous User Experience Monitoring:
Applications and services are monitored continuously, allowing for real-time assessment of user experience. This is crucial for maintaining high levels of user satisfaction and productivity.
Leveraging Continuous Network Health Monitoring Solutions
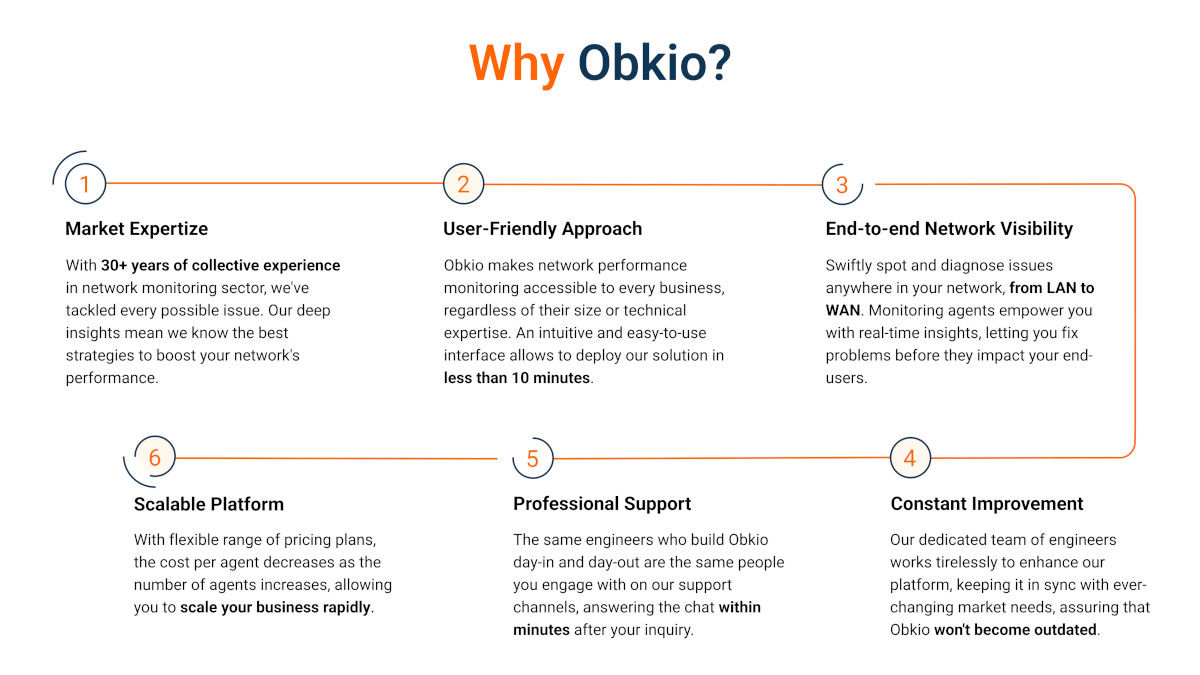
Obkio's Network Performance Monitoring tool keeps a constant eye on your network. Placed strategically in key locations, it uses synthetic traffic to give real-time insights into bandwidth, latency, packet loss, and more. With features like visual traceroutes and troubleshooting tools, it helps you spot and fix issues pronto. It's not just monitoring; it's keeping your network in top shape. And the best part? It easily integrates with other tools for a comprehensive check.

Periodic checks are scheduled at intervals, allowing administrators to allocate monitoring resources efficiently, especially in environments with limited monitoring capacity.
Scheduled Assessments:
Administrators can schedule regular assessments during off-peak hours, minimizing the impact on network performance. This ensures that monitoring activities don't disrupt normal operations.
Lower Alert Noise:
Periodic checks may result in lower alert noise since assessments occur at specified intervals. This can reduce the likelihood of false positives and allow administrators to focus on critical issues.
The Disadvantages:
Periodic checks may not catch issues as they happen. The time gap between assessments could lead to delayed identification and resolution of network issues.
- Consider Network Criticality: Real-time monitoring is often more suitable for mission-critical networks where immediate detection and resolution of issues are paramount. Periodic checks may be sufficient for less critical environments.
- Balancing Act: Some networks benefit from a hybrid approach, combining real-time monitoring for critical components with periodic checks for less critical elements. This balances resource utilization and responsiveness.
- Tool Selection: The effectiveness of either strategy depends on the monitoring tools in use. Choosing tools that align with your network's needs and capabilities is crucial for successful implementation.
Selecting between real-time network health monitoring and periodic checks is a strategic decision that should align with your network's specific requirements, criticality, and available resources. A thoughtful approach, possibly combining elements of both strategies, ensures a robust and effective network health monitoring system.
Network Health Monitoring is a proactive practice that involves recognizing and addressing common challenges that can impact the stability and performance of your network. By identifying these challenges early on, you can implement strategic measures to mitigate potential issues.
Before we get into the details, here are some things to keep in mind:
- Baseline Performance Metrics: Establish baseline metrics for network performance and regularly compare against them.
- User Feedback: Actively gather feedback from users to identify issues that may not be immediately apparent through monitoring tools.
- Periodic Audits: Conduct periodic network audits to assess overall health and identify potential areas for improvement.
Maintaining a healthy network requires vigilant monitoring and a keen awareness of early indicators that something may be amiss. Recognizing these warning signs empowers administrators to take swift action, minimizing potential disruptions and ensuring optimal network performance.
1. Unexplained Network Slowdowns:
Users report a noticeable slowdown in network performance without any apparent cause. This can lead to network congestion, potential bandwidth saturation, or issues with critical network components.
- Investigate bandwidth utilization and identify any anomalies.
- Review performance metrics for key network devices to pinpoint potential bottlenecks.
2. Increased Latency and Response Time:
Users experience delays in accessing applications or services, especially those requiring real-time responsiveness. That can lead to high latency, jitter, or routing issues impacting data transmission.
- Monitor latency metrics and identify sources of delay.
- Analyze routing tables and paths using visual traceroutes.
3. Packet Loss:
Increased reports of data inconsistency, dropped connections, or distorted audio/video quality.
Implications:
- Regularly check packet loss metrics for network segments.
- Investigate potential issues with network devices or connectivity.

4. Device Downtime or Unavailability:
Network devices, such as routers, switches, or servers, experience unexpected downtime. This can lead to hardware failures, software issues, or misconfigurations impacting device availability.
- Implement device health monitoring to receive real-time alerts for downtime.
- Conduct a thorough review of logs and diagnostics to identify the root cause.
5. Application Errors and Downtime:
Users frequently encounter errors when accessing applications, or applications go offline unexpectedly. This can be caused by application performance issues, server failures, or connectivity problems.
- Monitor application response times and user interactions.
- Collaborate with application developers to optimize performance.
6. Unusual Network Traffic Patterns:
Anomalies in network traffic, such as unexpected spikes or patterns inconsistent with normal This can be due to potential security threats, malware activity, or inefficient data transfer.
- Utilize traffic analysis tools to identify unusual patterns.
- Implement intrusion detection systems to detect and respond to suspicious behaviour.
By staying vigilant and responsive to these early warning signs, network administrators can implement timely interventions, address root causes, and maintain a resilient and high-performing network infrastructure. Regular monitoring, analysis, and proactive measures are key to ensuring the sustained health and efficiency of your network.
While your Network Monitoring tool will help you identify these network problems for you, here are key areas to focus on:
- Bandwidth Saturation: Networks often face the risk of bandwidth saturation, where the available capacity is exceeded by the volume of data traffic. This can lead to slow performance, increased latency, and an overall degradation of user experience.
- Network Congestion: Network congestion occurs when there is a high volume of traffic in a particular network segment, leading to delays and packet loss. Congestion can result in slow data transfer rates, increased latency, and disruptions in service.
- Security Threats and Breaches: Network security is a perpetual concern, with threats ranging from malware and phishing to unauthorized access attempts. Security breaches can compromise sensitive data, disrupt operations, and lead to financial and reputational damage.
- Device Failures: Network devices, such as routers, switches, and servers, can experience failures due to hardware issues or software bugs. Device failures can result in network downtime, affecting connectivity and services.
- Latency and Jitter Issues: Latency, the delay in data transmission, and jitter, the variation in delay, can impact real-time applications. High latency and jitter can result in poor performance for applications like VoIP (VoIP latency) and video conferencing.
- Application Performance Issues: Poorly performing applications can lead to dissatisfaction among users and hinder productivity. Slow application response times can negatively impact user experience and overall operational efficiency.
- Inadequate Capacity Planning: Failure to anticipate future network growth and capacity needs can lead to resource shortages. Inadequate network capacity planning may result in network congestion, slower performance, and increased likelihood of failures.
By proactively addressing these common network health challenges through continuous monitoring and strategic measures, you can enhance the overall resilience and performance of your network.
Learn how to identify network issues by looking at common problems, causes, consequences and solutions.
Learn more

Network Health Monitoring serves as the backbone for ensuring a seamless digital experience, directly impacting User Experience, Network Performance, and Business Productivity. In this section, we explore how vigilant monitoring contributes to swift issue resolution, optimized network performance, and uninterrupted business operations.
Swift Issue Resolution:
Network Health Monitoring allows for the swift identification and resolution of potential issues that could impact the end-user experience. By continuously monitoring network performance metrics such as latency, bandwidth, and packet loss in real-time, administrators can proactively address any anomalies, ensuring a smooth and responsive user experience.
Application Responsiveness:
Monitoring network health is essential for assessing the performance of applications. Real-time insights into application responsiveness enable administrators to optimize application delivery, minimizing delays and ensuring that users can interact seamlessly with software and services.
Minimizing Downtime:
By promptly detecting and addressing network issues, Network Health Monitoring helps minimize downtime. Reduced downtime translates to uninterrupted access to critical applications and services, enhancing user satisfaction and productivity.
Proactive Issue Identification:
Continuous monitoring enables the proactive identification of network performance issues before they escalate. Administrators can pinpoint areas of congestion, latency, or packet loss, allowing for targeted interventions and optimizations to maintain optimal network performance.
Capacity Planning:
Network Health Monitoring provides insights into network usage trends, enabling effective capacity planning. By analyzing historical data and anticipating future demands, administrators can ensure that the network infrastructure can accommodate growing user needs without compromising performance.
Optimization of Resources:
Efficient use of network resources is essential for maintaining high performance. Monitoring bandwidth utilization, device connectivity, and throughput helps administrators optimize resource allocation, preventing bottlenecks and ensuring a responsive and efficient network.
Uninterrupted Operations:
A healthy network is fundamental to business continuity. Network Health Monitoring helps ensure that operations run smoothly without disruptions. Uninterrupted access to critical applications and data translates to consistent business productivity.
Rapid Response to Issues:
With real-time monitoring, administrators can respond rapidly to network issues, minimizing the impact on business operations. Swift resolutions contribute to maintaining a productive work environment and preventing potential revenue losses associated with downtime.
Enhanced Collaboration:
Efficient and reliable network performance facilitates seamless communication and collaboration among employees. A healthy network supports the use of collaboration tools, video conferencing, and cloud-based applications, fostering teamwork and enhancing overall business productivity.
Network Health Monitoring directly impacts User Experience, Network Performance, and Business Productivity by providing administrators with the insights and tools needed to ensure a responsive, efficient, and resilient network infrastructure. It not only enhances the end-user experience but also contributes to the overall success and productivity of the organization.

As organizations experience growth, their network infrastructures evolve in complexity and scale. In this section, we explore the critical considerations and strategies for effectively scaling up Network Health Monitoring. Navigating the challenges posed by expanding infrastructures, we delve into solutions that address increased complexity, data volume, and resource allocation.
Let’s get into it!
- Increased Complexity:
As network infrastructures grow, complexity follows suit. Managing a larger number of devices, diverse applications, and intricate network paths introduces challenges in maintaining a comprehensive view of the entire network.
- Data Volume and Processing:
The sheer volume of data generated by a growing network can overwhelm monitoring systems. Processing and analyzing this data in real-time becomes challenging, potentially leading to delays in issue identification and resolution.
- Resource Allocation:
Allocating monitoring resources efficiently becomes more complex with a larger infrastructure. Ensuring that critical components are adequately monitored while avoiding resource bottlenecks becomes a delicate balancing act.
Solutions:
- Scalable Monitoring Architecture:
Adopting a scalable monitoring architecture is crucial. Distributed monitoring systems, where monitoring agents are strategically placed across the network, allow for effective scaling without compromising performance.

1. Centralized Monitoring Dashboard:
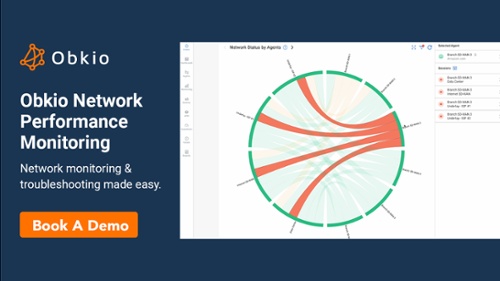
Establish a centralized network monitoring dashboard that provides a unified view of the entire network. This enables administrators to quickly assess the health of various components and identify potential issues.
2. Distributed Monitoring Agents:
Deploy monitoring agents strategically across diverse locations within the network. This distributed approach ensures comprehensive coverage and allows for localized monitoring tailored to specific network segments.
3. Granular Performance Metrics:
Collect granular network performance metrics to gain detailed insights into the health of individual network components. This level of granularity facilitates targeted troubleshooting and optimization efforts.
4. Prioritized Alerting:
Implement prioritized alerting mechanisms to focus attention on critical issues. Categorizing alerts based on severity ensures that administrators can promptly address high-priority concerns that may impact overall network health.
5. Scalable Analytics:
Choose monitoring tools with scalable analytics capabilities. Scalable analytics enable efficient processing of large datasets, supporting real-time analysis and reporting even in expansive network environments.
6. Periodic Network Assessments:
Conduct periodic network assessments to evaluate the scalability and efficiency of the monitoring infrastructure. These assessments help identify potential bottlenecks and areas for optimization as the network continues to grow.
7. Collaboration with IT Teams:
Foster collaboration between different IT teams, including network, security, and operations. A cohesive approach ensures that all aspects of network health are considered, leading to comprehensive and effective monitoring strategies.
In navigating the challenges of scaling up network health monitoring, a combination of scalable architecture, advanced technologies, and strategic best practices ensures that large-scale infrastructures can be monitored effectively and efficiently. This proactive approach supports continued growth while maintaining the resilience and performance of the network.
So, as we close the chapter on understanding the heartbeat of your network, remember this isn't just about tech jargon and data streams. It's about ensuring that every digital pulse in your network keeps the rhythm of efficiency and reliability.
Now, for the real talk – if you're ready to take the reins of your network health, make life easier, and ensure your users never face a buffering wheel of doom, here's the deal: Dive into the world of Obkio. Obkio’s Network Performance Monitoring tool is like a superhero for your network. Real-time insights, user-friendly, and it’s the perfect addition to your network admin toolkit for understanding and optimizing network health!
Don't let your network navigate the digital seas blindfolded. Head over to Obkio's website and let your network thank you for the upgrade. After all, a smooth network isn't just a luxury; it's a necessity. Your users will thank you, and so will your sanity.
Let's make your network journey as smooth as a Sunday drive.
- 14-day free trial of all premium features
- Deploy in just 10 minutes
- Monitor performance in all key network locations
- Measure real-time network metrics
- Identify and troubleshoot live network problems


 Obkio Blog


