Table of Contents
Table of Contents
Network performance directly impacts business productivity, user experience, and revenue. When applications lag, video calls freeze, or file transfers stall, the root cause often lies in untested network infrastructure. Yet many organizations monitor their networks reactively—only testing performance after problems emerge.
This article shows you how to proactively test network performance using proven methodologies that identify issues before they affect users. You'll learn eight testing techniques, understand which metrics matter most, and discover how to implement continuous monitoring that prevents downtime.
Whether you're troubleshooting intermittent latency, planning infrastructure upgrades, or ensuring SLA compliance, network performance testing provides the visibility needed to maintain reliable connectivity. Modern networks supporting SD-WAN, UCaaS, and cloud applications demand rigorous testing across multiple locations and protocols.
In this article, you'll discover:
- Why network testing matters for modern businesses
- 8 essential testing techniques and when to use each
- How to deploy automated monitoring tools
- Which metrics indicate performance problems
- Strategies for testing LANs, WANs, and hybrid environments
- Optimization tactics based on test results
Network performance testing measures how well a network transmits data by evaluating metrics like latency (delay in ms), throughput (data transfer rate), packet loss (%), jitter (timing variation), and bandwidth utilization. Testing identifies bottlenecks, ensures reliability, and optimizes user experience through continuous monitoring and analysis.
Network performance testing measures how effectively your network transmits data by evaluating these key metrics:
- Latency: Delay between sending and receiving data (measured in milliseconds)
- Throughput: Actual data transfer rate achieved (Mbps or Gbps)
- Packet loss: Percentage of data packets that fail to reach their destination
- Jitter: Variation in packet arrival times (critical for real-time applications)
- Bandwidth utilization: Percentage of available capacity currently in use
Testing identifies bottlenecks, verifies capacity planning, validates ISP performance, and ensures applications receive adequate resources. Unlike one-time speed tests, comprehensive testing involves continuous monitoring that tracks performance trends, detects anomalies, and provides historical baselines for troubleshooting.
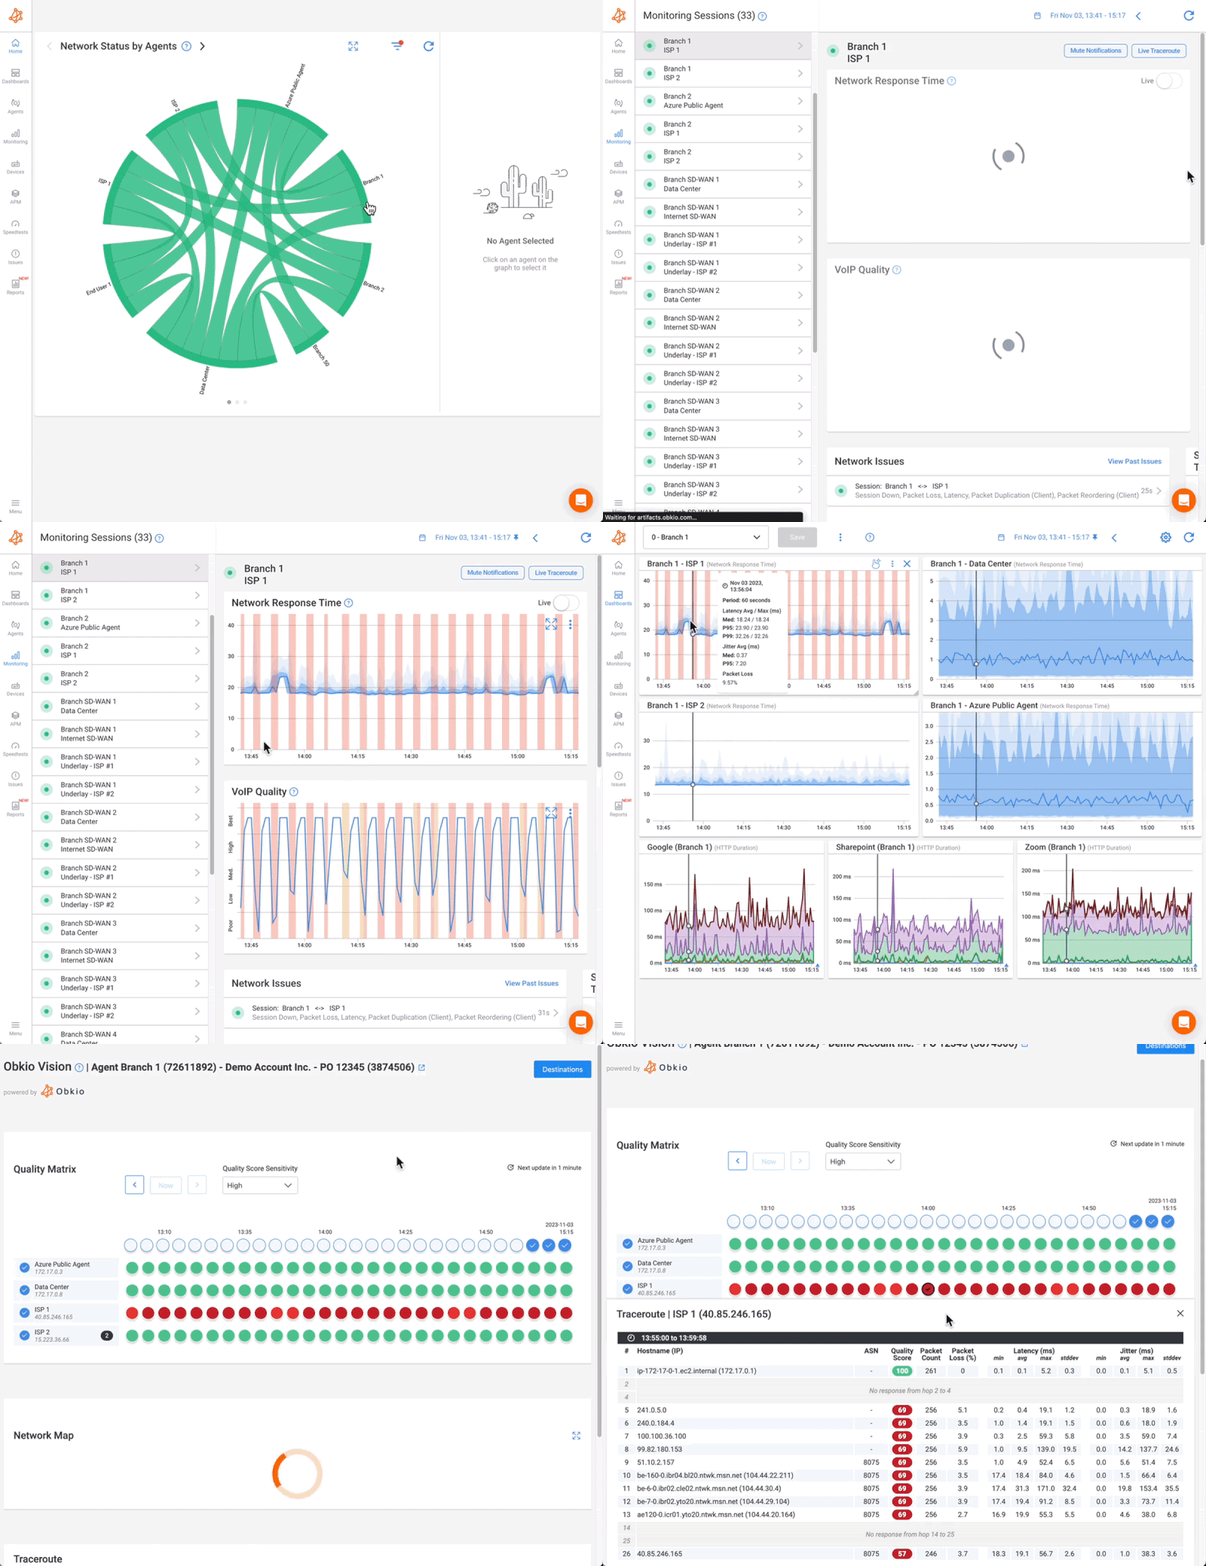
 Screenshot from Obkio's Network Monitoring Tool
Organizations that implement continuous network performance testing experience measurable improvements:
Operational Efficiency:
- 40-60% reduction in mean time to resolution (MTTR) for network issues
- 35% fewer network-related user support tickets
- 50% faster troubleshooting with historical performance baselines
Cost Savings:
- Average $5,600 per minute cost of network downtime for enterprises
- 78% of network issues detected before impacting users with proactive testing
- 45% reduction in truck rolls and on-site troubleshooting for distributed networks
User Experience:
- 92% of users abandon applications experiencing latency over 2 seconds
- VoIP call quality degrades noticeably with jitter above 30ms
- Packet loss above 1% causes significant degradation in video conferencing
Obkio continuously tests network performance using distributed monitoring agents that exchange synthetic traffic between locations. This approach measures actual data path performance—latency, jitter, packet loss, and throughput—across LANs, WANs, SD-WAN, and cloud connections.
Why network teams choose Obkio for performance testing:
- Deploy monitoring agents in under 10 minutes
- Detect issues in real-time with 500ms polling intervals
- Pinpoint problems using visual traceroutes
- Compare performance against historical baselines
- Monitor network devices via SNMP polling
- Access 14-day free trial with no credit card required
Unlike one-time speed tests or reactive monitoring, Obkio provides continuous visibility into network performance across all critical locations.

Effective network performance testing requires multiple measurement approaches. Each technique targets specific performance aspects and reveals different potential issues. Most network teams use 3-5 of these techniques simultaneously for comprehensive visibility.
Throughput measures actual data transfer rate (Mbps or Gbps) to determine network capacity and efficiency.
When to use: Validating circuit speeds, testing after bandwidth upgrades, identifying capacity constraints
Acceptable thresholds:
- LAN: 900+ Mbps on 1Gbps connections
- WAN: 90%+ of subscribed bandwidth
- WiFi: 50-70% of theoretical maximum
Common tools: Iperf, Obkio, Network Speed Test

Latency measures round-trip delay (in milliseconds) between network endpoints to assess responsiveness.
When to use: Troubleshooting application slowness, testing real-time services, evaluating WAN circuits
Acceptable thresholds:
- LAN: <5ms
- Regional WAN: <50ms
- International WAN: <150ms
- VoIP/video: <100ms
What causes high latency: Distance, routing inefficiencies, congestion, underpowered devices
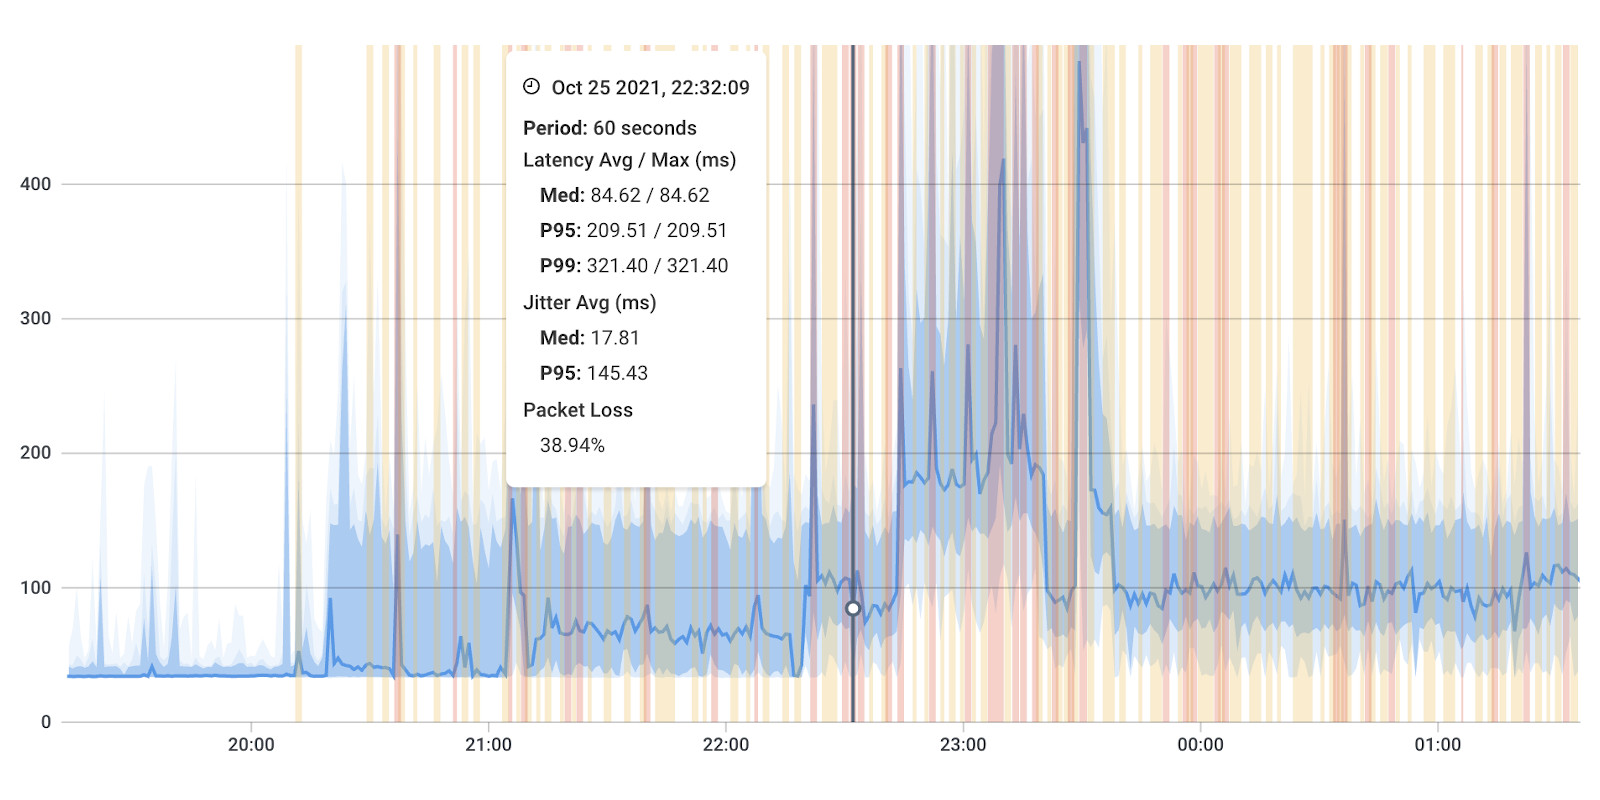
Packet Loss identifies percentage of data packets that fail to reach their destination.
When to use: Diagnosing application errors, investigating quality issues, testing after configuration changes
Acceptable thresholds:
- Data applications: <0.5%
- VoIP: <1%
- Video conferencing: <0.5%
- Any loss >1% requires immediate investigation
Common causes: Network congestion, faulty hardware, buffer overflows, misconfigurations

Jitter measures variation in packet arrival times (milliseconds) that disrupts real-time applications.
When to use: Troubleshooting VoIP quality, diagnosing video freezing, testing UCaaS performance
Acceptable thresholds:
- VoIP: <20ms
- Video conferencing: <30ms
- Standard data: <50ms
What causes jitter: Network congestion, inadequate QoS policies, routing changes, wireless interference

Bandwidth monitors percentage of available bandwidth currently in use across network segments.
When to use: Capacity planning, identifying congestion, rightsizing circuits, optimizing costs
Acceptable thresholds:
- Normal operations: 40-60%
- Peak periods: 70-80%
- Sustained >80%: Upgrade required
- Approaching 100%: Critical capacity issue
Analysis tip: Monitor trends over weeks/months rather than snapshots
Network Stress Testing Simulates extreme traffic conditions to identify breaking points and capacity limits.
When to use: Before major deployments, capacity planning, disaster recovery validation, merger integrations
What to test:
- Maximum concurrent connections
- Peak bandwidth consumption
- Failover performance
- Device CPU/memory under load
Best practices: Test during maintenance windows, document baseline performance, compare against business requirements
QoS validates traffic prioritization policies ensure critical applications receive necessary bandwidth.
When to use: After QoS policy changes, troubleshooting application performance, validating SD-WAN configurations
What to verify:
- Voice traffic prioritized over data
- Business-critical apps receive guaranteed bandwidth
- Low-priority traffic deprioritized during congestion
- DSCP markings preserved across network
Testing approach: Generate competing traffic types and verify prioritization occurs

Maintains real-time visibility into all performance metrics across the entire network infrastructure.
When to use: Always—continuous monitoring is foundational, not optional
Key capabilities:
- Sub-minute polling intervals for rapid issue detection
- Historical baselining to identify performance trends
- Automated alerting when thresholds are exceeded
- Path analysis to pinpoint failure locations
Why it's different: Unlike one-time tests, continuous monitoring detects intermittent issues and provides context for troubleshooting
Network testing employs two fundamental approaches: active testing generates synthetic traffic to measure performance, while passive testing observes existing traffic without injection. Each method serves distinct purposes and reveals different network characteristics.
Active testing injects synthetic traffic into the network to measure specific performance parameters under controlled conditions. This approach provides predictable, repeatable results that validate network capacity and identify issues before they affect users.
When to use active testing:
- Validating new circuit installations
- Testing performance between specific locations
- Establishing performance baselines
- Proactive monitoring before problems occur
- Measuring end-to-end user experience
1. Synthetic Monitoring
Continuously generates lightweight test traffic between monitoring agents to measure latency, jitter, packet loss, and throughput in real-time. This is the core monitoring and testing technique used by Obkio's Network Monitoring Tool
How it works: Monitoring agents exchange UDP packets (typically 100-200 bytes) every 500ms-1000ms, simulating application traffic patterns without consuming significant bandwidth.
What it measures:
- End-to-end latency between locations
- Packet loss percentage across paths
- Jitter variations for real-time applications
- Network availability and uptime
Best for: Continuous monitoring across LANs, WANs, SD-WAN, and cloud connections

2. ICMP Testing (Ping)
Sends ICMP echo requests to measure basic connectivity and round-trip time to network devices.
How it works: Transmits ICMP packets to a destination and measures response time, identifying reachability and basic latency.
What it measures:
- Basic connectivity (device reachable or not)
- Round-trip latency
- Packet loss during transmission
Limitations: Many firewalls block ICMP, results don't reflect actual application performance, limited detail compared to synthetic monitoring
Best for: Quick connectivity checks, basic troubleshooting, device availability monitoring
 Screenshot from Obkio's ICMP Monitoring Tool
3. Throughput and Bandwidth Testing
Generates high-volume traffic to measure maximum data transfer capacity between network endpoints.
How it works: Sends large volumes of TCP or UDP traffic to saturate the connection and measure achieved throughput.
What it measures:
- Maximum achievable throughput (Mbps/Gbps)
- TCP window size optimization
- Circuit speed validation
- Bandwidth limitations
Best for: New circuit validation, speed test verification, capacity planning
Tools: Iperf3, Obkio Speed Test, Network Speed Test tools
4. Network Stress Testing
Simulates extreme traffic conditions to identify capacity limits and breaking points.
How it works: Gradually increases simulated users, connections, or traffic volume until performance degrades or failures occur.
What it measures:
- Maximum concurrent connections before failure
- Device CPU/memory limits under load
- Failover system performance
- Exact breaking point thresholds
Best for: Pre-deployment validation, capacity planning, disaster recovery testing
Passive testing monitors and analyzes actual network traffic without injecting additional data. This approach captures real-world usage patterns and application behavior as they naturally occur.
When to use passive testing:
- Analyzing actual application traffic patterns
- Troubleshooting specific protocol issues
- Understanding bandwidth consumption by application
- Investigating security incidents
- Forensic analysis of past events
1. Packet Capture and Deep Packet Inspection
Captures complete packet data for detailed protocol-level analysis.
How it works: Network interface operates in promiscuous mode, copying all passing traffic for analysis. Captures full packet headers and payloads.
What it reveals:
- Protocol-specific errors (TCP retransmissions, HTTP errors)
- Application-level issues
- Security threats or suspicious traffic
- Detailed timing information between packets
Limitations: Resource-intensive, generates large data volumes, doesn't predict future issues, privacy concerns with payload inspection
Best for: Deep troubleshooting specific issues, security analysis, protocol debugging
2. Flow-Based Analysis (NetFlow/sFlow/IPFIX)
Collects metadata about traffic flows without capturing full packet contents.
How it works: Network devices export flow records containing source/destination IPs, ports, protocols, byte counts, and timestamps—not actual payload data.
What it reveals:
- Top talkers (which hosts consume most bandwidth)
- Application identification by port/protocol
- Traffic patterns and trends over time
- Bandwidth utilization by department/location
Advantages: Lower resource consumption than packet capture, scalable across large networks, historical trending
Best for: Bandwidth analysis, capacity planning, application visibility, security anomaly detection
3. SNMP Polling for Device Metrics
SNMP Device Monitoring queries network devices for performance counters and status information.
How it works: Periodically queries devices via SNMP (Simple Network Management Protocol) to collect interface statistics, CPU usage, memory utilization, and error counts.
What it reveals:
- Interface utilization and errors
- Device CPU and memory usage
- Port status (up/down)
- Hardware health (temperature, fan speed)
Polling frequency: Typically 1-5 minutes (slower than active synthetic monitoring)
Best for: Device health monitoring, capacity planning, hardware troubleshooting

Testing network performance across multiple techniques can be a complex and time-consuming task. However, there's a simpler and more efficient way to achieve comprehensive network monitoring and testing. Enter Obkio's powerful Network Monitoring tool, designed to simplify the process and provide you with invaluable insights into your network's performance.
With Obkio, you can effortlessly perform throughput testing, latency testing, packet loss testing, jitter testing, and bandwidth testing, all from a centralized platform. Obkio’s tool offers a comprehensive suite of monitoring capabilities that empower businesses and network administrators to optimize their network's performance with ease.
Let's explore how to test network performance with Obkio, step-by-step:
Harnessing the power of a comprehensive Network Monitoring tool simplifies and streamlines the process of testing network performance. With a single solution like Obkio's Network Monitoring tool, businesses and network administrators can efficiently perform various performance testing techniques and gain deep insights into their network's health.
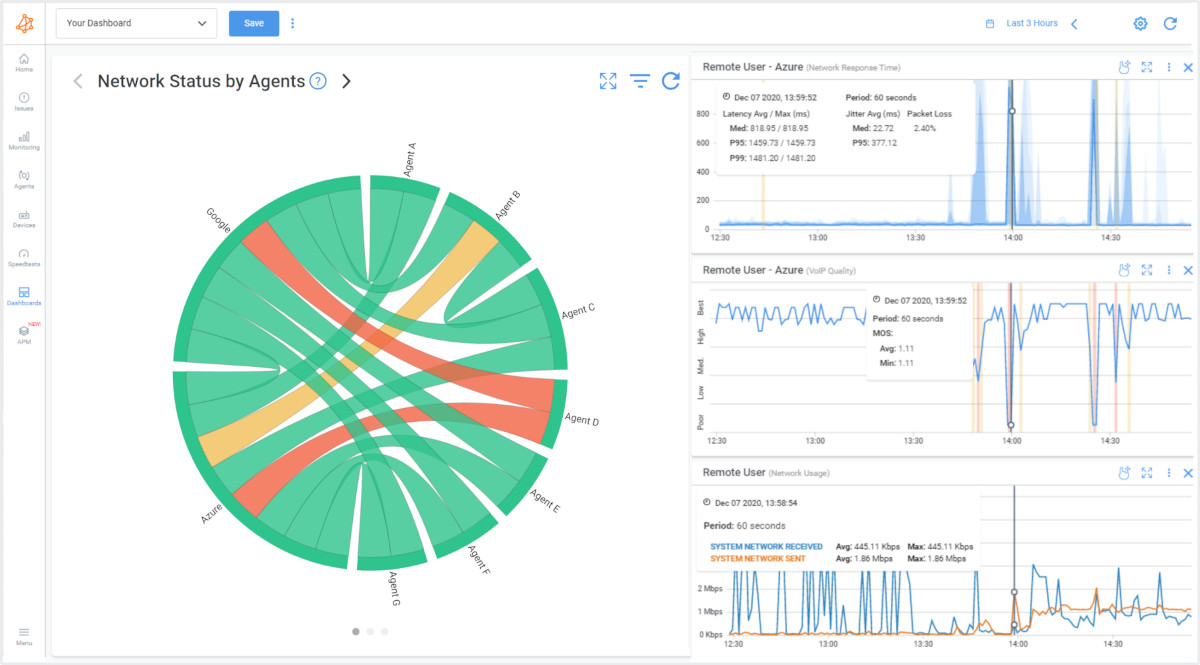
By leveraging Obkio's Network Monitoring tool, you can streamline the way you monitor and test network performance, saving time and resources while maximizing the efficiency of your network infrastructure. Take control of your network's performance today and unlock the true potential of your business with Obkio.
- Proactively identify network issues, troubleshoot problems, and ensure a seamless user experience.
- Monitoring key performance metrics in real-time to gain deep visibility into your network's health
- Get easy-to-understand visualizations, alerts for anomalies, and historical data analysis to promptly take action to address any bottlenecks or performance limitations
Say goodbye to manual testing and cumbersome troubleshooting processes -

With Obkio, testing network performance is end-to-end, which means monitoring the network's performance from the source to the destination. This comprehensive approach allows for the identification of issues across various network segments, including routers, switches, firewalls, and application servers.
This is done using Obkio’s Network Monitoring Agents. The Network Monitoring Agents are deployed at key network locations like workstations, the head office, branch offices, data centers, private clouds, public clouds, and more, and exchange synthetic traffic to monitor and test network performance.
For your initial setup, we recommend deploying:
- Local Agents: Installed in the targeted office locations where you want to test network performance. There are several Agent types available (all with the same features), and they can be installed on MacOS, Windows, Linux and more.
- Public Monitoring Agents: Deployed over the Internet and managed by Obkio. They compare and test network performance up to the Internet and quickly identify if the problem is global or specific to the destination. This will be great information for later in the troubleshooting process. You can use an AWS or Google Cloud Agent.
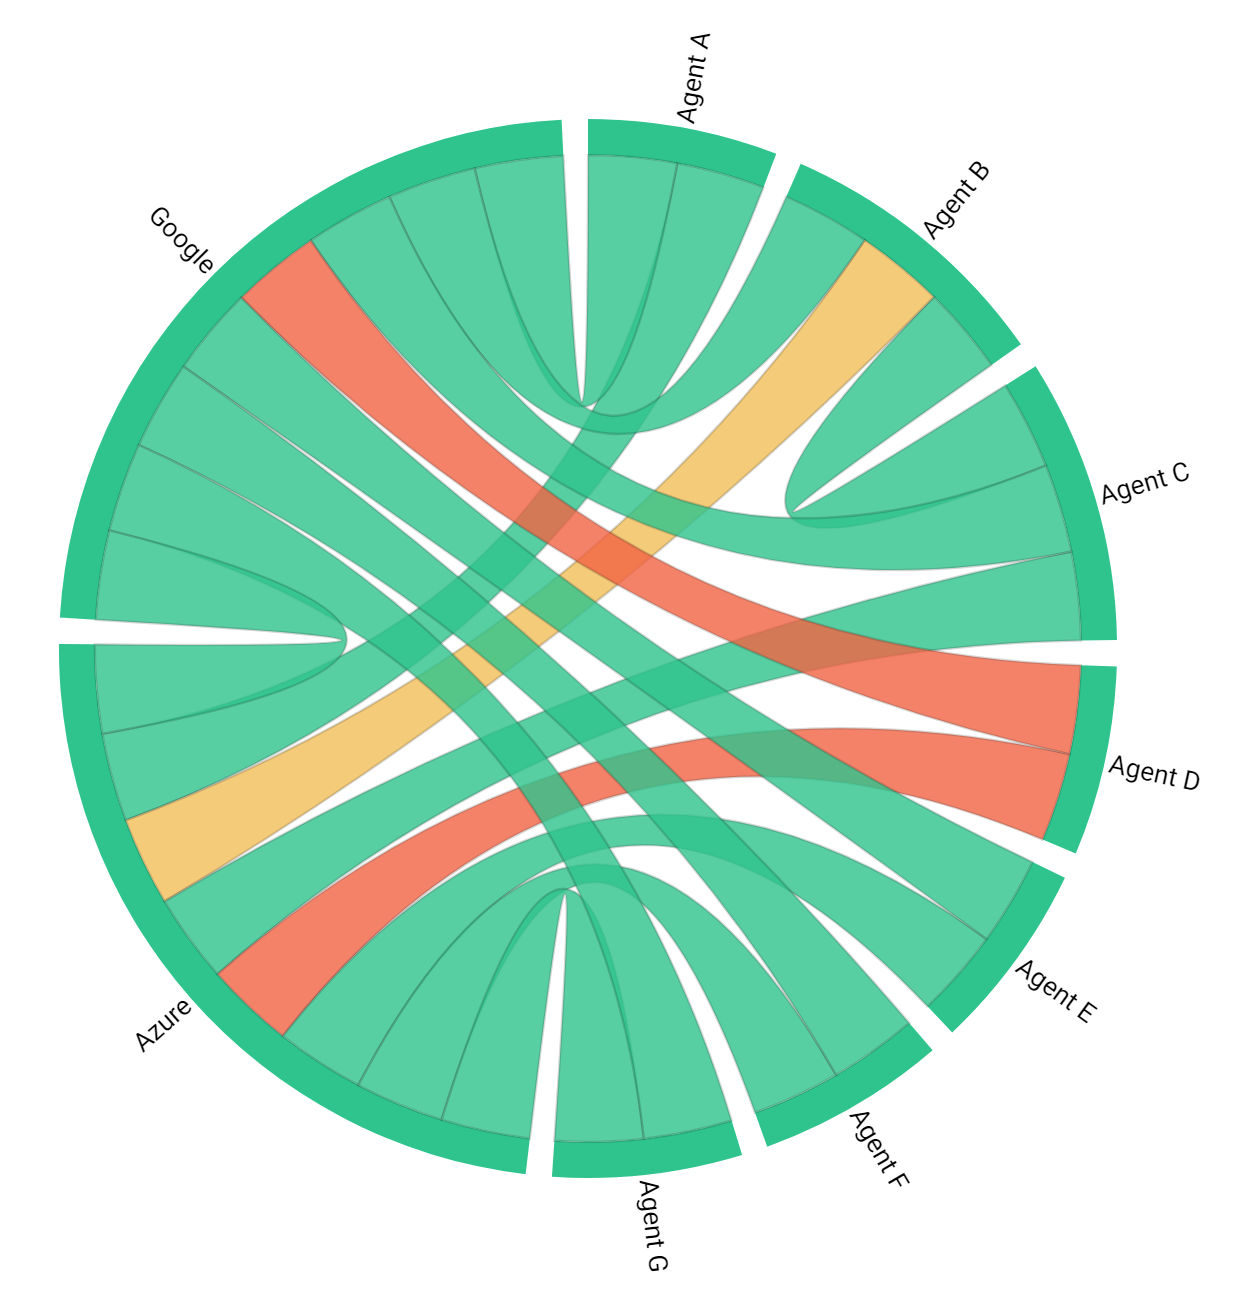
Once you’ve deployed Obkio Monitoring Agents in key network locations, they will test and measure key network metrics and display them on Obkio’s Network Response Time Graph. Testing network metrics is key for understanding the health of your network, identifying and resolving issues, ensuring a smooth user experience, and maintaining a high-performing network infrastructure.
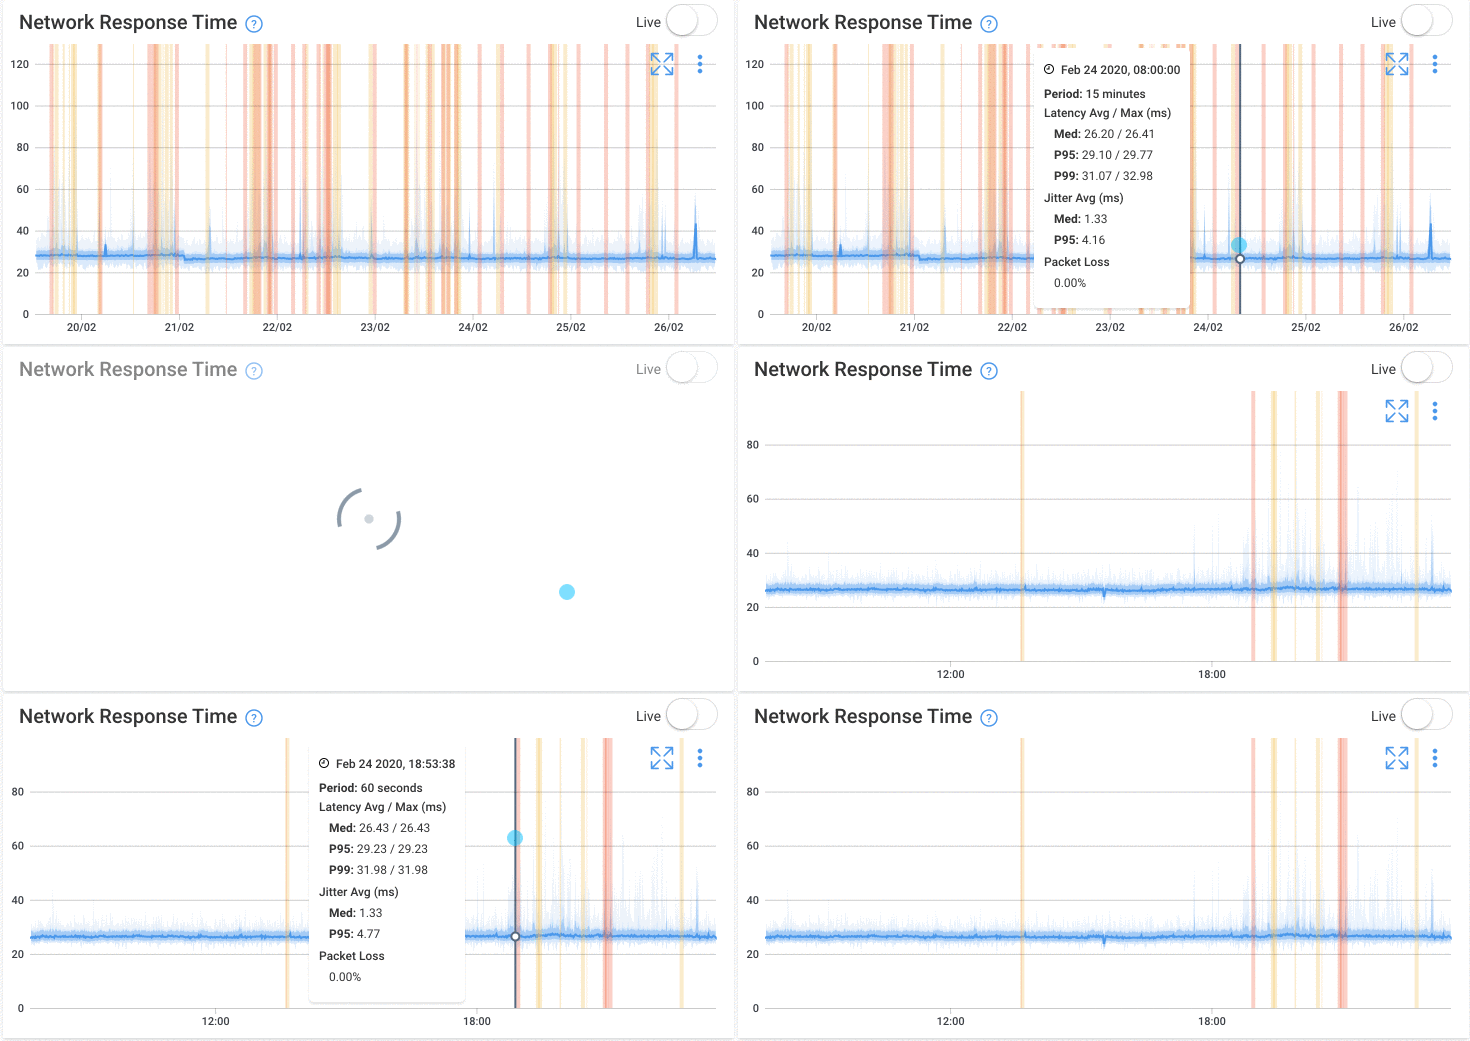
Here are some key network metrics you'll need to measure to test network performance:
- Jitter: Jitter represents the variation in the delay of received packets. It can cause disruptions and inconsistencies in real-time applications. Measuring jitter helps assess and test network stability and ensures a smooth and consistent data flow.
- Packet loss: Packet loss refers to the percentage of data packets that fail to reach their intended destination. Monitoring packet loss helps identify network congestion, faulty equipment, or other issues that may impact data integrity and application performance.
- Latency: Latency measures the delay between data transmission and its arrival at the destination. It is crucial for assessing the responsiveness of the network. Measuring latency helps identify potential bottlenecks and ensures optimal performance for real-time applications like VoIP (VoIP latency).
- Throughput: Throughput measures the amount of data that can be transmitted over the network within a given time frame. It helps evaluate the network's capacity and efficiency, ensuring it can handle the expected workload and support high-performance applications.
- Bandwidth Utilization: Bandwidth utilization measures the percentage of available network bandwidth being used. Monitoring bandwidth utilization helps identify potential congestion points and ensures that sufficient bandwidth is allocated to critical applications.
- Network Errors: Network errors encompass various types of errors, such as CRC errors, packet collisions, or interface errors. Monitoring network error rates helps identify underlying issues, such as faulty hardware or misconfigurations, which can impact network performance.
- Network Response Time: Network response time measures the time it takes for a system or application to respond to a request. It is particularly important for client-server interactions and user experience. Monitoring response time helps ensure that applications are performing optimally and meeting expected service level agreements (SLAs).
- Network Availability: Network availability measures the percentage of time that the network is operational and accessible. Monitoring network availability helps identify periods of downtime, disruptions, or outages, enabling proactive measures to minimize service interruptions.
By measuring these network metrics, businesses and network administrators can gain a holistic view of their network's performance, identify areas for improvement, and proactively address issues that may impact user experience, productivity, and overall operational efficiency.
To effectively test network performance, it is important to assess various network devices that play a crucial role in data transmission and connectivity. Here are some key network devices that should be tested:
- Routers: Routers are responsible for directing network traffic between different networks or subnets. Testing routers helps evaluate their performance in terms of routing efficiency, throughput, latency, and handling various network protocols.
- Throughput: Measure the amount of data the router can process per unit of time.
- Latency: Assess the delay experienced by data packets as they traverse the router.
- Switches: Switches facilitate communication between devices within a local network. Testing network switches can assess their capacity, throughput, latency, and ability to handle multiple concurrent connections.
- Throughput: Measure the switch's capacity to handle data traffic within the local network.
- Latency: Evaluate the delay introduced by the switch during data transmission.
- Port utilization: Monitor the usage levels of individual switch ports to identify potential bottlenecks.
- Firewalls: Firewalls provide network security by monitoring and controlling incoming and outgoing traffic. Testing firewalls help evaluate their performance impact on network speed, throughput, and latency, while ensuring that security policies and rules are properly implemented.
- Throughput: Measure the firewall's capacity to process and inspect network traffic.
- Latency: Assess the delay introduced by the firewall in analyzing and filtering data packets.
- Connection limits: Determine the maximum number of simultaneous connections the firewall can handle.
- Load Balancers: Load balancers distribute network traffic across multiple servers to optimize performance and ensure high availability. Testing load balancers help assess their ability to evenly distribute traffic, handle increased loads, and maintain network performance under heavy usage.
- Throughput: Measure the load balancer's ability to evenly distribute traffic among servers.
- Latency: Assess the delay introduced by the load balancer during the traffic distribution process.
- Server health monitoring: Monitor the load balancer's capability to detect and route traffic away from unhealthy servers.
- Wireless Access Points (WAPs): WAPs enable wireless connectivity in a network. Testing WAPs includes evaluating their coverage, signal strength, throughput, and latency to ensure optimal wireless performance and connectivity.
- Signal strength: Measure the strength and coverage of the wireless signal provided by the WAP.
- Throughput: Assess the WAP's capacity to handle wireless data transmission.
- Latency: Evaluate the delay experienced by wireless devices in connecting to the network through the WAP.
- Network Interface Cards (NICs): NICs are hardware components that connect devices to a network. Testing NICs helps ensure they operate at desired speeds, handle high data volumes efficiently, and maintain reliable network connectivity.
- Throughput: Measure the maximum data transfer rate supported by the NIC.
- Packet loss: Monitor the rate of dropped packets during data transmission.
- Error rate: Assess the occurrence of errors, such as CRC errors or alignment errors, on the NIC.
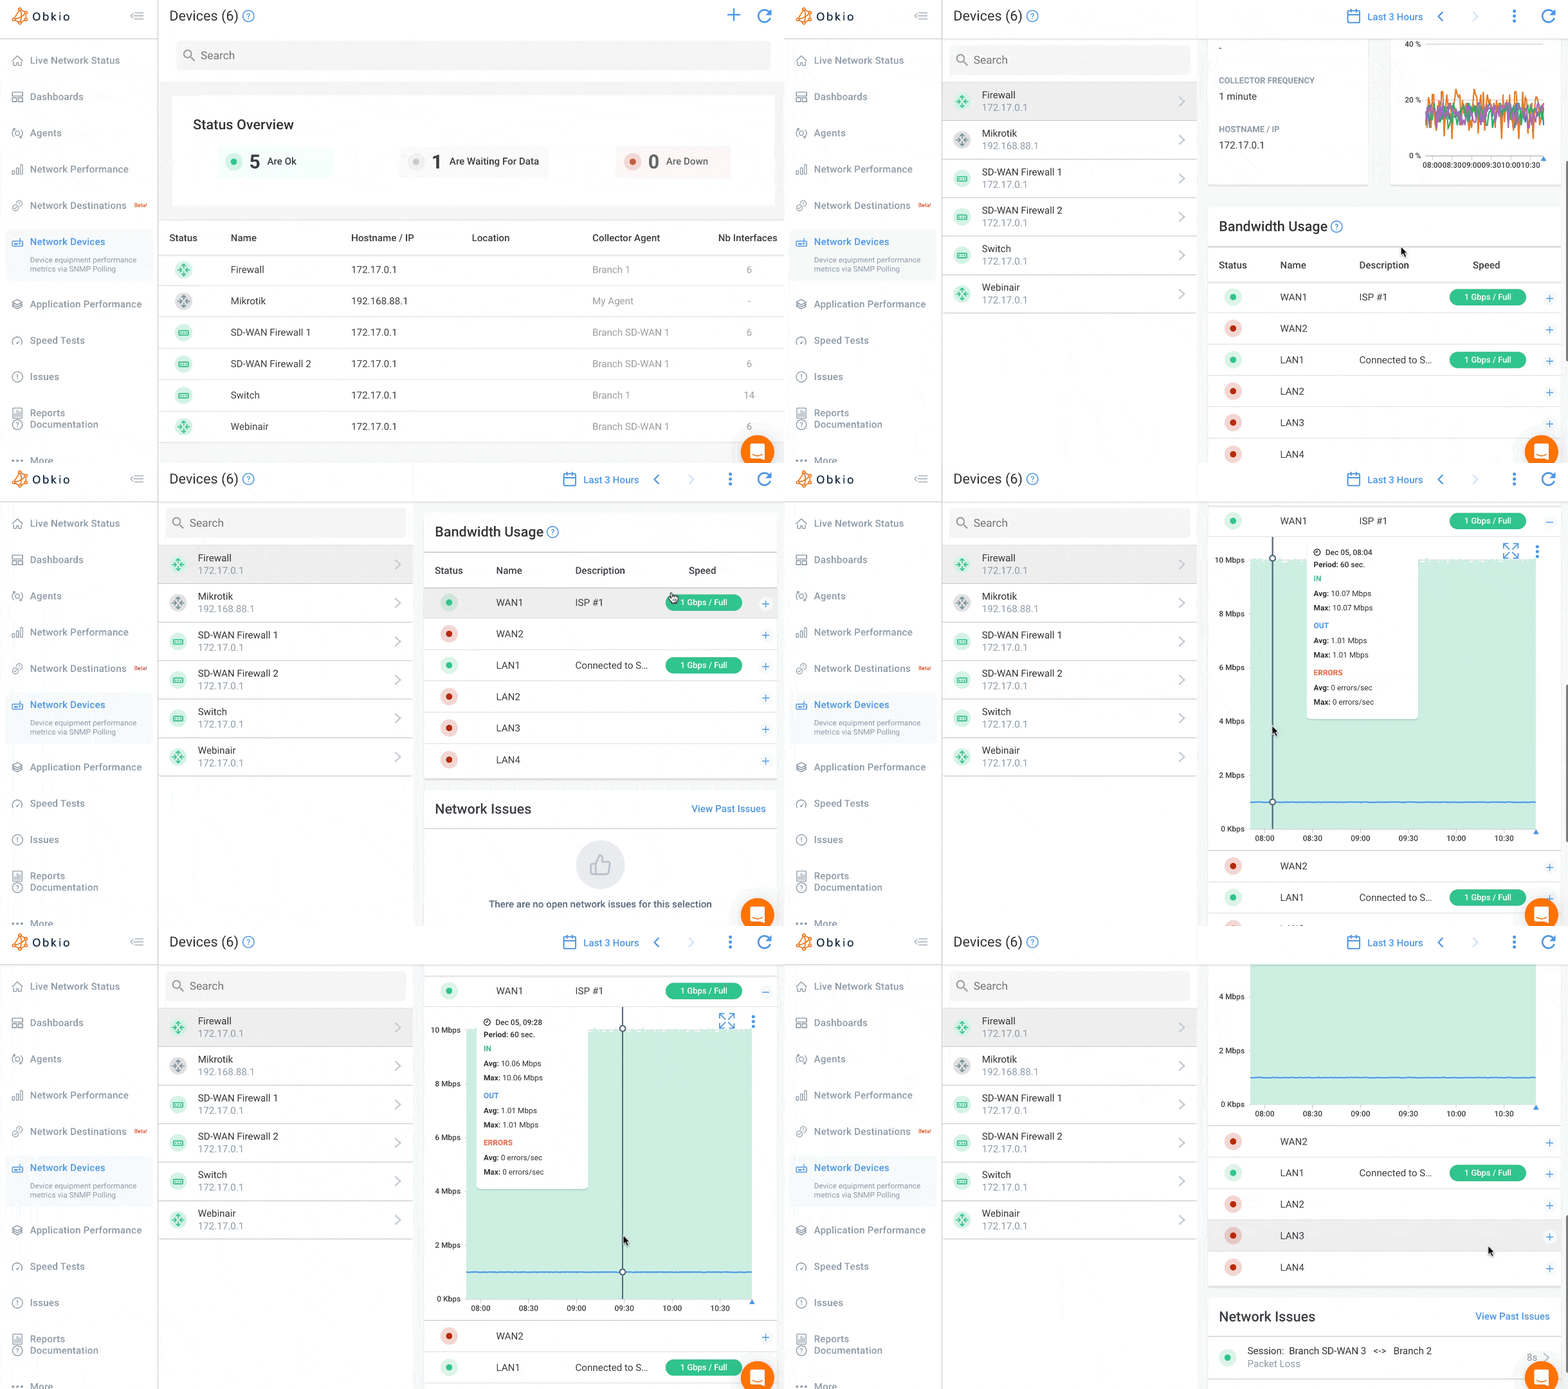
Luckily, you can do that within Obkio’s Network Monitoring application using the Network Device Monitoring feature! Network Device Monitoring uses SNMP Polling to monitor the performance of networking devices such as firewalls, routers, switches and wifi access points. It uses ultra-fast polling (every 30 seconds) to monitor network device metrics and quickly detect and diagnose network issues related to network devices.
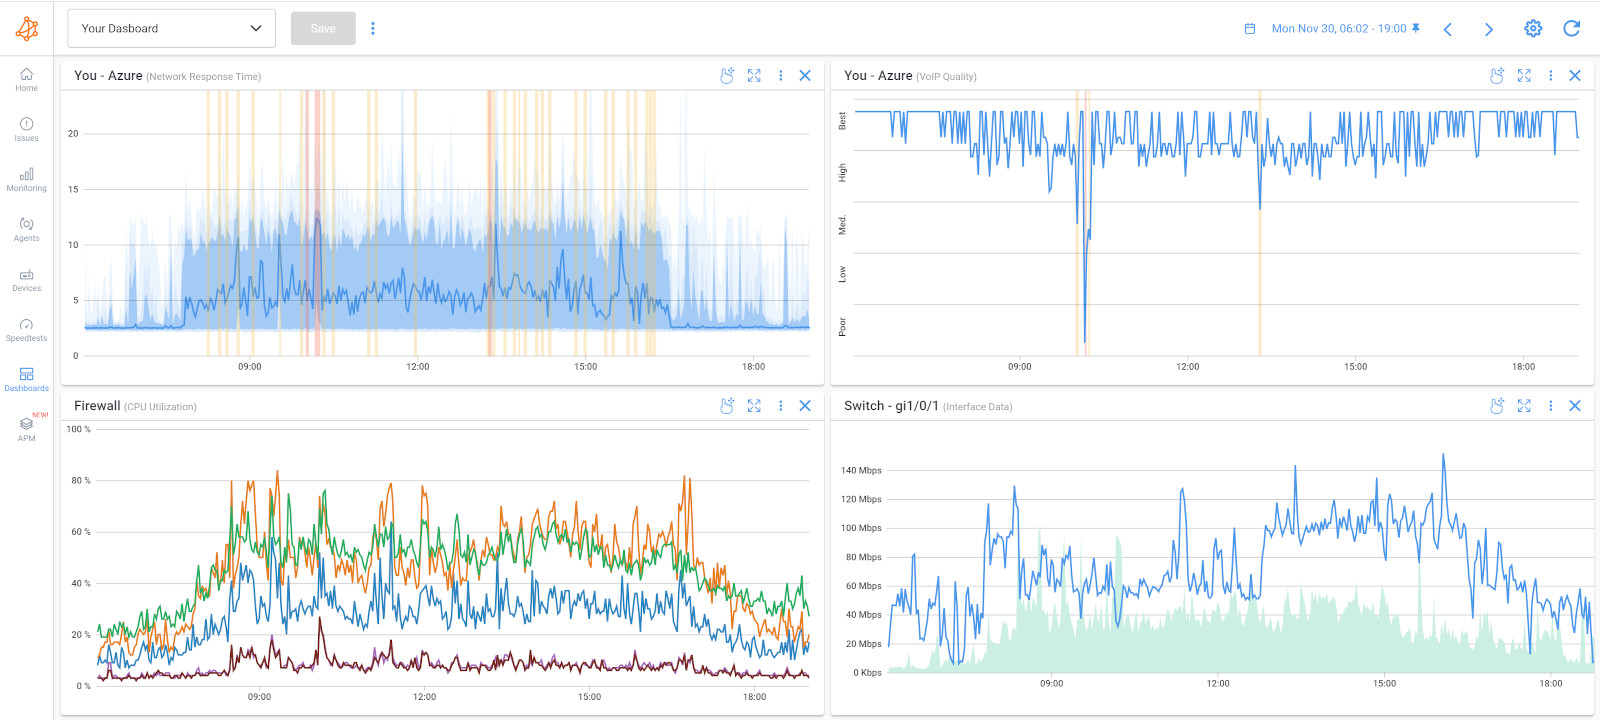
Analyzing Historical Performance Data always plays a crucial role in testing network performance as it provides valuable insights into the past behaviour and trends of the network. Obkio simplifies this process by measuring and gathering historical network performance data on your behalf.
This data enables you to analyze, compare, and troubleshoot past performance, empowering you to make informed decisions and ensure optimal network functionality.
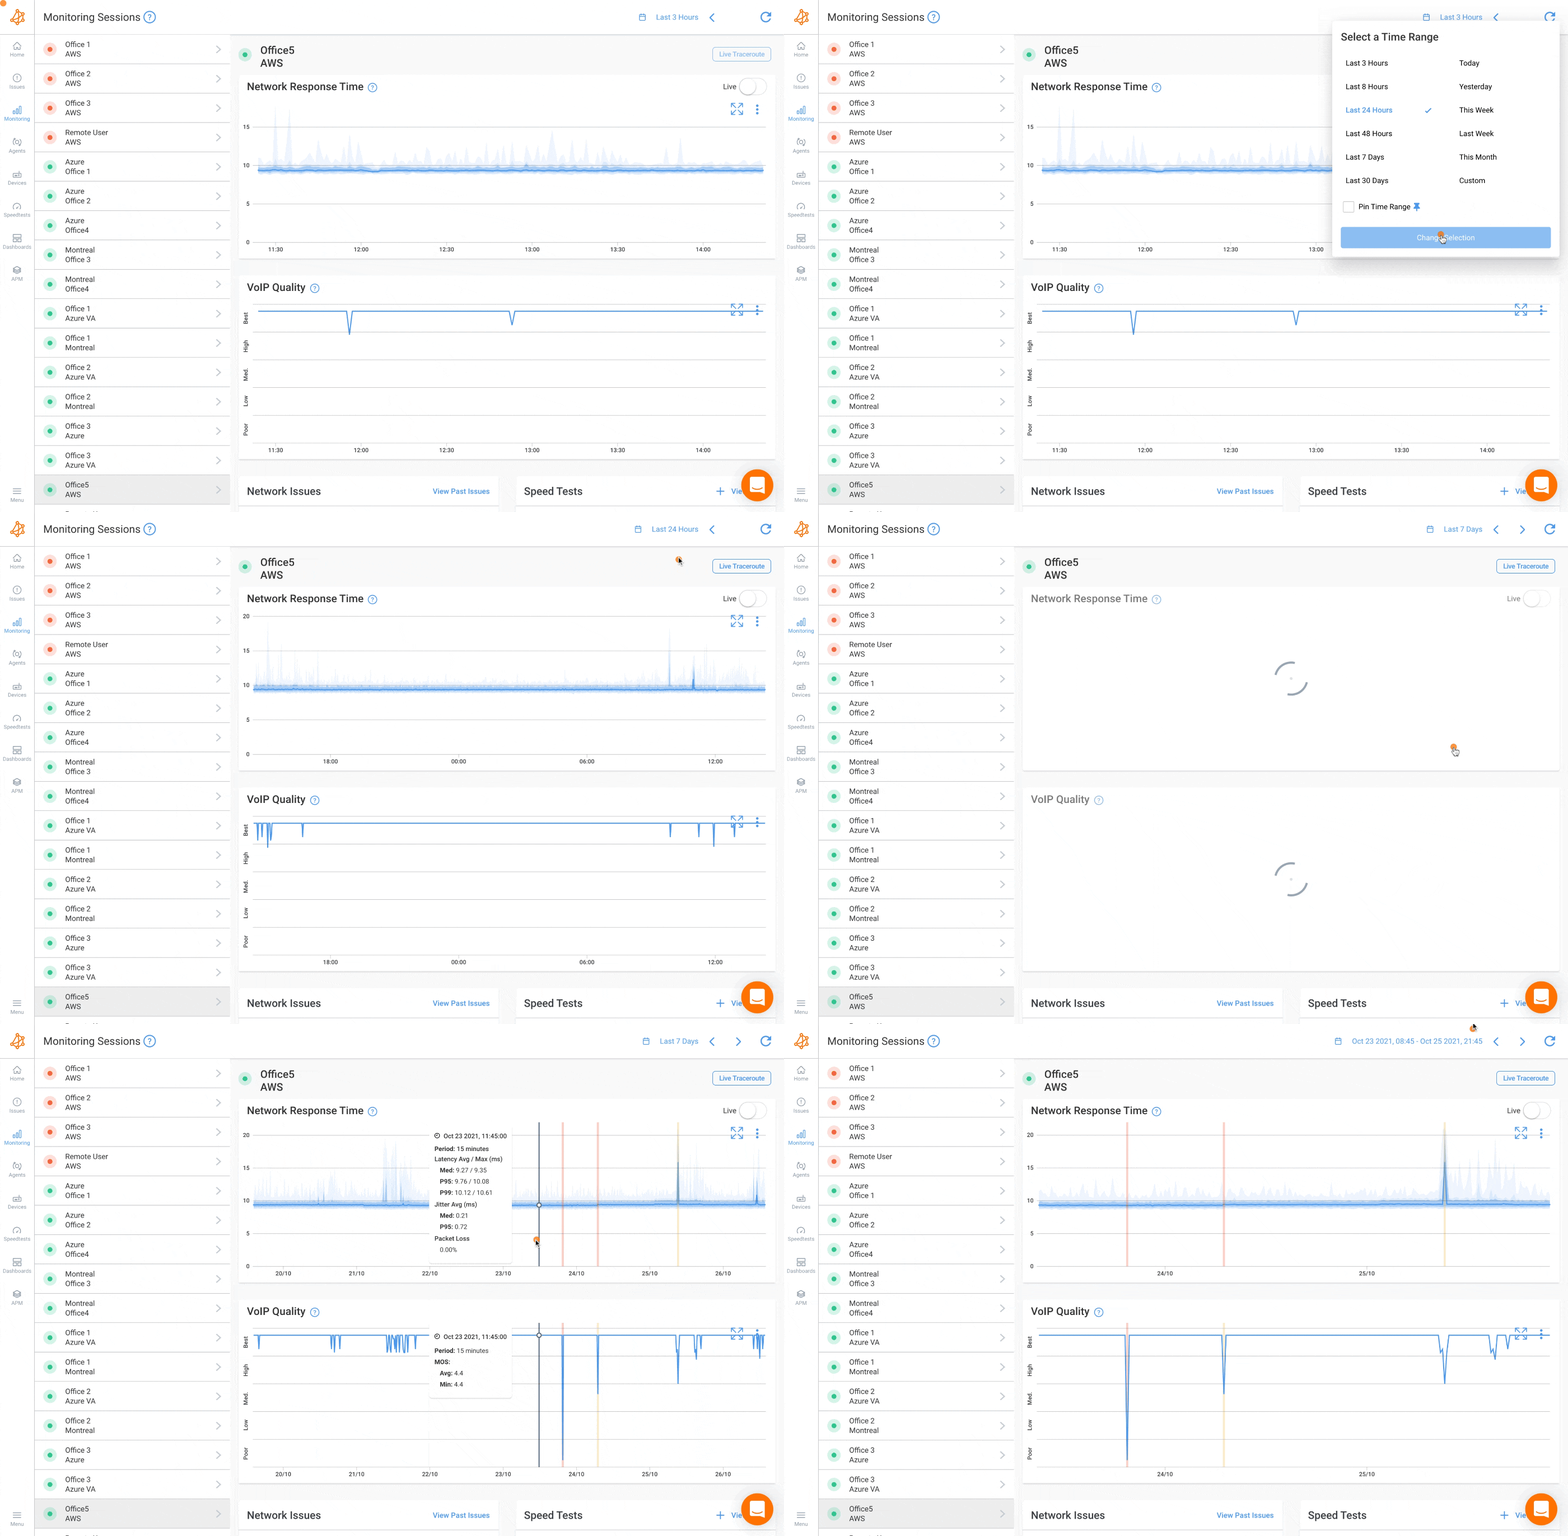
- Baseline Comparison: Historical data serves as a network baseline for comparison. By comparing current network performance metrics with past data, businesses and network administrators can identify deviations or anomalies that may indicate potential issues. It helps establish performance expectations and detect any significant changes or degradation in network performance over time.
- Trend Analysis: Analyzing historical data allows for trend analysis, which helps identify patterns and recurring issues. By examining performance trends, such as variations in latency, throughput, or packet loss, administrators can spot long-term patterns that might not be immediately apparent in real-time monitoring. This analysis enables proactive problem identification and resolution.
- Capacity Planning: Historical data aids in network capacity planning by providing insights into resource utilization and growth patterns. By analyzing historical trends, administrators can anticipate network traffic patterns and plan for future capacity requirements. It helps in determining when to upgrade network infrastructure, add additional bandwidth, or optimize network configurations to meet increasing demands.
- Performance Optimization: Historical data can reveal performance bottlenecks and areas for optimization. By identifying patterns of poor performance or recurring issues in historical records, administrators can pinpoint specific network segments or devices that require attention. This information enables targeted troubleshooting and optimization efforts, resulting in improved network performance.
- Compliance and Auditing: Historical data is essential for compliance purposes and network auditing. It provides a record of network performance and can be used to demonstrate adherence to service level agreements (SLAs) or regulatory requirements. Having historical data readily available simplifies the auditing process and ensures transparency in network performance reporting.
Network performance metrics exist on a spectrum from excellent to critical. Understanding specific thresholds helps you distinguish normal operations from issues requiring immediate attention. These benchmarks provide actionable targets when testing network performance and evaluating results.
Thresholds vary by application type, network segment, and business requirements. However, industry standards provide starting points for most environments.
Latency measures round-trip delay in milliseconds. Lower is always better, but acceptable ranges depend on connection type and application sensitivity.
- Excellent: <2ms
- Good: 2-5ms
- Acceptable: 5-10ms
- Poor: 10-20ms
- Critical: >20ms
Action threshold: Investigate immediately if LAN latency exceeds 10ms
- Excellent: <20ms
- Good: 20-50ms
- Acceptable: 50-80ms
- Poor: 80-100ms
- Critical: >100ms
Action threshold: Review routing and circuit quality above 80ms
- Excellent: <100ms
- Good: 100-150ms
- Acceptable: 150-200ms
- Poor: 200-300ms
- Critical: >300ms
Action threshold: Physical distance creates baseline latency; optimize where possible above 200ms
| Application Type | Maximum Acceptable | Optimal Target |
|---|---|---|
| VoIP/Voice Calls | <150ms | <100ms |
| Video Conferencing | <150ms | <100ms |
| Remote Desktop (RDP/VDI) | <100ms | <50ms |
| Database Queries | <50ms | <20ms |
| Web Browsing | <200ms | <100ms |
| File Transfers (FTP/SMB) | <300ms | <150ms |
| Email (SMTP/IMAP) | <500ms | <200ms |
Key insight: VoIP and video applications degrade noticeably above 150ms. Users perceive delays beyond 200ms as "slow."
Jitter measures variation in packet arrival times. Consistent timing matters more than absolute latency for real-time applications.
- Excellent: <5ms
- Good: 5-20ms
- Acceptable: 20-30ms
- Poor: 30-50ms
- Critical: >50ms
Action threshold: Investigate immediately above 30ms
| Application Type | Maximum Acceptable | Optimal Target |
|---|---|---|
| VoIP/Voice | <30ms | <20ms |
| Video Conferencing | <30ms | <20ms |
| Unified Communications | <30ms | <15ms |
| Online Gaming | <20ms | <10ms |
| Standard Data Transfer | <50ms | <30ms |
Key insight: Jitter above 30ms causes choppy audio, frozen video frames, and packet reordering. Voice quality becomes unacceptable above 50ms.
Packet loss represents the percentage of packets that fail to reach their destination. Even small percentages significantly impact performance.
- Excellent: <0.1%
- Good: 0.1-0.5%
- Acceptable: 0.5-1%
- Poor: 1-2%
- Critical: >2%
Action threshold: Investigate immediately above 0.5%
| Application Type | Maximum Acceptable | Zero-Tolerance Threshold |
|---|---|---|
| VoIP/Voice | <1% | >2% (calls fail) |
| Video Conferencing | <0.5% | >1% (severe degradation) |
| Database Transactions | <0.1% | >0.5% (errors/retries) |
| File Transfers (TCP) | <2% | >5% (slow retransmissions) |
| Video Streaming | <1% | >3% (buffering) |
| Web Browsing | <2% | >5% (page load failures) |
Key insight: TCP applications tolerate higher packet loss through retransmission, but performance degrades significantly. UDP applications (VoIP, video) cannot recover lost packets—they're simply gone.
Critical warning: Any sustained packet loss above 1% indicates network problems requiring immediate investigation.
Throughput measures actual data transfer rate. Bandwidth utilization shows percentage of available capacity consumed.
Expected throughput as percentage of subscribed bandwidth:
- Excellent: 95-100% of circuit speed
- Good: 90-95%
- Acceptable: 85-90%
- Poor: 75-85%
- Critical: <75%
Examples:
- 1 Gbps circuit should achieve 950+ Mbps
- 100 Mbps circuit should achieve 90+ Mbps
- 10 Mbps circuit should achieve 9+ Mbps
Action threshold: Contact ISP if throughput falls below 90% of subscribed bandwidth
Percentage of available bandwidth currently in use:
- Excellent: <40% utilization
- Good: 40-60%
- Acceptable: 60-70%
- Warning: 70-80%
- Critical: 80-90%
- Emergency: >90%
Action thresholds:
- 70-80%: Begin capacity planning, schedule upgrade within 3-6 months
- 80-90%: Immediate capacity review, upgrade within 30-60 days
- >90%: Emergency upgrade required, severe congestion risk
Key insight: Sustained utilization above 70% indicates approaching capacity limits. Above 80% creates congestion, increased latency, and packet loss during traffic spikes.
| Network Segment | Warning Threshold | Critical Threshold |
|---|---|---|
| Internet/WAN Links | >70% sustained | >80% sustained |
| Core Network Links | >60% sustained | >75% sustained |
| LAN Uplinks | >70% sustained | >85% sustained |
| Wireless Networks | >60% sustained | >75% sustained |
MOS measures perceived voice quality on a 1-5 scale based on latency, jitter, and packet loss.
- Excellent: 4.3-5.0 (toll quality)
- Good: 4.0-4.3 (high quality)
- Acceptable: 3.6-4.0 (medium quality)
- Poor: 3.1-3.6 (low quality)
- Unacceptable: 1.0-3.1 (unusable)
Action threshold: Investigate when MOS drops below 4.0
What affects MOS:
- Latency >150ms: Reduces MOS to 3.5 or lower
- Jitter >30ms: Reduces MOS to 3.0 or lower
- Packet loss >1%: Reduces MOS to 2.5 or lower
Error rates indicate hardware issues, cable problems, or misconfigurations.
- Excellent: 0 errors
- Acceptable: <1 error per million packets (0.0001%)
- Warning: 1-10 errors per million packets
- Critical: >10 errors per million packets
Action threshold: Investigate immediately when error rates exceed 1 per million packets
Common error types:
- CRC errors: Cable issues, EMI interference
- Input errors: Oversubscription, damaged frames
- Output errors: Interface overload, duplex mismatch
- Collisions: Network congestion (rare on switched networks)
RTT measures complete round-trip for packets, similar to latency but often measured differently.
| Distance | Excellent | Good | Acceptable | Poor |
|---|---|---|---|---|
| Same City (<50 miles) | <5ms | 5-10ms | 10-20ms | >20ms |
| Regional (50-500 miles) | <20ms | 20-40ms | 40-60ms | >60ms |
| National (500-1500 miles) | <40ms | 40-70ms | 70-100ms | >100ms |
| International (1500+ miles) | <100ms | 100-180ms | 180-250ms | >250ms |
Physics limitation: Light travels through fiber at ~124 miles per millisecond. Cross-country (3,000 miles) requires minimum 24ms in ideal conditions. Real-world routing typically adds 2-3x this theoretical minimum.
Network device health directly impacts performance. Monitor CPU and memory utilization on routers, switches, and firewalls.
- Excellent: <30%
- Good: 30-50%
- Acceptable: 50-70%
- Warning: 70-85%
- Critical: >85%
Action threshold: Investigate sustained CPU above 70%
- Excellent: <60%
- Good: 60-75%
- Acceptable: 75-85%
- Warning: 85-90%
- Critical: >90%
Action threshold: Investigate sustained memory above 80%
Impact of high device utilization:
- CPU >80%: Dropped packets, increased latency, routing delays
- Memory >90%: Buffer exhaustion, connection failures, device instability
Network performance can vary significantly depending on the environment in which it is deployed. Testing network performance in different environments, such as Local Area Networks (LANs) and Wide Area Networks (WANs), is essential to evaluate the network's behaviour and optimize its performance accordingly.
Here are some key considerations when testing network performance in different environments:
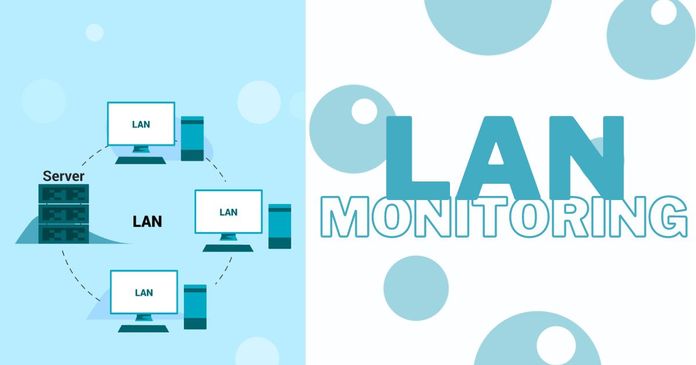
Local Area Networks (LANs) typically cover a limited geographic area, such as an office building or campus. When testing network performance in LAN environments (LAN monitoring), the focus is on evaluating factors like:
- Throughput and latency: Measure the LAN's capacity to handle data transfers and the delay experienced by data packets within the LAN. Tools like bandwidth testers and latency measurement tools can assess these parameters.
- Network congestion: Evaluate the LAN's ability to handle simultaneous traffic and identify any network congestion points. Traffic analysis tools can help identify areas with high network utilization and potential bottlenecks.
- Local application performance: Test the performance of locally hosted applications and services, ensuring quick response times and reliable data transmission within the LAN.
Master LAN Monitoring: Learn the essentials, best practices, and improve LAN network performance with Obkio's Network Performance Monitoring tool.
Learn more

Wide Area Networks (WANs) span larger geographical areas and connect multiple LANs or remote locations. WAN monitoring or testing network performance in WAN environments involves considering factors like:
- Latency and network distance: Measure the round-trip time between different locations connected by the WAN. Latency can significantly impact the performance of applications and services, especially for remote users. Tools like ping tests and traceroute can provide latency and network distance measurements.
- Bandwidth and throughput: Assess the WAN's capacity to handle data transfers across remote locations. Throughput testing tools can simulate data transfers and measure the actual bandwidth available.
- Packet loss and error rates: Evaluate the WAN's reliability by monitoring packet loss and error rates during data transmission. Tools like network analyzers and protocol analyzers can capture and analyze network traffic to identify potential issues.
- WAN optimization: Test the effectiveness of WAN optimization techniques, such as compression, caching, or traffic prioritization. These techniques can help improve performance and reduce bandwidth consumption.
Many organizations operate in hybrid networks that combine LANs, WANs, and cloud-based services. Testing network performance in hybrid environments requires considering factors like:
- Network integration and connectivity: Evaluate the performance of network connections between on-premises infrastructure, remote locations, and cloud-based services. Measure latency, bandwidth, and reliability across these different components.
- Interoperability and data transfer: Test the performance of data transfers between different environments, such as on-premises systems and cloud platforms. Assess factors like data transfer speed, integrity, and any potential bottlenecks.
- Security and access control: Ensure that network security measures, such as firewalls, VPNs, or access control mechanisms, do not significantly impact performance. Test the performance of secure connections and validate the effectiveness of security measures without compromising network performance.
When testing network performance in different environments, it's essential to consider the specific requirements, configurations, and usage patterns within each environment. Realistic testing scenarios should reflect the typical workloads and traffic patterns experienced in those environments.
By testing network performance in LANs, WANs, and hybrid environments, businesses can identify performance limitations, optimize network configurations, and ensure reliable connectivity and efficient data transmission across their network infrastructure.
Let us show how to test your network performance! Discuss our Network Pros about your use case now!
WiFi and wired (Ethernet) networks exhibit fundamentally different performance characteristics. Wired connections provide consistent, predictable performance, while WiFi performance varies based on distance, interference, device capabilities, and environmental factors. Testing each requires different approaches and expectations.
Before testing, understand typical performance ranges:
| Metric | Wired (Gigabit Ethernet) | WiFi 5 (802.11ac) | WiFi 6 (802.11ax) |
|---|---|---|---|
| Throughput | 940-980 Mbps | 200-600 Mbps | 400-900 Mbps |
| Latency | 1-3ms | 5-20ms | 3-15ms |
| Jitter | <1ms | 5-15ms | 3-10ms |
| Packet Loss | <0.01% | 0.1-1% | 0.05-0.5% |
| Consistency | Very stable | Highly variable | Variable |
- Key insight: WiFi will always exhibit higher latency, more jitter, and greater variability than wired connections. The goal isn't to match wired performance, but to achieve acceptable WiFi performance for your applications.
Wired network testing establishes your performance baseline. Issues discovered on wired connections indicate broader network problems, not wireless-specific issues.
Before testing, verify physical layer integrity:
Check cable quality:
- Use Cat5e minimum (supports 1 Gbps)
- Cat6/Cat6a preferred (supports 10 Gbps, better shielding)
- Replace damaged or kinked cables
- Keep cables under 100 meters (330 feet)
Verify link speed:
- Windows: Network adapter properties → Status → Speed
- macOS: Option+Click WiFi icon → Check "Tx Rate"
- Linux:
ethtool eth0command - Expected: 1000 Mbps (1 Gbps) for modern networks
Common issues:
- 100 Mbps link speed: Bad cable or damaged port
- 10 Mbps: Severe cable damage or port misconfiguration
- Frequent disconnections: Loose connection or failing port
Using Obkio:
- Deploy monitoring agent on wired workstation
- Run on-demand speed test to target location
- Repeat 3-5 times at different times of day
- Expected results: 900+ Mbps on 1 Gbps connection
Acceptable thresholds:
- 1 Gbps connection: 900-980 Mbps (90-98%)
- 100 Mbps connection: 90-95 Mbps (90-95%)
- Lower results indicate network congestion or device limitations

Using Obkio:
- Continuous monitoring displays real-time latency graphs
- LAN latency should remain stable at 1-3ms
- Spikes above 10ms indicate congestion or device issues
Expected results:
- Average: 1-3ms
- Variation: <1ms
- Packet loss: 0%
Red flags on wired connections:
- Latency >5ms to local gateway: Device or switch issue
- Jitter >2ms: Network congestion or failing hardware
- Any packet loss: Cable damage, port errors, or congestion
Packet loss on wired networks is unusual and always indicates problems.
Any errors require investigation:
- Input errors: Cable issues, duplex mismatch
- Output errors: Oversubscription, buffer exhaustion
- Collisions: Rare on switched networks (indicates misconfiguration)
WiFi testing requires location-specific measurements since performance varies dramatically by distance from access point, interference, and obstacles.
Before performance testing, verify signal strength at test locations.
Check signal strength:
- Windows:
netsh wlan show interfaces→ Look for "Signal" - macOS: Option+Click WiFi icon → Check RSSI
- Linux:
iwconfig wlan0→ Check "Signal level" - Mobile apps: WiFi Analyzer (Android), Airport Utility (iOS)
Signal strength thresholds (RSSI):
- -30 to -50 dBm: Excellent (maximum performance)
- -50 to -60 dBm: Good (near-maximum performance)
- -60 to -70 dBm: Fair (reduced speed, increased latency)
- -70 to -80 dBm: Poor (minimal connectivity)
- Below -80 dBm: Unusable
Action thresholds:
- Below -67 dBm: Performance degradation expected
- Below -70 dBm: VoIP/video quality severely impacted
- Below -75 dBm: Connection drops likely
WiFi operates on 2.4 GHz and 5 GHz bands with different characteristics.
2.4 GHz Band:
- Longer range (penetrates walls better)
- More interference (microwaves, Bluetooth, neighbors)
- Lower maximum speeds (200-300 Mbps typical)
- Only 3 non-overlapping channels (congestion common)
5 GHz Band:
- Shorter range (more affected by obstacles)
- Less interference (more channels available)
- Higher speeds (400-900 Mbps possible)
- 23+ non-overlapping channels
Best practice: Test on both bands to compare performance and identify optimal configuration.
WiFi performance varies by location. Test at multiple points to create a coverage map.
Testing methodology:
Location 1: Near Access Point (5-10 feet)
- Connect to WiFi (note frequency band)
- Run speed test using Obkio or iperf3
- Record throughput, latency, jitter
- Expected: 70-90% of theoretical maximum
Location 2: Medium Distance (20-30 feet, no obstacles)
- Repeat test from new location
- Expected: 50-70% of theoretical maximum
- Compare to Location 1 results
Location 3: Through Obstacles (walls, floors)
- Test from realistic work location
- Expected: 30-60% of theoretical maximum
- Significant drop indicates coverage gap
Location 4: Edge of Coverage
- Test at furthest intended location
- Minimum acceptable: 25 Mbps down, 10 Mbps up for basic productivity
- Below minimums requires additional access point

Interference degrades WiFi performance without obvious indicators.
Channel overlap check:
- Use WiFi Analyzer (Android) or WiFi Explorer (Mac)
- Identify how many networks use same/adjacent channels
- Switch to less congested channels when possible
2.4 GHz recommendations:
- Use channels 1, 6, or 11 only (non-overlapping)
- Avoid auto channel selection (often picks poor channels)
- Switch to 5 GHz if available
5 GHz recommendations:
- Many channels available, congestion less common
- Use DFS channels if access point supports them
- Wider channels (80 MHz, 160 MHz) provide higher speeds but more congestion
Common interference sources:
- Microwaves (2.4 GHz): Causes temporary dropout
- Bluetooth devices: Mild impact on 2.4 GHz
- Neighboring WiFi networks: Competes for airtime
- Cordless phones (DECT): 2.4 GHz interference
WiFi latency varies more than wired connections. Test continuously to identify patterns.
Using Obkio continuous monitoring:
- Deploy agent on WiFi device
- Monitor for 24-48 hours to capture variation
- Compare peak vs. average latency
Analyze results:
- Average latency: 5-15ms typical # Maximum latency: Should stay below 50ms # Standard deviation: <10ms acceptable
WiFi latency patterns:
- Steady 10-15ms: Good performance
- Occasional spikes to 50-100ms: Normal (retransmissions)
- Frequent spikes >100ms: Interference or congestion
- Consistent >30ms: Weak signal or overloaded AP
For networks with multiple access points, test roaming behavior.
Roaming test procedure:
- Start continuous ping or monitoring session
- Walk from AP1 coverage area to AP2 coverage area
- Monitor for disconnections or latency spikes
- Note when device switches access points
Expected behavior:
- Seamless roaming: No disconnection, brief (<2 second) latency spike
- Sticky client: Device stays on AP1 too long, performance degrades
- Frequent roaming: Switches APs too often, indicates overlapping coverage
Roaming issues indicate:
- Incorrect AP power levels (too high or too low)
- Missing 802.11r/k/v fast roaming configuration
- Client device limitations
To definitively identify wireless vs. network issues, test the same location on both wired and WiFi.
Step 1: Baseline Wired Test
- Connect device to wired network
- Run throughput, latency, and packet loss tests
- Record all metrics as wired baseline
Step 2: Switch to WiFi
- Disconnect Ethernet cable
- Connect to WiFi (same location)
- Run identical tests
Step 3: Compare Results
| Metric | Wired | WiFi | Difference | Issue? |
|---|---|---|---|---|
| Throughput | 950 Mbps | 420 Mbps | -56% | Normal for WiFi 5 |
| Latency | 2ms | 12ms | +10ms | Normal |
| Jitter | 0.5ms | 8ms | +7.5ms | Normal |
| Packet loss | 0% | 0.3% | +0.3% | Normal |
Interpretation:
- Wired issues + WiFi issues = Network problem (not wireless-specific)
- Wired perfect + WiFi degraded = Wireless optimization needed
- Both poor at same location = Infrastructure problem (switch, cabling)
Systematic testing on both wired and wireless networks identifies whether issues stem from WiFi infrastructure, broader network problems, or unrealistic expectations. This data-driven approach prevents expensive, unnecessary WiFi upgrades when the real issue lies elsewhere.
Deploy monitoring agents at key network locations (offices, data centers, cloud environments) that exchange synthetic traffic to measure latency, jitter, packet loss, and throughput continuously. Use tools like Obkio for automated testing, or run on-demand tests with iperf3 and ping for specific troubleshooting. Test both wired and wireless connections, compare results against baseline metrics, and identify degradation patterns over time.
Quick start steps:
- Install monitoring agents at source and destination
- Configure continuous synthetic monitoring
- Measure latency (<50ms for WAN), packet loss (<0.5%), and jitter (<20ms)
- Set alerts when thresholds are exceeded
- Review historical data to identify trends
The five critical metrics are latency (delay in milliseconds), jitter (timing variation), packet loss (percentage of dropped packets), throughput (actual data transfer rate), and bandwidth utilization (percentage of capacity used). Latency measures responsiveness, packet loss indicates reliability, jitter affects real-time applications like VoIP, throughput validates circuit speeds, and utilization shows capacity planning needs.
Priority order:
- Packet loss - Even 0.5% impacts performance
- Latency - Affects all applications
- Jitter - Critical for voice/video
- Throughput - Validates bandwidth delivery
- Utilization - Prevents capacity exhaustion
Implement continuous monitoring that tests performance every 500ms to 1 minute for proactive issue detection. Run comprehensive throughput tests weekly to validate circuit speeds. Perform stress testing before major deployments or infrastructure changes. Conduct ad-hoc diagnostic tests immediately when users report issues. Review bandwidth utilization trends monthly for capacity planning.
Testing frequency by type:
- Continuous synthetic monitoring: 24/7/365
- Throughput validation: Weekly
- Stress testing: Before major changes
- WiFi coverage testing: Quarterly or after layout changes
- Capacity review: Monthly
Good results depend on network type and application requirements. For LANs, latency should be under 5ms with zero packet loss. For regional WANs, latency under 50ms and packet loss under 0.5% is acceptable. VoIP requires latency under 150ms, jitter under 30ms, and packet loss under 1%. Throughput should achieve 90%+ of subscribed bandwidth. Bandwidth utilization sustained above 70% indicates capacity planning is needed.
Acceptable thresholds summary:
- LAN latency: <5ms
- WAN latency: <50ms (regional), <150ms (international)
- Packet loss: <0.5% (data), <1% (VoIP)
- Jitter: <20ms (VoIP), <30ms (video)
- Throughput: >90% of circuit speed
- Bandwidth utilization: <70% sustained
Learn how to measure network performance with key network metrics like throughput, latency, packet loss, jitter, packet reordering and more!
Learn more

Active testing injects synthetic traffic into the network to measure performance proactively, detecting issues before users are affected. It provides consistent baselines and continuous monitoring. Passive testing observes existing traffic without injection, capturing real user experience and enabling deep protocol analysis. Active testing uses tools like Obkio or ping, while passive testing uses packet capture tools like Wireshark or flow analysis with NetFlow.
Use active testing for:
- Continuous performance monitoring
- Proactive issue detection
- SLA validation
- Circuit testing
Use passive testing for:
- Deep troubleshooting
- Security investigation
- Application behavior analysis
- Protocol debugging
Test during both periods to capture different network conditions. Business hours reveal performance under actual load with concurrent users, showing real-world capacity constraints. After-hours testing establishes baseline performance without congestion, helping differentiate capacity issues from infrastructure problems. Compare results to identify whether issues stem from overload or underlying network problems.
Testing schedule:
- Business hours: Real-world performance under load
- After hours: Baseline without congestion
- Peak periods: Identify maximum capacity stress
- Overnight: Detect issues unrelated to load (failing hardware, routing problems)
For throughput testing, run tests for 60 seconds minimum to achieve stable results. For comprehensive performance assessment, monitor continuously for 24-48 hours to capture daily patterns and peak usage periods. Stress tests should gradually increase load over 30-60 minutes to identify exact breaking points. For baseline establishment, collect data for 2-4 weeks to account for weekly usage variations.
Test duration by type:
- Throughput test: 60 seconds minimum
- Latency/jitter baseline: 24-48 hours
- Stress test: 30-60 minutes ramping load
- Baseline establishment: 2-4 weeks
- Continuous monitoring: Ongoing (24/7)
Test from all locations where users work or applications run. Deploy agents at headquarters, branch offices, remote worker locations, data centers, and cloud environments. Test between all critical location pairs, not just hub-and-spoke. Include mobile/WiFi locations if supporting remote workforce. Prioritize testing paths that carry business-critical applications like VoIP, video conferencing, or ERP systems.
Essential test locations:
- Each physical office location
- Remote worker home offices
- Data centers and server rooms
- Cloud environments (AWS, Azure, GCP)
- Between all critical location pairs
- WiFi coverage areas within offices
Deploy lightweight monitoring agents on remote worker devices to test from home office to corporate resources. Test VPN performance separately from general internet performance. Monitor WiFi quality at remote locations using built-in tools. Test to both corporate data centers and cloud applications. Identify whether issues are home network, ISP, VPN, or corporate network related.
Remote worker testing priorities:
- Home internet speed (download/upload)
- WiFi quality within home office
- VPN connection performance
- Path to corporate resources
- Cloud application accessibility

The best tool depends on your needs. For continuous monitoring and proactive detection, use Obkio for synthetic monitoring across all locations. For deep troubleshooting, use Wireshark for packet capture. For throughput validation, use iperf3. For basic connectivity checks, built-in ping and traceroute suffice. Most organizations benefit from continuous monitoring tools supplemented by diagnostic tools for specific issues.
Software-based monitoring agents are most common and deploy in minutes without dedicated hardware. Install agents as applications on existing workstations, servers, or virtual machines. Hardware appliances are optional for locations without existing infrastructure or where software installation is restricted. Cloud-based public monitoring agents eliminate deployment at some locations entirely for internet performance testing.
Software monitoring agents deploy in 5-10 minutes per location. Cloud-based platforms like Obkio require no infrastructure setup—create account, deploy agents, start monitoring. Full deployment across 10 locations typically completes in 1-2 hours including agent installation and configuration. Enterprise deployments with 50+ locations may require several days for systematic rollout but each individual location installs quickly.
Network performance testing with tools like Obkio requires minimal technical knowledge—if you can install software, you can deploy monitoring agents. The platform handles complex configuration automatically. Interpreting results uses color-coded dashboards showing red (bad) and green (good) performance. Deep troubleshooting and optimization benefit from IT expertise, but identifying that problems exist requires only basic understanding of performance thresholds.
In conclusion, testing network performance and optimizing your network infrastructure are key to maintaining a high-performing and reliable network. Testing network performance is crucial for businesses and network administrators to ensure optimal network functionality, reliability, and user satisfaction. By implementing regular testing practices, organizations can:
- Proactively identify and address performance issues before they impact users or critical business operations.
- Optimize network infrastructure to meet the evolving demands of your organization and accommodate future growth.
- Enhance the user experience by ensuring reliable and efficient network connectivity.
- Improve network security by identifying vulnerabilities and implementing necessary enhancements.
- Optimize the performance of critical applications and services to maximize productivity and operational efficiency.
- Make informed decisions based on accurate and reliable network performance data.
Don't let performance issues slow you down! Take charge of your network and ensure optimal performance with Obkio's comprehensive Network Monitoring tool.
Ready to unleash the full potential of your network? Start for free with Obkio today and experience seamless network performance like never before.
- 14-day free trial of all premium features
- Deploy in just 10 minutes
- Monitor performance in all key network locations
- Measure real-time network metrics
- Identify and troubleshoot live network problems

Remember, a well-tested network is a happy network. Let Obkio be your partner in network performance excellence. Happy testing!


 Obkio Blog


