


Table of Contents
Table of Contents
Poor voice call quality isn't just annoying, it's a productivity killer. Dropped calls mid-negotiation, garbled audio on client meetings, and one-sided conversations where half the words don't make it through: these aren't random technical glitches. They're symptoms of network performance problems that haven't been identified, measured, or fixed.
And when your business runs on VoIP, Microsoft Teams, or any cloud-based communication platform, unmeasured voice quality is a liability.
The problem is that "the call sounded bad" isn't actionable. To fix voice quality issues, you need a number, a standardized, quantifiable measure of what your users are actually experiencing. That's exactly what MOS score (Mean Opinion Score) gives you.
Originally developed by the ITU-T as a human-rated audio quality benchmark, MOS score has become the industry-standard metric for measuring voice call quality, giving IT teams a single score that reflects the cumulative impact of packet loss, latency, and jitter on every call.
But knowing what MOS score is and knowing how to actually measure it are two different things. This guide covers the full process: how MOS score is calculated, which network metrics drive it up or down, how to set up continuous MOS monitoring across your network, what scores to target, and what to do when your numbers fall short.
What Is MOS Score? (Mean Opinion Score in VoIP) 
MOS score (short for Mean Opinion Score) is a numerical measure of perceived voice call quality on a scale of 1 to 5, where 1 represents completely unusable audio, and 5 represents perfect, toll-quality voice. It's the telecommunications industry's standard benchmark for quantifying how good or bad a voice call actually sounds to the person on the other end.

MOS score was originally standardized by the ITU-T (International Telecommunication Union) as a subjective measurement: human listeners would evaluate recorded audio samples and rate them individually, and those ratings would be averaged into a single score. That method (defined in ITU-T P.800) is still used today for codec evaluation and lab testing, but it's impractical for real-time network monitoring. You can't assemble a panel of human listeners every time a call degrades.
That's why modern MOS measurement uses algorithmic calculation instead. Tools like Obkio estimate MOS score in real time using the ITU-T E-Model (G.107), which takes measurable network metrics (packet loss, latency, and jitter) and converts them into an R-factor score that maps directly to a MOS value.
The result is a continuous, automated quality score that reflects actual network conditions across every monitored path, without requiring a single live call to be in progress.
The core premise hasn't changed: MOS score tells you how a call sounds. What's changed is how precisely and continuously you can measure it.
What Is the Difference Between MOS Score and VoIP Quality?
MOS score and VoIP quality are related but not the same thing. VoIP quality is a broad term that covers the overall experience of a voice call: audio clarity, call stability, echo, delay, and whether the conversation feels natural.
MOS score is the specific metric used to quantify that experience as a single number.
Think of it this way: VoIP quality is what your users are experiencing. MOS score is how you measure it.
 Screenshot from Obkio's Network Monitoring Tool
VoIP quality is influenced by a wide range of factors: network performance, device hardware, codec selection, echo cancellation, and the quality of the VoIP platform itself.
MOS score captures the cumulative impact of the network-side factors: packet loss, latency, and jitter, and translates them into a standardized score that reflects perceived audio quality.
It doesn't capture every dimension of the VoIP experience (echo, for example, isn't factored into E-Model MOS calculations), but it covers the metrics that cause the vast majority of voice quality complaints.
In practice, MOS score is the most actionable measure of VoIP quality available to network teams because unlike subjective user feedback, it's continuous, quantifiable, and directly tied to the network conditions you can actually monitor and fix.
What is a Good vs. Bad MOS Score for VoIP?
MOS score is measured on a scale of 1 to 5, where each range corresponds to a distinct listener experience, from completely unusable audio to toll-quality voice indistinguishable from a landline call.

For enterprise voice, 4.0 is the minimum acceptable threshold. At this level, most users can communicate without frustration, even if the quality isn't perfect. Once scores drop below 3.6, call quality starts directly impacting productivity; users are spending cognitive effort compensating for poor audio rather than focusing on the conversation. Below 3.1, calls become functionally unusable for business communication.
It's worth noting that 5.0 is a theoretical ceiling. Even under ideal network conditions, codec limitations mean most VoIP systems top out around 4.4–4.5. So in practice, the target range for a well-functioning voice network is 4.0–4.4, not 5.0.
How Is MOS Score Calculated? (VoIP MOS score calculation)
MOS score isn't calculated the same way in every context. There are three distinct methods, each suited to a different purpose, and understanding the difference matters if you want to know what your monitoring tool is actually measuring.
1. Subjective MOS (Traditional Method)
The original MOS measurement method, defined in ITU-T P.800, is entirely human-driven. A group of listeners evaluate recorded audio samples and rate each one on a scale of 1 to 5. Those individual ratings are then averaged to produce the final MOS score.
This method is the gold standard for codec evaluation. It's how audio engineers benchmark whether a new codec produces acceptable voice quality under controlled conditions.
But it has an obvious limitation: you can't convene a panel of human listeners every time network conditions shift. Subjective MOS is a lab tool, not a monitoring tool.
2. Objective MOS (PESQ & POLQA)
To automate what human listeners do manually, the ITU-T standardized two algorithmic methods that closely correlate with subjective human ratings:
- PESQ (Perceptual Evaluation of Speech Quality): Defined in ITU-T P.862, designed for narrowband and wideband voice. Compares a degraded audio signal against a clean reference signal and produces a score that maps to the MOS scale.
- POLQA (Perceptual Objective Listening Quality Analysis): Defined in ITU-T P.863, the successor to PESQ. Supports HD voice and modern codecs, and is better suited to mobile and VoIP environments.
Both methods require a reference audio signal to compare against, which makes them well-suited for lab testing, codec certification, and regulatory compliance, but still impractical for continuous real-time monitoring across a live network.
3. Estimated MOS (E-Model / R-Factor)
For real-time network monitoring, estimated MOS via the ITU-T G.107 E-Model is the standard approach and the most operationally relevant. Rather than analyzing audio signals, the E-Model calculates a transmission quality rating called the R-factor from measurable network metrics: one-way delay, jitter, and packet loss. That R-factor is then converted to an estimated MOS value.
The R-factor runs on a scale of 0 to 100, where higher is better. The conversion to MOS follows this relationship:

This is the method Obkio uses to calculate MOS in real time. By continuously measuring packet loss, latency, and jitter between monitoring agents, Obkio derives an R-factor for each monitored path and converts it to a live MOS score. No audio capture required, no reference signal needed, no active calls required to be in progress.
The result is a continuous quality score that reflects actual network conditions across every location you monitor.

Measure MOS Score with Obkio now!
What Is the Difference Between MOS Score and R-Factor?
MOS score and R-factor both measure voice call quality, but they operate on different scales and serve slightly different purposes, and understanding the relationship between them helps clarify how modern MOS monitoring actually works.
R-factor is the intermediate calculation produced by the ITU-T G.107 E-Model. It runs on a scale of 0 to 100 and is derived directly from raw network measurements: one-way delay, jitter, and packet loss. A higher R-factor means better quality. An R-factor of 93 represents excellent quality; below 50 represents a call that's effectively unusable.
MOS score is derived from the R-factor using a standardized conversion formula, and runs on the more familiar 1–5 scale. It exists because MOS predates the E-Model. The scale was established for subjective human ratings long before algorithmic calculation was possible, and it remains the universal benchmark that engineers, vendors, and SLA documents refer to.
In short: R-factor is what the E-Model calculates from your network metrics. MOS is what the R-factor converts to for reporting and comparison.
Most network monitoring tools, including Obkio, display MOS scores in their dashboards rather than raw R-factor values, since MOS is the scale that maps most directly to what users experience and what SLAs are written against.
What Network Metrics Affect MOS Score?
MOS score doesn't exist in isolation; it's a reflection of what's happening on your network. Four network metrics determine where your MOS lands: packet loss, latency, jitter, and codec selection. The first three are network performance problems you can monitor and fix. The fourth sets the ceiling before any of those problems even enter the picture.

1. Packet Loss for MOS Score
Packet loss is the most damaging metric for voice quality. Unlike video or file transfers, VoIP doesn't retransmit lost packets; there's no time. When packets are dropped, the audio simply disappears, producing the clipped words and sudden silences that make calls feel broken.
Even small amounts of loss have an outsized effect on MOS:
- Below 0.5% — Negligible impact, good voice quality maintained
- 0.5–1.5% — Acceptable, minor audio artifacts under sustained load
- Above 1.5% — Noticeable degradation, MOS drops below acceptable thresholds
- Above 5% — Calls become effectively unusable for business communication
2. Latency (One-Way Delay) for MOS Score
Latency is the time it takes for a voice packet to travel from sender to receiver. ITU-T G.114 sets the recommended ceiling at 150ms one-way. Above that, users start to notice the delay as an unnatural pause in the conversation.
Above 200ms, speakers begin talking over each other. Above 400ms, the conversation becomes difficult to conduct entirely, and most users will experience it as a fundamentally broken call.
It's worth noting that jitter buffers, echo cancellation, and other processing add to one-way delay, so the network latency you measure isn't the only source of delay users experience.
3. Jitter for MOS Score
Jitter is the variation in packet arrival times. Even if average latency is acceptable, inconsistent delivery causes the audio stream to stutter, packets arrive out of order or in bursts, producing choppy, robotic-sounding audio.
Jitter above 30ms typically causes audible degradation. Most VoIP systems use a jitter buffer to smooth out this variation by holding packets briefly and reordering them before playback, but that compensation comes at a cost.
A larger jitter buffer means higher overall latency. It's a direct tradeoff: reduce choppiness or reduce delay, but not both simultaneously.
4. Codec Selection for MOS Score
Before network conditions affect MOS at all, your codec choice sets the maximum score your calls can ever achieve. Different codecs encode voice differently, and each has a different quality ceiling:
- G.711: Uncompressed, wideband audio. MOS ceiling of ~4.4 under ideal conditions. High bandwidth requirement (~64 Kbps per call).
- G.729: Compressed codec optimized for low bandwidth. MOS ceiling of ~3.92 under ideal conditions. Uses ~8 Kbps per call but sacrifices some audio fidelity.
- Opus: Modern wideband codec used in WebRTC and many UCaaS platforms. Adaptive bitrate, MOS ceiling comparable to G.711 at higher bitrates.
If your network is running G.729 and your MOS scores are sitting at 3.8, that may not indicate a network problem at all. It may simply be the codec operating near its ceiling. Understanding your codec baseline is essential context before diagnosing MOS scores as network issues.

How to Measure MOS Score for VoIP: Step-by-Step
Measuring MOS score in a live network environment requires more than a one-time test. The steps below cover how to set up continuous, automated MOS monitoring across your entire voice infrastructure.
Step 1: Find and Deploy a MOS Monitoring Tool
Point-in-time MOS tests only tell you what quality looked like at one moment. To catch the intermittent degradation that actually affects users, like the jitter spike during a Monday morning standup, the packet loss event that hits every afternoon, you need a dedicated MOS monitoring tool that measures continuously across every location that handles voice traffic.
Look for a tool that calculates MOS from real network metrics using the E-Model rather than relying on post-call reporting, and that deploys monitoring agents at the network level rather than on individual endpoints. This gives you path-level visibility across your entire voice infrastructure, not just device-level data from the machines that happen to be running the software.
Obkio's MOS monitoring tool is built specifically for this. It uses distributed monitoring agents to continuously measure the network metrics that drive MOS score (packet loss, latency, and jitter) across every monitored path, calculating and displaying live MOS scores without requiring any active calls to be in progress.

Once you've selected your tool, deploy monitoring agents at each network location: head offices, branch offices, remote worker endpoints, and any cloud or data center locations your VoIP traffic passes through.
Each agent pair creates a monitored path, giving you end-to-end visibility across the full voice network.


Step 2: Configure Synthetic VoIP Sessions to Collect MOS Score Measurements
Once agents are deployed, Obkio generates synthetic VoIP-like traffic between agent pairs, continuously simulating the packet flow of a real voice call.
This measures packet loss, latency, and jitter in real time without requiring any active calls to be in progress.
This is the key advantage of synthetic monitoring: you get baseline MOS data 24 hours a day, 7 days a week. Problems are captured whether they occur during business hours or at 3am, during a call or between calls.
Step 3: Collect the Underlying Network Metrics that Measure MOS Score
MOS calculation via the E-Model requires three real measurements from your network:
- One-way delay
- Jitter
- Packet Loss
Obkio agents collect all three continuously across every monitored path, at regular intervals, storing the data historically so you can identify patterns and trends over time, not just current conditions.

Step 4: Calculate or Read the MOS Score
With those network metrics collected, Obkio derives an R-factor for each monitored path using the E-Model and converts it automatically to an estimated MOS score.
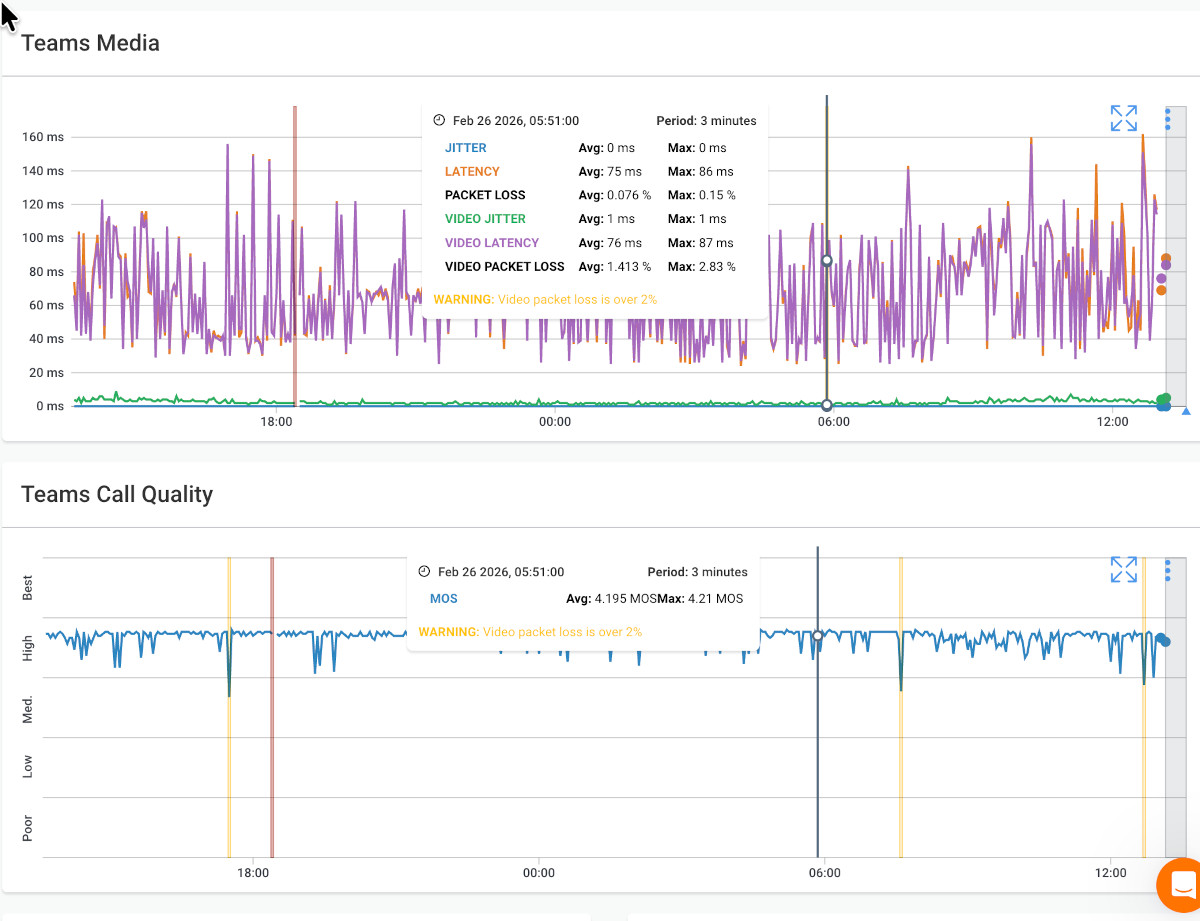
The dashboard displays live MOS scores segmented by location pair and time period, so you can see at a glance which paths are healthy, which are degraded, and how quality has trended over the past hour, day, or week.

Step 5: Set Thresholds and Alerts for MOS Affecting VoIP Quality
A MOS score you only check manually isn't protecting your users. Configure alerts to fire automatically when MOS drops below your defined threshold, typically 4.0 for enterprise voice environments. The goal is for your monitoring tool to flag a problem before it affects VoIP Quality and users start calling the help desk.
In Obkio, threshold alerts can be set per location pair, so a degraded branch office connection triggers an alert independently from your main office path. You get precise, actionable notifications rather than a single global alarm.
Step 6: Correlate MOS with Network Events
When MOS drops, the score tells you that the quality degraded, but not why. This is where historical data becomes critical. Use Obkio's timeline to overlay MOS scores against the underlying network metrics: if MOS dropped at 2pm and jitter spiked at the same moment, the cause is likely a congestion event on that path. If packet loss climbed while latency stayed flat, the issue may be ISP-side rather than local.
This correlation step is what turns a MOS alert from a notification into a diagnosis, and it's what lets your team fix the right problem instead of guessing.
Ready to start measuring MOS score across your network? Obkio's synthetic monitoring gives you continuous MOS data from every location — no active calls required.
What Is a Good MOS Score for Voice Quality?
A good MOS score for voice quality is 4.0 or above. At this level, audio is clear and comfortable to listen to, with only minor impairments that most users won't notice during a normal conversation.
For enterprise voice, whether that's a VoIP phone system, Microsoft Teams, Zoom, or any UCaaS platform, 4.0 is the minimum threshold you should be targeting consistently, not just on average.
Here's how to interpret your scores in practice:
- 4.0 and above — Good: Call quality is acceptable for business use. Users can communicate without frustration, and audio impairments are minimal enough that they don't interfere with the conversation.
- 3.6 to 4.0 — Acceptable, but worth monitoring: Users will notice some degradation, occasional choppy audio, slight delay, or words that don't quite come through cleanly. At this range, quality hasn't failed, but it's trending in the wrong direction, and the underlying network metrics warrant investigation.
- Below 3.6 — Poor: Call quality is actively impacting productivity. Users are spending effort compensating for audio problems rather than focusing on the conversation. At this level, you should expect complaints, repeated words, and calls being cut short or abandoned.
- Below 3.1 — Unacceptable: Communication effectively breaks down. Calls at this MOS level are not viable for business use.
It's also worth distinguishing between an average MOS score and a consistent one. A network that averages 4.1 but regularly dips to 3.4 during peak hours is not a 4.1 network from a user experience perspective; it's a network with a recurring voice quality problem that the average is masking. What matters is how consistently your scores stay above threshold, not just where they land on a good day.
For Microsoft Teams and Zoom specifically, Microsoft and Zoom both publish their own quality thresholds based on similar underlying metrics, but MOS remains the universal benchmark that translates across platforms and lets you evaluate voice quality independently of any single vendor's reporting.

Learn about VoIP latency, uncovering its impact & mastering strategies for seamless call quality. Elevate performance with Obkio's Network Monitoring tool.
Learn moreWhat is An Acceptable MOS Score Use Case?
MOS score targets aren't one-size-fits-all. The right threshold depends on how voice quality directly affects the work being done; a contact center agent handling customer calls all day has a much lower tolerance for degradation than a remote worker on occasional internal calls.
Use these benchmarks when configuring monitoring thresholds, defining SLAs, or evaluating whether your current scores are actually acceptable for your environment.

A few notes on these benchmarks:
Contact centers carry the highest bar because voice quality directly affects customer experience and agent performance. A MOS score that's merely "acceptable" in an internal meeting becomes a liability when it's a customer on the other end evaluating your brand in real time. Target 4.2+ and treat anything below 3.8 as a priority incident.
Remote workers are more variable by nature: Home network conditions, ISP quality, and local Wi-Fi introduce degradation that a controlled office environment doesn't. A realistic target of 3.8+ accounts for that variability, but scores below 3.5 should still trigger investigation rather than being written off as expected.
For MSPs managing multiple clients, per-client SLA thresholds should be defined at onboarding based on the client's use case. A blanket 3.6 minimum is a reasonable floor across the board, but clients running contact centers or high-frequency VoIP should have tighter thresholds written into their agreements, and the monitoring to back them up.
Why Continuous MOS Monitoring Matters for VoIP (vs. Point-in-Time Testing)
Most voice quality problems aren't constant, they're intermittent. A MOS score that looks fine at 10am may drop to 3.4 every day between 12pm and 1pm when network congestion peaks, then recover before anyone runs a test.
A branch office connection that performs well during a scheduled assessment degrades every time a large file transfer runs in the background. These are the problems that generate the most user complaints and take the longest to diagnose, and they're precisely the problems that point-in-time testing cannot catch.
A one-time MOS test gives you a snapshot of quality during the test window. If conditions happen to be stable when you run it, the result looks clean. If the degradation is intermittent (which it usually is), the test simply misses it entirely. You get a passing score, users keep experiencing bad calls, and the help desk keeps logging tickets with no clear cause.
Continuous monitoring works differently. By running synthetic VoIP sessions between agents 24/7, Obkio captures MOS scores across every monitored path at regular intervals, regardless of whether a call is in progress. When quality degrades, the drop is recorded in real time with a precise timestamp, correlated against the underlying network metrics, and surfaced as an alert before users have a chance to escalate it themselves.
The difference is significant:
- Point-in-time testing tells you whether quality was acceptable when you tested it. It gives you no visibility into what happens between tests, overnight, during peak usage, or when specific network events occur.
- Continuous monitoring tells you whether quality is consistently acceptable, and when, where, and why it isn't. It turns MOS from a periodic audit metric into an operational tool your team can act on in real time.
For IT teams managing voice quality across multiple sites, and for MSPs responsible for client SLAs, continuous monitoring isn't just a nice-to-have; it's the only approach that gives you the data you need to actually hold a network to a quality standard. A MOS SLA you can only verify once a month isn't a SLA worth much to anyone.
How to Improve a Low MOS Score
A low MOS score is a symptom, not a root cause. Improving it means identifying which underlying metric is driving the degradation and fixing that specific problem, not applying generic network fixes and hoping quality recovers. Here's how to approach each root cause.
1. High Packet Loss Causing Low MOS
If high packet loss is the primary driver of your low MOS score, start by investigating the network path between the affected locations. Packet loss is usually caused by congestion, a failing network interface, or a problematic segment in the path, and each has a different fix.
Check for network congestion first: if loss spikes during peak usage hours and recovers overnight, the problem is almost certainly bandwidth saturation on a specific segment.
The most effective solution is enabling QoS (Quality of Service) policies that prioritize voice traffic over other data types, ensuring VoIP packets are processed first, even when the network is under load.
If the packet loss is persistent rather than peak-hour, run traceroutes to identify which hop is dropping packets. The problem may be a specific device, link, or ISP segment rather than general congestion.

Optimize VoIP performance with QoS implementation. Explore best practices for QoS for VoIP, overcome challenges, and elevate clarity with Obkio's NPM tool.
Learn more2. High Latency Causing Low MOS
High latency problems require you to find where the delay is accumulating. Visual traceroutes are the fastest way to identify the bottleneck hop. Look for the segment where round-trip time jumps significantly relative to the hops before it.
If the delay is occurring within your own network, evaluate your routing configuration and whether traffic is taking an unnecessarily long path.
If the bottleneck is on a WAN connection, SD-WAN can help by dynamically routing voice traffic across the best available path in real time.
For organizations with consistent latency issues on specific site-to-site connections, MPLS provides dedicated, low-latency paths that eliminate the variability of public internet routing.
3. High Jitter Causing Low MOS
Jitter is typically a congestion problem at its root. Packets are being queued and released unevenly, producing the irregular arrival times that cause choppy audio. Two levers address it directly.
First, tune your jitter buffer settings. Most VoIP systems allow you to configure buffer size; a larger buffer absorbs more variation but adds latency, while a smaller buffer reduces delay but tolerates less jitter. Find the setting that matches your actual jitter levels without introducing unnecessary delay.
Second, implement QoS policies that prioritize RTP (Real-time Transport Protocol) traffic, the packet type that carries voice audio, so voice packets are never queued behind bulk data transfers or other lower-priority traffic.

Learn what a jitter buffer is, how it works, when to use it (or not), and how to optimize call quality across your network with tools like Obkio.
Learn more4. Codec Mismatch or Limitation Causing Low MOS
If your network metrics look healthy but MOS scores are still underwhelming, the problem may be your codec rather than your network. G.729, while bandwidth-efficient at ~8 Kbps per call, has a MOS ceiling of ~3.92 under ideal conditions. If you're targeting 4.0+ and running G.729, you're chasing a score the codec is physically incapable of producing.
Evaluate whether upgrading to G.711 or a modern adaptive codec like Opus is viable for your bandwidth constraints. G.711 delivers significantly higher voice quality at ~64 Kbps per call. If your network can support it, the quality improvement is immediate.
If bandwidth is genuinely limited, Opus offers a middle ground: adaptive bitrate with quality closer to G.711 at higher bitrates, scaling down gracefully when bandwidth is constrained.
5. ISP-Related Degradation Causing Low MOS
When MOS degrades on paths that cross your ISP's network, the challenge is proving where responsibility lies. Without monitoring on both sides of the ISP connection, it's difficult to separate your internal network's performance from your provider's.
Deploy Obkio agents on both sides of the ISP boundary; one agent on your internal network, one at a public cloud location or a remote site on the other side of the ISP segment. When both agents show healthy metrics locally but the path between them degrades, the evidence points clearly to the ISP.
That data is what makes an escalation to your provider actionable and what holds them accountable to the SLA they've committed to.

Learn how BeeVox helps their customers identify the source of VoIP problems using Obkio Public Monitoring Agents. Contact us to learn more.
Learn more4 Tools to Measure MOS Score
Not all MOS measurement tools work the same way, and the differences matter more than they might appear. Here's a breakdown of the main approaches and what each is actually suited for.
1. Network & MOS Monitoring Tools
Obkio is purpose-built for continuous MOS monitoring at the network level. Distributed monitoring agents deploy across all your locations (offices, remote workers, cloud environments) and generate synthetic VoIP traffic between agent pairs 24/7, measuring packet loss, latency, and jitter to calculate live MOS scores across every monitored path.
Real-time dashboards, configurable threshold alerts, and historical data for root-cause correlation make it an operational tool rather than a diagnostic one. Built for IT teams and MSPs managing voice quality across multiple sites and clients.
2. Packet Capture Tools
Packet capture tools like Wireshark can analyze RTP streams and extract per-call quality metrics manually. It's genuinely useful for deep-dive diagnostics on a specific call or a known incident, but it requires technical expertise, captures only what's happening during the capture window, and doesn't scale to ongoing monitoring across a distributed network. It's a scalpel, not a surveillance system.
3. VoIP Testing Tools
Dedicated VoIP test tools, such as SolarWinds VoIP & Network Quality Manager or JDSU/Viavi network testers, run scheduled or on-demand VoIP quality tests and report MOS scores for those test windows.
These tools are useful for periodic assessments and pre-deployment validation, but are limited by the same fundamental constraint as all point-in-time testing: they only tell you what quality looked like when the test ran, not what users experience between tests.
4. Built-in UCaaS Reporting Features
Built-in UCaaS reporting from platforms like Microsoft Teams and Zoom provides post-call quality data, including MOS estimates, jitter, and packet loss at the call level. This is valuable for reviewing specific calls after quality complaints, but it's reactive by design. It tells you a call was bad after it happened, with no proactive alerting and no visibility into network conditions between calls.

Obkio is the only continuous MOS monitoring tool built for IT teams and MSPs, giving you live scores, threshold alerts, and root-cause data across every network location.
FAQ: Measuring MOS Score for Voice Quality
1. What is a MOS score in networking?
MOS score (Mean Opinion Score) is a numerical measure of perceived voice call quality on a scale of 1 to 5. In networking, it's calculated using the ITU-T E-Model, which converts measurable network metrics (packet loss, latency, and jitter) into an estimated quality score via an intermediate R-factor value. It's the industry-standard benchmark for quantifying VoIP and unified communications quality.
2. What is a good MOS score for VoIP?
A good MOS score for VoIP is 4.0 or above. Scores between 3.6 and 4.0 are acceptable but indicate noticeable degradation that warrants investigation. Below 3.6, call quality begins to actively impact productivity. Below 3.1, calls are effectively unusable for business communication.
3. How is MOS score calculated from network metrics?
MOS score is estimated using the ITU-T G.107 E-Model. The model takes three network measurements, one-way delay, jitter, and packet loss, and calculates an R-factor score between 0 and 100. That R-factor maps directly to an estimated MOS value: an R-factor of 80–90 corresponds to a MOS of approximately 4.0–4.3, while an R-factor below 60 indicates a MOS below 3.0.
4. What causes a low MOS score?
Low MOS scores are caused by one or more of the following: packet loss above 1.5%, one-way latency above 150ms, jitter above 30ms, or a codec with a low quality ceiling, such as G.729.
In practice, the cause is often a combination; congestion on a network path drives up both packet loss and jitter simultaneously, compounding the MOS impact of each individual metric.
5. What is the difference between MOS and R-factor?
R-factor and MOS score both measure voice quality, but on different scales. R-factor runs from 0 to 100 and is the intermediate calculation produced by the ITU-T E-Model from raw network metrics. MOS runs from 1 to 5 and is the more widely recognized quality benchmark.
R-factor is converted to MOS using a standardized formula. Most monitoring tools, including Obkio, display the final MOS value rather than the raw R-factor.
6. Can MOS score be measured without active calls?
Yes. Tools like Obkio use synthetic monitoring, generating VoIP-like traffic between monitoring agents, to measure the network metrics needed for MOS calculation continuously, without requiring any live calls to be in progress. This allows you to track MOS scores 24/7 across all monitored network paths, capturing degradation that would otherwise go undetected between calls.
7. What MOS score threshold should I use for alerts?
For most enterprise voice environments, set your alert threshold at 4.0, the minimum score for acceptable business call quality. For contact centers or other high-stakes voice environments, consider a higher threshold of 4.2 to give your team time to investigate before quality reaches the point where users are affected. The goal is to be alerted before users start reporting problems.
8. How does packet loss affect MOS score?
Packet loss has a disproportionately large impact on MOS score because VoIP does not retransmit lost packets; the audio is simply gone. Even 1% packet loss produces noticeable audio artifacts. At 3–5%, MOS scores typically drop below 3.6, and calls become difficult to conduct. Above 5%, calls are generally unusable. Packet loss is often the single most damaging metric for voice quality.
Start Measuring MOS Score Before Your Users Notice the Problem
MOS score is only useful as an operational metric if it's measured continuously, tied to real network data, and acted on quickly. A score you check once a month tells you very little. A score that updates in real time across every network path, with alerts that fire before users start complaining, gives your team the visibility to actually manage voice quality rather than react to it after the fact.
The steps are straightforward: deploy monitoring agents at every location that handles voice traffic, collect the underlying network metrics continuously, let the E-Model do the calculation, and use the data to correlate MOS drops with their root causes. The difference between a network that consistently delivers 4.0+ MOS and one that averages 4.0 but regularly dips to 3.2 isn't luck; it's visibility.
For IT teams managing multi-site voice infrastructure, and for MSPs accountable to client SLAs, that visibility starts with having the right monitoring tool in place. Obkio's continuous MOS monitoring gives you live scores, threshold alerts, and the historical data you need to diagnose problems and prove where responsibility lies, across every location, every path, and every client.
Try Obkio free for 14 days! No active calls required, no complex setup. Deploy agents, start measuring MOS score across your network, and see exactly where your voice quality stands.

