Table of Contents
Table of Contents
There’s a lot of talk about SD-WAN technology in the networking world, and so many businesses are making the switch to SD-WAN with promises of higher, more reliable performance. But, when they do, so many companies lack SD-WAN networks visibility to identify performance issues, and see if their SD-WAN service is actually performing as promised.
In the last few years, the Network Pros from Obkio’s Network Performance Monitoring Software have helped hundreds of clients through SD-WAN migrations, which include monitoring hundreds of network sites and troubleshooting common SD-WAN issues.
Using this experience, the article is going to discuss why and how businesses can improve their SD-WAN visibility to identify performance issues that could impact your business’ performance.
Here’s the bottom line: Many businesses don’t have the visibility they need to monitor their SD-WAN network and service.
Service Providers can’t provide visibility: SD-WAN vendors will sell you with big promises about the performance of SD-WAN, and SD-WAN networks are truly an impeccable option for large enterprises. But SD-WAN networks are still prone to network issues that vendors and Service Providers can’t see using the native monitoring features included in their SD-WAN service.
SD-WAN networks aren’t prone to network issues: No matter the power of SD-WAN, like any network, SD-WAN can experience network issues that affect user experience. Common SD-WAN issues like high bandwidth and CPU usage are going to happen at some point - so you need the visibility to proactively identify and solve them.
SD-WAN’s native monitoring features aren’t enough: The native monitoring features included in your SD-WAN service don’t provide the 360-degree visibility needed for monitoring and troubleshooting every network location. They also can’t notify you if something goes wrong. For example, when you have SD-WAN 2 connections in a network, let’s call them ISP #1 and ISP #2, you won’t be notified if ISP #1 is experiencing issues and goes down, because the other will just take over.
Troubleshooting can be difficult: Even without Firewall As A Service (FWaaS), there’s always performance issues. But when you add that layer, it also involves a Service Provider in the mix and more communication paths to monitor and troubleshoot. Additionally, it’s also extremely hard to troubleshoot issues in IPSec Tunnels without the right tools.
There’s a lot of ping-pong with Service Providers: There’s also a lot of back and forth between customers and Service Providers when performance issues arise, because no one has the visibility to know where the problem is coming from or who is responsible for fixing it.
You need SD-WAN visibility, so how do you get it? Well, you monitor your SD-WAN network.
In the realm of networking, SD-WAN has become a widely adopted solution for optimizing performance. While SD-WAN native monitoring features offer valuable insights into SD-WAN-specific elements, Network Monitoring tools take visibility to the next level. These tools provide a centralized management platform, support for multiple vendors, customizable dashboards, historical data analysis, and advanced analytics.
Businesses using SD-WAN need to deploy a modern Agent-based solution, like Obkio Network Performance Monitoring software, with dedicated SD-WAN Monitoring capabilities.
Obkio’s tool is able to monitor end-to-end SD-WAN performance from the end-user perspective to provide visibility of every network connection to understand:
- If the SD-WAN service is performing as promised
- If it’s not, what problems are affecting their SD-WAN networks
- Where the problems happened (in their local network or Service Provider network)
- Who is responsible for troubleshooting the issue

To get visibility of your SD-WAN network, you need to understand the design of your network so you can adapt that design to your monitoring setup to the network design.
This is the type of SD-WAN network design that most companies use:
- Internet local breakout
- Internet VPN IPSec between the site and ZScaler (Firewall As A Service)
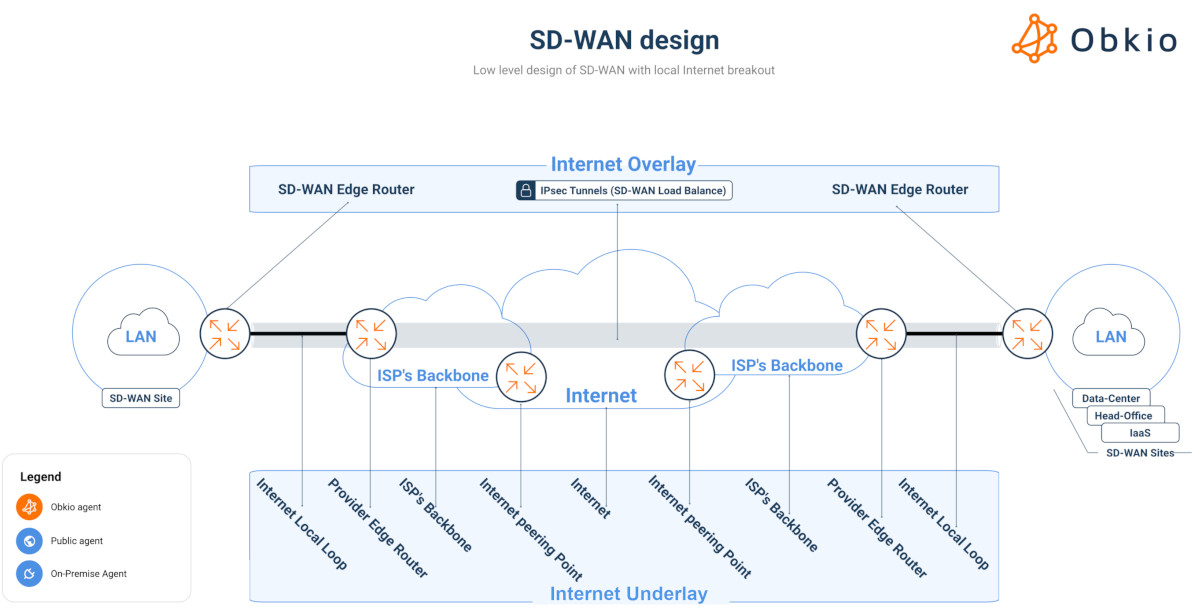
As mentioned earlier, SD-WAN issues are bound to happen. Most companies using SD-WAN experience performance issues on the last mile of the network, which generally has the lowest speeds, the least route diversity and the most single points of failure.
If your business also has Firewall As A Service (FWaaS), it also involves a Service Provider in the mix and more communication paths to monitor. You’ll also have to open a support ticket with your Service Provider if the problem is on their end and you want them to troubleshoot. You’ll need proof for that, which your SD-WAN Monitoring Tool will help you collect.
By thoroughly identifying these SD-WAN components, network administrators can create a comprehensive inventory of their SD-WAN infrastructure. This inventory serves as the foundation for setting up an effective monitoring system that can track the performance, health, and security of the SD-WAN network and improve overall SD-WAN visibility.
In addition, here are some key SD-WAN components to identify:
- SD-WAN Edge Devices: SD-WAN edge devices are located at the edges of the network, typically at branch offices or remote locations. These devices are responsible for connecting the local area network (with LAN monitoring) to the SD-WAN network. They manage traffic flow, perform packet optimization, and enforce policies based on application, user, or other criteria.
- SD-WAN Controllers: The SD-WAN controller is the central brain of the SD-WAN network. It is responsible for orchestrating and managing all the edge devices. The controller sets policies, monitors network conditions, and dynamically adjusts traffic paths to optimize performance. Identifying the controller is crucial, as it provides a holistic view of the entire SD-WAN deployment.
- Transport Links: SD-WAN can utilize various types of transport links, such as MPLS, broadband internet, 4G/5G, or satellite connections. Each link offers different characteristics in terms of bandwidth, latency, and reliability. Identifying the transport links and their quality is essential for monitoring the performance and health of the SD-WAN connections.
- Virtual Overlays: SD-WAN uses virtual overlays to abstract the underlying transport links and create a logical, secure network. These overlays allow for flexible and dynamic traffic steering based on real-time conditions. Identifying the virtual overlays and understanding how they map to physical transport links is vital for effective monitoring and troubleshooting.
- Security Appliances: SD-WAN often includes security features to protect data and applications. These security appliances could be integrated into the SD-WAN edge devices or exist as standalone components. Identifying these security elements helps ensure that security is adequately monitored and maintained.
- Quality of Service (QoS) Policies: SD-WAN relies on QoS policies to prioritize and shape traffic based on specific requirements. Identifying the QoS policies and their impact on traffic flow helps monitor application performance and enforce service level agreements (SLAs).
- Centralized Management Interfaces: SD-WAN deployments are typically managed through centralized interfaces provided by the SD-WAN controller or management system. Identifying and configuring these management interfaces allow you to gather data and control the SD-WAN network from a single point.
- Virtual Private Network (VPN) Configuration: Many SD-WAN deployments use VPNs to establish secure connections between different sites. Identifying the VPN configuration ensures that encrypted traffic is correctly monitored and secured.
Obkio’s Network Performance Monitoring tool gives you SD-WAN visibility by continuously monitoring every end of your SD-WAN network, including the SD-WAN overlay and underlay, with synthetic traffic using Network Monitoring Agents.
This is the setup you need for end-to-end SD-WAN visibility:
- A Local Monitoring Agent installed behind the SD-WAN appliance at every site you need visibility of.
- Three Remote Monitoring Agents deployed in locations like clouds, data centers, and branch offices to monitor Internet and Cloud apps.
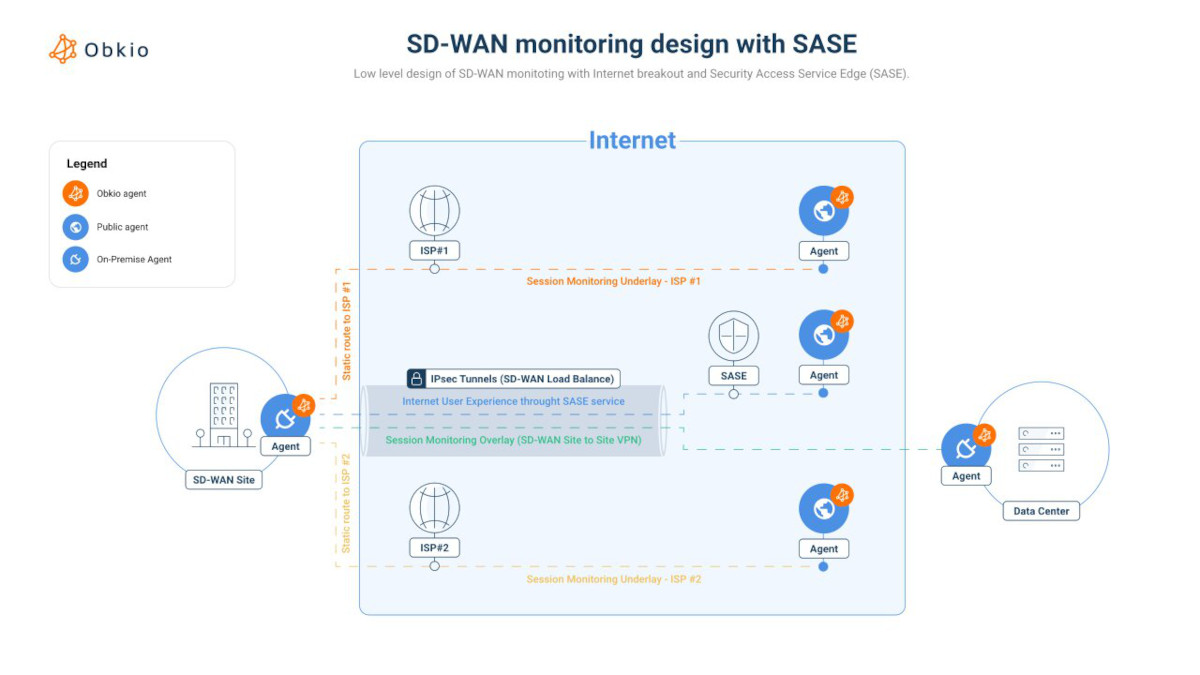

With this setup, you’ll also have visibility of:
- ISP #1 connection
- ISP #2 connection
- The End-User (load balanced between the connection using the SD-WAN algorithm)
- The SASE Service
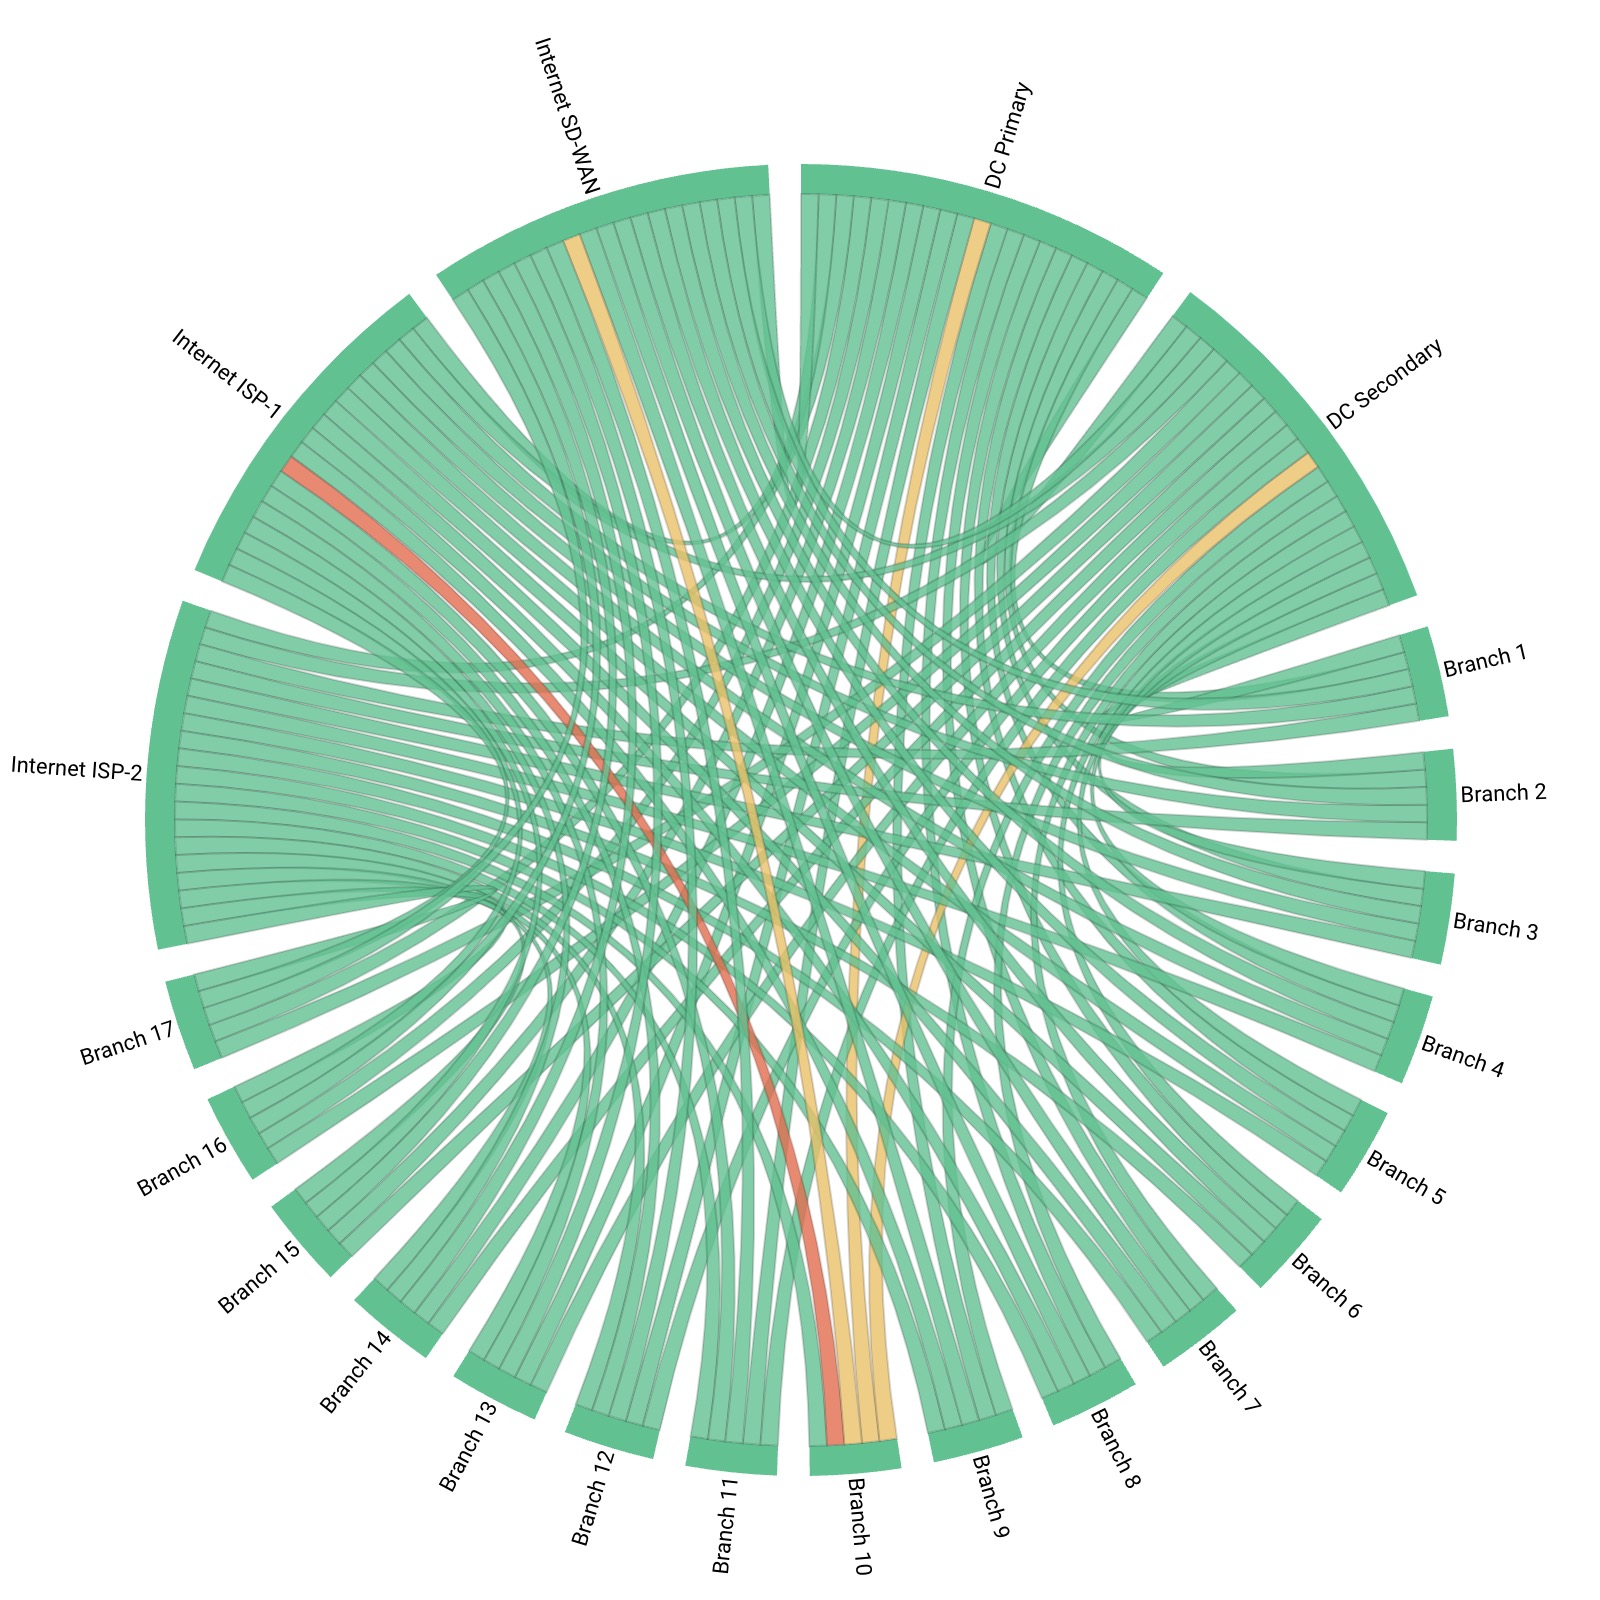
Once deployed, the Agents create Monitoring Sessions and use synthetic UDP traffic to monitor every network path, to measure performance metrics and identity issues.
To go a step further, use APM HTTP features to monitor critical business applications, like Zoom and Microsoft Teams, from the real end-user perspective, and identify network problems affecting your most used applications.
To ensure the seamless operation of SD-WAN deployments, administrators must have complete visibility into the network's performance, health, and security. This section delves into the essential components that demand monitoring to achieve comprehensive SD-WAN visibility.
To achieve complete SD-WAN visibility, you should monitor a comprehensive set of network components that collectively provide insights into the performance, health, and security of the SD-WAN deployment. Here are the key SD-WAN network components that you should monitor:
- SD-WAN Edge Devices: Monitor the status, performance, and health of all SD-WAN edge devices located at branch offices or remote sites. This includes tracking device availability, CPU and memory utilization, link utilization, and any hardware-specific metrics provided by the manufacturer.
- SD-WAN Controllers: Monitor the SD-WAN controller(s) responsible for orchestrating and managing the entire SD-WAN network. Track controller health, CPU and memory usage, controller connectivity to edge devices, and any critical controller-specific metrics.
- Transport Links: Monitor the various transport links used in the SD-WAN deployment, such as MPLS, broadband internet, 4G/5G, or satellite connections. Measure link utilization, latency, jitter, packet loss, and overall link health. Understanding link performance helps optimize traffic flow and ensures the best possible user experience.
- Virtual Overlays: Monitor the virtual overlays that abstract the underlying transport links. Keep track of overlay status, traffic distribution across overlays, and any virtual network metrics relevant to your SD-WAN deployment.
- Quality of Service (QoS) Policies: Monitor the effectiveness of QoS policies in prioritizing and shaping traffic. Verify that critical applications receive the required bandwidth and are not impacted by less important traffic.
- Application Performance: Monitor the performance of specific applications across the SD-WAN network. This involves tracking application response times, throughput, and any application-specific metrics that affect user experience.
- Security Appliances: Monitor security appliances integrated into the SD-WAN network. Ensure that these appliances are operating correctly, and inspect security-related metrics to identify potential security threats.
- VPN and Tunnel Performance: Monitor the performance and stability of VPN connections and tunnels between different SD-WAN sites. Verify that encrypted traffic is flowing correctly and that tunnel establishment is reliable.
Customizing dashboards for relevant insights is a critical aspect of improving SD-WAN visibility for businesses. Dashboards serve as the central interface for monitoring and analyzing the performance and health of the SD-WAN network. Luckily, Obkio's Network Monitoring tool allows you to fully customize your SD-WAN and Network Monitoring dashboards to show you the information you really need!
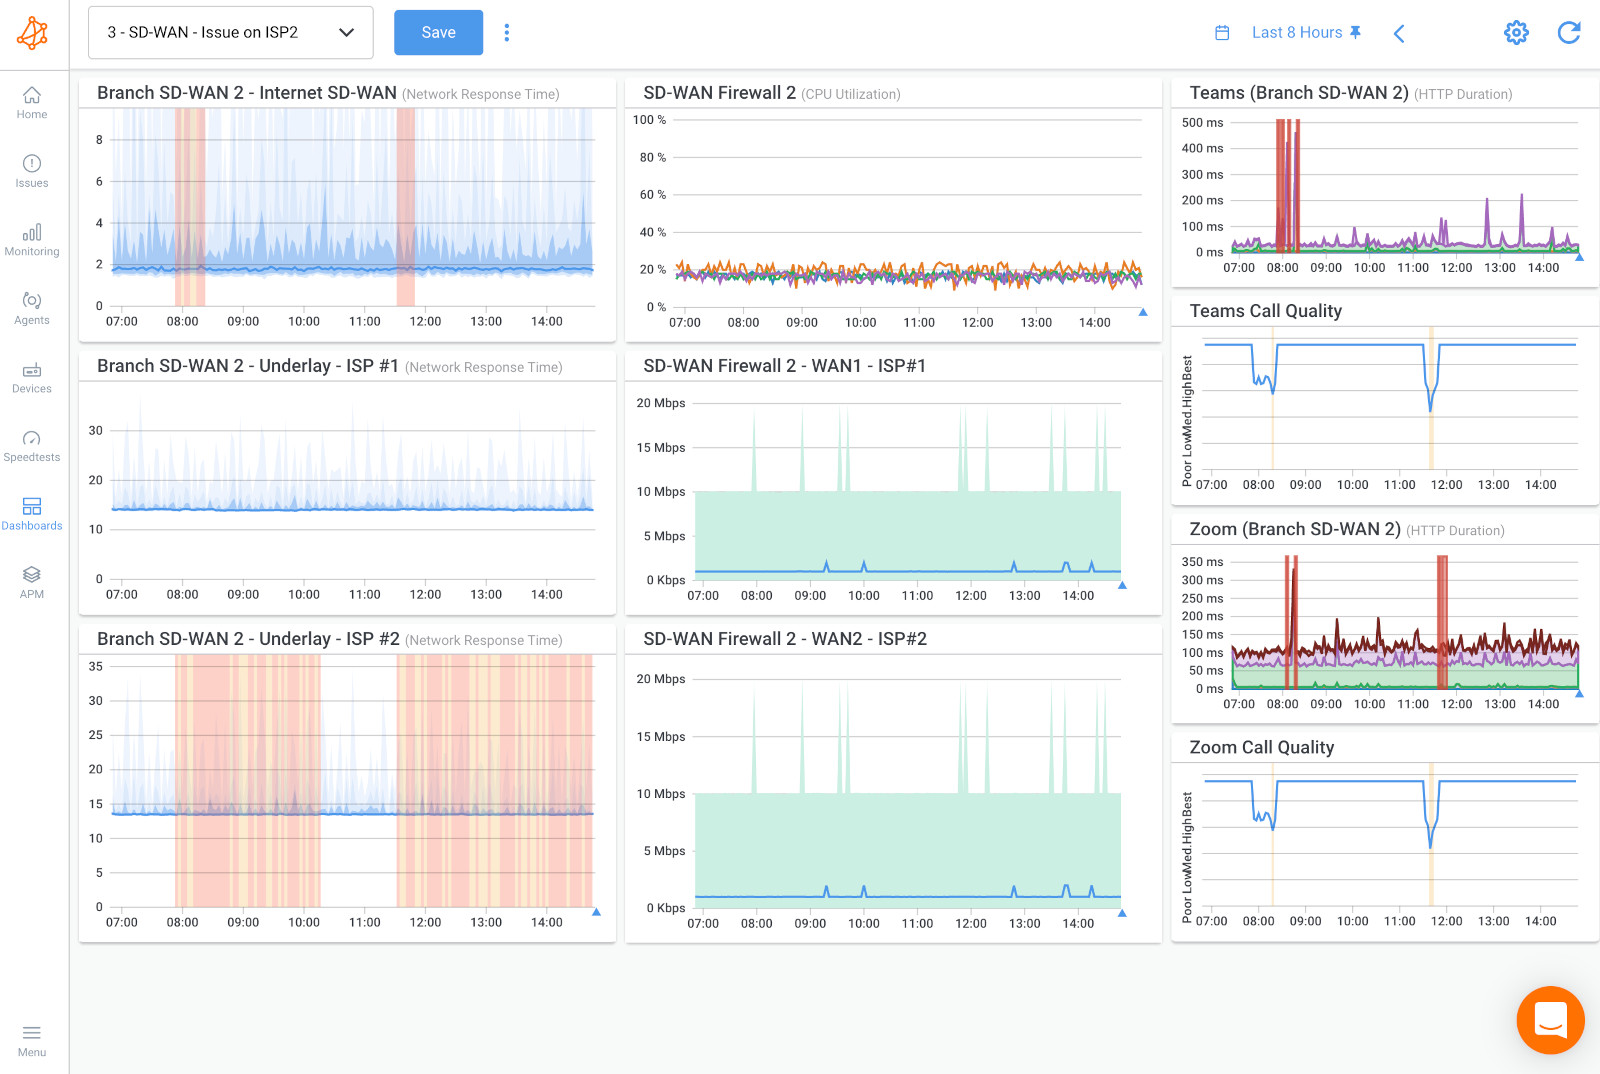
By tailoring these dashboards to display specific metrics and Key Performance Indicators (KPIs) that align with the organization's objectives, stakeholders can quickly gain actionable insights, identify issues, and make informed decisions. Here's an in-depth look at customizing dashboards for relevant insights:
- Understanding Stakeholder Needs: Different stakeholders within the organization may have varying requirements and priorities when it comes to SD-WAN visibility. Network administrators might focus on technical metrics like link utilization and latency, while upper management may be more interested in high-level performance indicators tied to business objectives. By understanding these needs, you can create customized dashboards that cater to each stakeholder's specific requirements.
- Selecting Key Metrics and KPIs: Determine the most crucial metrics and KPIs for your SD-WAN deployment. These could include link utilization, packet loss, latency, application performance, bandwidth usage, and security-related metrics. Focus on metrics that directly impact network performance, user experience, and overall business productivity.
- Organizing Dashboards Intuitively: Arrange the dashboard elements in an intuitive manner that presents the data logically and efficiently. Group related metrics together, use clear labels, and consider visual elements like charts and graphs to convey information effectively.
- Real-Time vs. Historical Data: Consider whether your stakeholders require real-time data or historical trends. For network administrators, real-time data might be crucial for immediate troubleshooting, while historical data helps with long-term analysis, network capacity planning, and trend identification.
- Drill-Down Capabilities: Implement drill-down capabilities in the dashboard, allowing stakeholders to access more detailed information when needed. For example, a high-level dashboard could show overall network performance, while users can click on specific elements to view site-specific details or individual application performance.
Customizing Views for Different Roles: Different roles within the organization may require different levels of detail and access to various metrics. Ensure that dashboards can be customized or have different views tailored for network administrators, IT managers, and executives.
Using Alerts and Thresholds: Integrate alerts and threshold notifications directly into the dashboard. This feature helps stakeholders stay informed about critical issues or performance deviations that require immediate attention.
Historical Data Analysis and Trending play a crucial role in improving SD-WAN visibility and optimizing network performance. By collecting and analyzing historical data over time, network administrators can gain valuable insights into long-term trends, patterns, and potential issues that might not be immediately apparent in real-time monitoring.
Obkio's Network Monitoring tool automatically collects and analyzes historical data for you, so you can easily go back in time to view past SD-WAN performance and identify intermittent network problems.
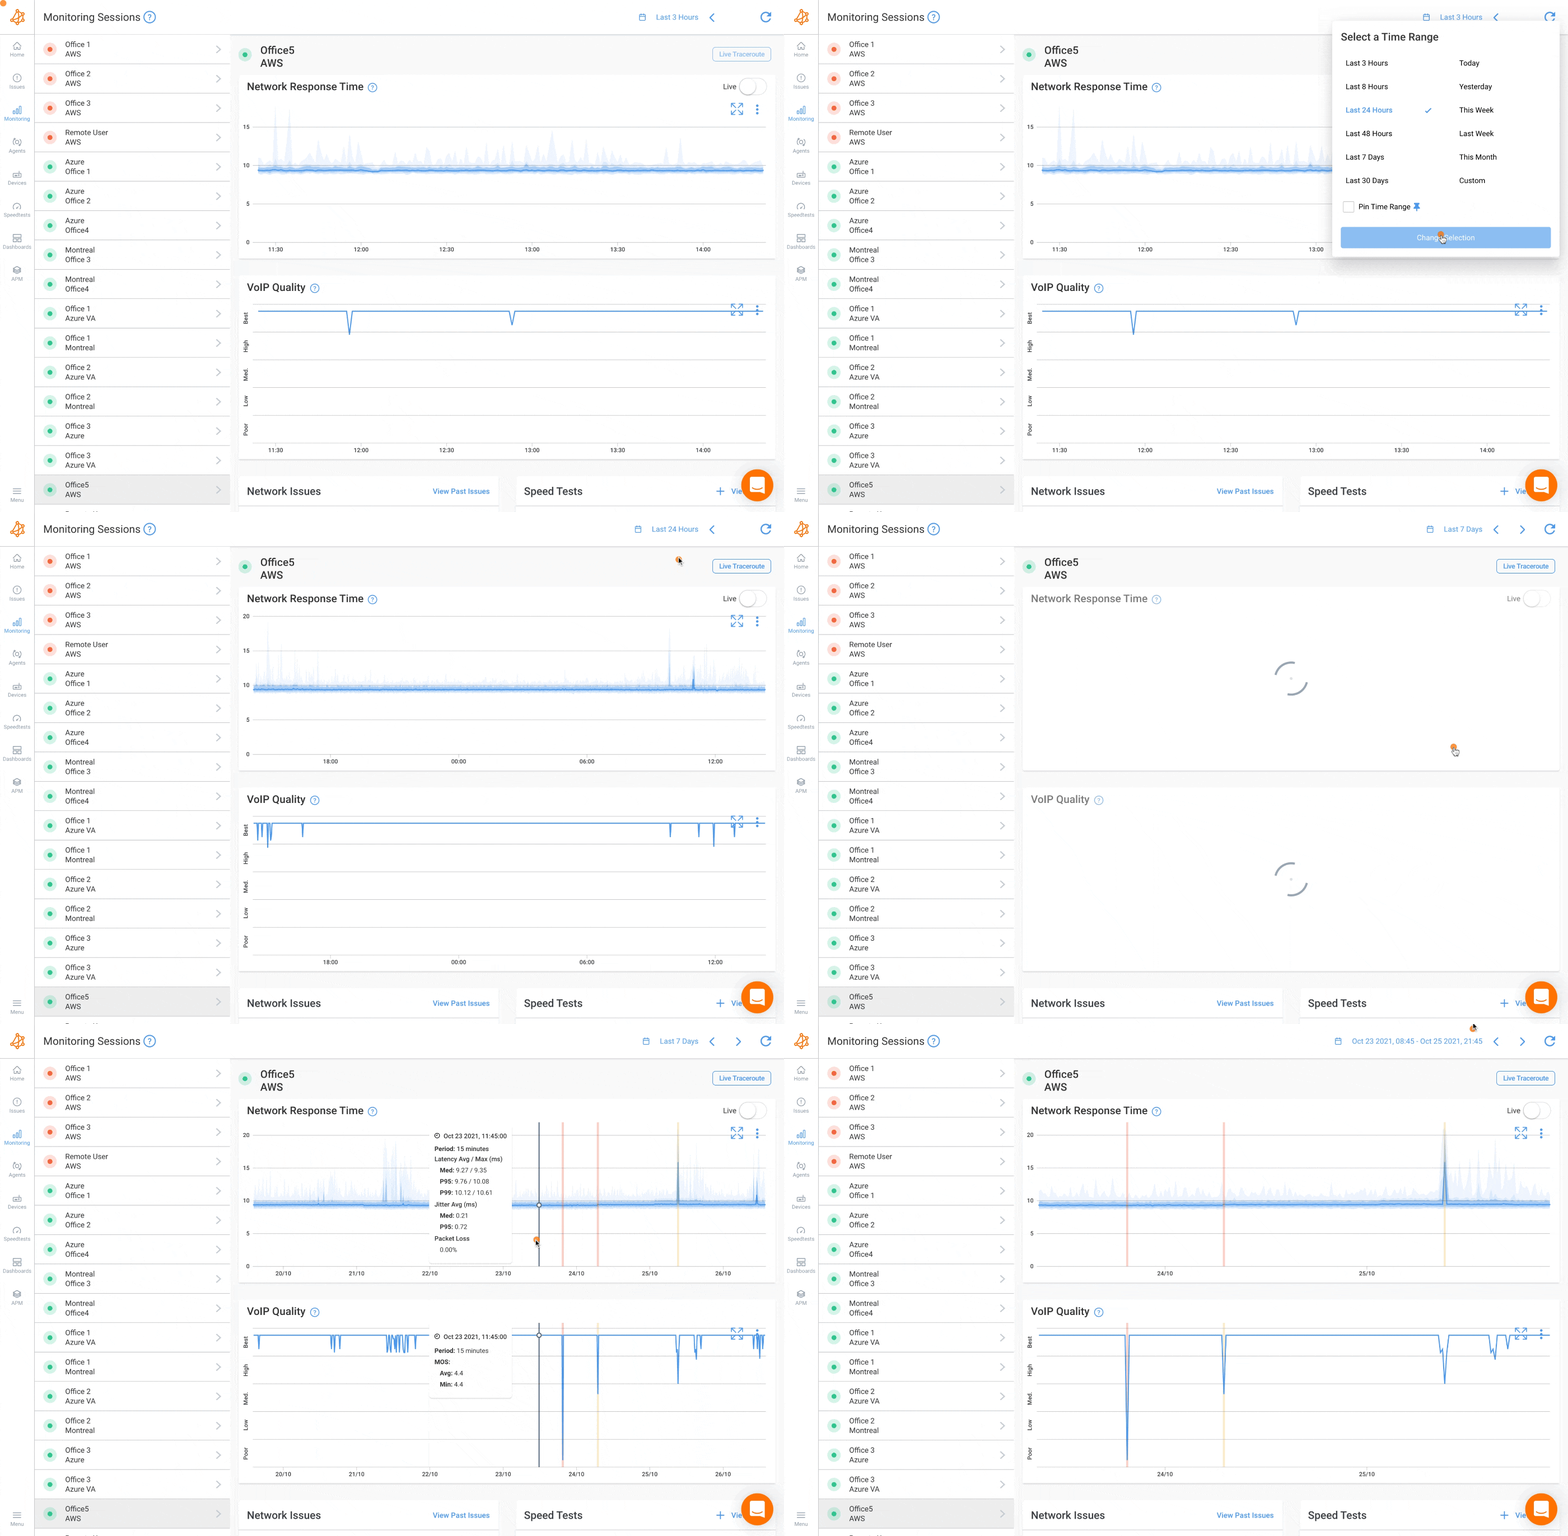
- Long-Term Performance Analysis: Historical data allows for a retrospective analysis of the SD-WAN network's performance over days, weeks, months, or even years. This long-term view helps identify performance trends, such as recurring bottlenecks, congestion periods, or shifts in traffic patterns. Understanding these trends enables administrators to optimize the network for improved efficiency and user experience.
- Capacity Planning: Analyzing historical data helps predict future network requirements and demands. By observing past data usage and growth patterns, administrators can make informed decisions about network capacity upgrades, ensuring that the SD-WAN infrastructure can handle increasing traffic and evolving business needs.
- Issue Identification and Root Cause Analysis: Historical data is valuable for identifying the root causes of past network issues or network outages. It helps recreate past scenarios to pinpoint the reasons for network degradation or failures, enabling proactive measures to prevent similar incidents in the future.
- Performance Baselines: Historical data is used to establish performance baselines, which are typical levels of network performance under normal conditions. Baselines serve as reference points to measure deviations from expected behavior and facilitate the detection of anomalies or deviations that require attention.
- Optimizing QoS Policies: Analyzing historical data on application performance and bandwidth utilization allows administrators to fine-tune Quality of Service (QoS) policies. By understanding historical traffic patterns, QoS settings can be adjusted to ensure critical applications receive appropriate priority during peak usage periods.
- Predictive Analysis: By using historical data alongside predictive analytics, administrators can anticipate potential network issues before they occur. Predictive analysis uses machine learning algorithms to forecast future network behavior, enabling proactive problem-solving and avoiding potential downtime.
- Service Level Agreement (SLA) Compliance: Historical data is essential for evaluating SLA compliance over extended periods. Monitoring performance against SLAs ensures that service providers deliver the agreed-upon network performance and guarantees for business-critical applications.
- Benchmarking and Performance Evaluation: Historical data serves as a benchmark for evaluating the effectiveness of changes or improvements made to the SD-WAN network. By comparing current performance with past data, administrators can gauge the impact of their actions and implement continuous improvements.
With complete SD-WAN of your entire network infrastructure, your business will truly be able to understand if your SD-WAN service is really performing as the way your SLA and Service Provider promised.
If it isn’t, Obkio’s Network Performance Monitoring tool is essential for proactively locating SD-WAN issues, no matter when and where they come from. Learn more about the most Common SD-WAN Issues we’ve come across.
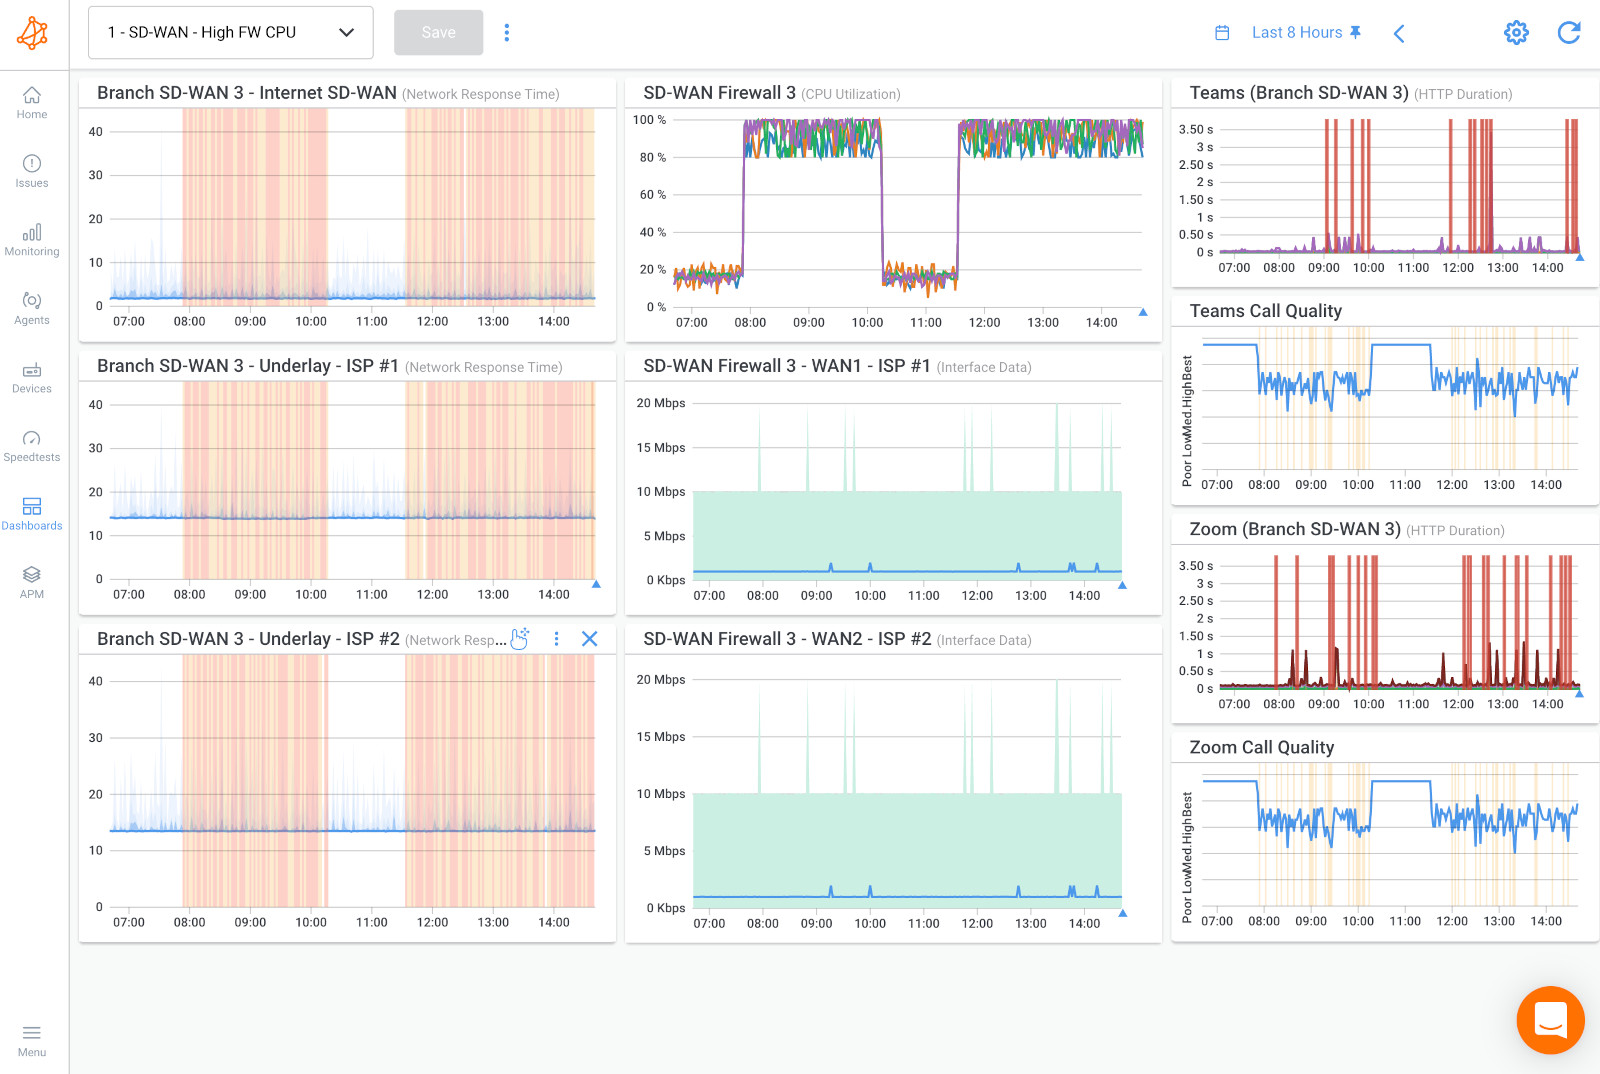

Some common SD-WAN network issues include:
- Packet Loss: Packet loss occurs when data packets fail to reach their destination, resulting in data retransmission and potential degradation of application performance.
- Latency: Latency refers to the delay in data transmission between source and destination. High latency can cause sluggish application response times and negatively affect real-time applications like VoIP (VoIP latency) or video conferencing.
- Jitter: Jitter is the variation in latency over time. Excessive jitter can lead to choppy audio or video during real-time communication (ex. VoIP jitter).
- Link Congestion: If one or more transport links become congested due to heavy traffic load, it can result in degraded network performance and slower data transfer rates.
- Link Flapping: Link flapping occurs when a network link rapidly alternates between up and down states. This can disrupt network connectivity and lead to instability in the SD-WAN.
- Routing Inefficiencies: Incorrect or suboptimal routing decisions can cause traffic to take inefficient paths, leading to subpar performance and potential data congestion.
- Quality of Service (QoS) Misconfigurations: Improper QoS settings may prioritize non-critical traffic over business-critical applications, leading to a poor user experience for the latter.
- Application Performance Issues: Certain applications may not function optimally over the SD-WAN, particularly if not configured correctly or if the network lacks the necessary resources.
- Failover Problems: SD-WAN is designed to provide seamless network failover between transport links, but issues during the failover process can cause disruptions in network connectivity or network disconnections.
- Overlay-Underlay Mismatch: Inconsistent mapping between the virtual overlay and the underlying physical network may lead to traffic routing issues and suboptimal performance.
- SD-WAN Edge Device Failures: Malfunctioning or misconfigured SD-WAN edge devices can negatively impact network stability and performance.
- Lack of Application Visibility: Without proper visibility into application performance and usage, administrators may struggle to identify and address application-specific issues.
- Multi-Vendor Compatibility Issues: In heterogeneous network environments with multiple SD-WAN vendors, compatibility problems might arise, affecting the seamless integration of different components.
Learn how to troubleshoot SD-WAN issues using Obkio Network Monitoring software and key SD-WAN troubleshooting steps.
Learn more

Using the SNMP Network Monitoring, your business will be able to also monitor your SD-WAN Edge Equipment to identify if performance issues are happening in your local network and how many sessions are being affected, or if the issue is happening in your Service Provider’s network.
SD-WAN issues happening locally, such as degraded performance or connectivity problems, can indeed be attributed to various factors, one of which is high CPU or bandwidth usage on the SD-WAN Edge Router. The SD-WAN Edge Router is a critical component responsible for managing traffic, enforcing policies, and optimizing the flow of data between the local network and the SD-WAN.
When the CPU of the SD-WAN Edge Router becomes overwhelmed due to high processing demands, it may struggle to efficiently handle traffic and policy enforcement, resulting in slower response times, increased latency, or even packet loss.
Similarly, if the available bandwidth on the SD-WAN Edge Router is insufficient to handle the volume of traffic passing through it, network congestion can occur, leading to bottlenecks and performance issues.
In such scenarios, troubleshooting the SD-WAN issues should involve collaboration with your internal IT or network team. Here are some steps they might take to address the problem:
- Monitor CPU and Bandwidth Usage: The first step is to monitor the CPU and bandwidth usage on the SD-WAN Edge Router. Network monitoring tools can provide real-time data on resource utilization, helping to identify periods of high demand and potential bottlenecks.
- Identify Resource-Intensive Applications: Determine if specific applications or services are causing high CPU or bandwidth usage on the SD-WAN Edge Router. This information can help prioritize critical applications and allocate resources accordingly.
- Optimize QoS Policies: Review and fine-tune Quality of Service (QoS) policies to ensure that essential applications receive sufficient resources and priority, while less critical traffic is appropriately managed.
- Upgrade Hardware or Bandwidth: If the SD-WAN Edge Router's hardware is outdated or incapable of handling the network's demands, consider upgrading to a more robust model. Additionally, upgrading the bandwidth capacity can alleviate congestion and improve performance.
- Review Security Settings: High CPU usage can sometimes be attributed to security-related processes, such as Deep Packet Inspection (DPI) or encryption. Adjusting security settings or utilizing dedicated security appliances can help distribute the load.
- Review Network Design and Topology: Examine the network design and topology to ensure that traffic flows efficiently and that there are no suboptimal routing paths or loops causing additional load on the SD-WAN Edge Router.
- Firmware and Software Updates: Keeping the SD-WAN Edge Router's firmware and software up to date can resolve known bugs or performance issues.
- Load Balancing and Link Optimization: Implement load balancing and link optimization techniques to distribute traffic across multiple links effectively, reducing the burden on individual links.
In this article, we talk about improving SD-WAN visibility using Network Monitoring tools instead of SD-WAN's native monitoring features. You may be wondering why that is...
SD-WAN native monitoring features offer essential insights into the health and performance of SD-WAN devices and connections. However, to achieve a more comprehensive and holistic view of the entire network, Network Monitoring tools step in to provide enhanced visibility and monitoring capabilities.
Network Monitoring tools provide more visibility into SD-WAN than SD-WAN native monitoring features for several reasons:
Network Monitoring tools often provide a centralized network performance management platform that can monitor and analyze the entire network, including SD-WAN components. This centralized approach allows administrators to get a holistic view of the network's performance and health, regardless of the number of SD-WAN devices or locations.
On the other hand, SD-WAN native monitoring features might be limited to individual devices or regional views, lacking a comprehensive overview.
Network Monitoring tools are designed to work with various vendors' equipment and technologies, making them more versatile in heterogeneous environments. For example, with a Network Monitoring tool like [Obkio], you can monitor all SD-WAN vendors like:
SD-WAN solutions from different vendors may have proprietary monitoring features, and relying solely on native monitoring might lead to gaps in visibility when using a mix of SD-WAN vendors.
Note: You can also use Obkio to monitor Dual-WAN networks.
Network Monitoring tools often offer customizable dashboards and reporting capabilities. Administrators can tailor these interfaces to display specific metrics and key performance indicators (KPIs) relevant to their organization's needs. This level of customization enables them to focus on critical aspects of their SD-WAN deployment and troubleshoot issues more effectively.
SD-WAN native monitoring features may not provide the same level of flexibility and might be limited to predefined dashboards.
Network Monitoring tools typically store historical data over extended periods. This data retention allows for trend analysis, capacity planning, and identification of long-term performance patterns or anomalies.
In contrast, some SD-WAN native monitoring features might lack the capability to store historical data for an extended period, limiting their ability to provide insights into long-term network behavior.
Network Monitoring tools can often integrate with a wide range of network devices, including routers, switches, firewalls, and SD-WAN appliances. This integration allows for cross-platform correlation and more comprehensive visibility into how the entire network ecosystem interacts.
While SD-WAN native monitoring features may excel in monitoring SD-WAN-specific metrics, they might not cover other network elements as extensively.
Network Monitoring tools often incorporate advanced analytics and alerting mechanisms that use machine learning and artificial intelligence to detect anomalies, predict issues, and provide proactive notifications. These capabilities help identify potential SD-WAN performance bottlenecks or security threats before they escalate.
SD-WAN native monitoring features may lack these advanced analytics capabilities.
Learn how to monitor SD-WAN networks with Network Monitoring to get complete visibility over your SD-WAN service and identify SD-WAN issues.
Learn more

Overall, while SD-WAN native monitoring features offer essential insights into the SD-WAN-specific aspects, Network Monitoring tools complement and enhance this visibility by providing a more comprehensive, centralized, and feature-rich monitoring solution that covers the entire network infrastructure. This allows organizations to make informed decisions, optimize network performance, and ensure a reliable and efficient SD-WAN deployment.
SD-WAN visibility is of paramount importance when it comes to SLA monitoring and adhering to Service Level Agreements (SLAs).
SLAs define the agreed-upon performance standards and service guarantees between service providers and their customers. In the context of SD-WAN, SLAs outline the expected network performance, network availability, and responsiveness that the provider must deliver to ensure a satisfactory user experience.
- Real-Time Performance Monitoring: SD-WAN visibility, with monitoring tools like Obkio, allows network administrators to continuously monitor key performance indicators (KPIs) in real-time. Metrics such as latency, jitter, packet loss, and link utilization can be closely monitored to ensure that the network meets SLA-defined thresholds.
- Proactive Issue Detection: With comprehensive SD-WAN visibility, administrators can proactively detect and address performance issues before they impact SLA compliance. Immediate network monitoring alerts and notifications enable timely troubleshooting and issue resolution.
- End-to-End Application Monitoring: SD-WAN visibility provides insights into application performance across the entire network. Monitoring application response times and throughput helps ensure that critical applications receive the necessary resources to meet SLA requirements.
- Traffic Prioritization and QoS Enforcement: Visibility into SD-WAN allows administrators to enforce Quality of Service (QoS) policies effectively. Prioritizing traffic according to SLA requirements ensures that high-priority applications receive preferential treatment, maintaining SLA compliance.
- SLA Reporting and Documentation: SD-WAN visibility tools offer detailed reporting capabilities, providing evidence of SLA compliance. Regular SLA reports can be shared with stakeholders, providing transparency and accountability.
- Historical Data Analysis: Historical data collected through SD-WAN visibility enables trend analysis and capacity planning. By understanding past performance, administrators can make data-driven decisions to optimize the network and meet future SLA demands.
- Validation of Service Provider Claims: With SD-WAN visibility, organizations can validate service provider claims regarding network performance and SLA adherence. This ensures that the service provider delivers as promised.
- SLA Performance Verification: In multi-vendor or hybrid network environments, SD-WAN visibility helps verify SLA performance across various network segments and service providers.
- SLA Penalty Avoidance: Failure to adhere to SLAs can result in penalties or contractual consequences. SD-WAN visibility minimizes the risk of SLA breaches and associated penalties by empowering administrators to maintain performance and service levels.
- Customer Satisfaction and Business Reputation: Meeting SLA commitments leads to improved customer satisfaction and reinforces the service provider's reputation. Positive customer experiences enhance business relationships and can lead to potential business growth through word-of-mouth referrals.
In conclusion, SD-WAN visibility is a critical enabler for monitoring and adhering to SLAs. By providing real-time insights, proactive issue detection, and historical data analysis, SD-WAN visibility empowers organizations to optimize network performance, meet SLA requirements, and deliver exceptional user experiences. Adhering to SLAs not only ensures customer satisfaction but also strengthens the service provider's credibility and competitiveness in the market.
Learn about SLA monitoring & reporting using Network Monitoring to measure network, service performance, user experience & understand if SLAs are being met.
Learn more

Continuous improvement is vital for maintaining an efficient and effective SD-WAN deployment. As networks evolve and user requirements change, it's essential to regularly review and optimize SD-WAN visibility strategies to ensure that the network continues to meet business objectives. Here are some best practices for achieving continuous improvement in SD-WAN visibility:
- Regular Performance Reviews: Conduct periodic performance reviews of the SD-WAN deployment to identify areas that require improvement. Assess network performance, application responsiveness, and user experience to gauge the effectiveness of the current visibility and monitoring setup.
- Identify Gaps in Visibility: Identify any gaps or blind spots in the current SD-WAN visibility. Determine if there are critical metrics or specific network segments that need additional monitoring for better insights.
- Feedback from Stakeholders: Gather feedback from various stakeholders, including end-users, IT teams, and business managers. Their insights can highlight pain points and help prioritize improvements that directly impact the user experience and business operations.
- Benchmarking and Comparisons: Continuously benchmark SD-WAN performance against industry best practices and competitors' networks. This exercise provides valuable insights into the relative strengths and weaknesses of the deployment.
- Keep Up with Technological Advancements: Stay up-to-date with the latest SD-WAN technologies, monitoring tools, and network monitoring best practices. Embrace new innovations that can enhance visibility and network management.
- Continuous Training and Skill Development: Ensure that the IT and network teams have the necessary skills and training to effectively manage and optimize SD-WAN visibility tools. Ongoing education keeps the team equipped with the latest knowledge and techniques.
- Agility in Adaptation: Be prepared to adapt to changing network requirements and business needs. Rapidly adjust visibility strategies to accommodate evolving traffic patterns, new applications, and expanding user bases.
- Collaboration Across Teams: Foster collaboration between network administrators, IT teams, and business stakeholders. An integrated approach allows for more comprehensive visibility and ensures that the network aligns with business goals.
- Automated Remediation: Integrate automation for issue remediation, such as automatic traffic rerouting or dynamic QoS adjustments. Automation reduces response time to network events and minimizes the impact of potential issues.
- Analytics-Driven Insights: Leverage advanced analytics and machine learning to derive actionable insights from historical and real-time data. Data-driven decision-making enables more proactive optimization of SD-WAN visibility.
- Documentation and Change Management: Maintain comprehensive documentation of changes made to the SD-WAN visibility strategies. Implement proper change management procedures to ensure accountability and avoid unintended disruptions.
- Periodic Assessments: Conduct regular assessments of the visibility infrastructure's scalability and capacity to handle increasing network demands. Scaling the infrastructure in line with business growth is crucial for maintaining performance.
By continuously reviewing and optimizing SD-WAN visibility strategies, organizations can ensure that their network operates at peak performance, delivers exceptional user experiences, and remains agile enough to adapt to future challenges and opportunities. Implementing feedback mechanisms and embracing a culture of continuous improvement creates a dynamic and robust SD-WAN ecosystem that contributes to overall business success.

SD-WAN networks are the future for businesses running large, multi-site networks. Although they promise exceptional network performance, getting end-to-end SD-WAN visibility is important for ensuring your SD-WAN network performs as promised by the SLA.
Your Service Provider isn’t your monitoring tool, and neither are your users. Monitoring your SD-WAN network gives you the visibility you need to identify performance issues your Service Provider can’t see, before your users experience them.
Throughout this blog post, we explored the key factors contributing to improved SD-WAN visibility. By identifying essential SD-WAN components, customizing dashboards, analyzing historical data, and addressing multi-vendor challenges, organizations can proactively address network issues and make data-driven decisions to optimize their SD-WAN deployment.
To take your SD-WAN visibility to the next level and ensure a seamless, high-performance network, leverage Obkio's Network Monitoring and SD-WAN Monitoring solutions. Obkio offers a powerful, user-friendly platform that provides real-time and historical insights into your SD-WAN network, helping you identify bottlenecks, ensure QoS compliance, and enhance user experiences.
Monitor all SD-WAN networks like:
Don't wait to elevate your SD-WAN visibility! Embrace the power of Obkio's monitoring tools and gain full control over your SD-WAN deployment.
Whether your business is planning an SD-WAN migration, or have already been using SD-WAN for years:


 Obkio Blog


