Table of Contents
Table of Contents
Welcome, network admins and IT pros, to a world where network bottlenecks become nothing more than a distant memory. In an era where the need for speed is paramount, identifying and eliminating network bottlenecks is the key to achieving warp-speed connectivity.
Your network is like a bustling metropolis, with data zipping through its veins like cars on a busy highway. But suddenly, the flow slows down to a snail's pace, causing frustration and hindering productivity. You find yourself wondering, "What's causing this bottleneck, and how can I put an end to it?"
This blog post is your ultimate guide to unveiling the mysteries of network bottlenecks. We’ll delve into the intricacies of network performance, equip you with the tools to identify bottlenecks and empower you to reclaim the lost speed and efficiency of your network.
Whether you oversee a vast corporate network, manage a data center, or troubleshoot network issues daily, this blog post is tailored to your needs. Prepare to delve into the world of network bottlenecks and unleash the full potential of your network.
Network bottlenecks are obstacles or points of network congestion within a computer network that hinder the smooth and efficient flow of data. They occur when the available network resources, such as bandwidth, processing power, or memory, are unable to accommodate the volume of data being transmitted, resulting in a slowdown or degradation of network performance.
Think of a bottleneck as a narrow point in a highway where traffic becomes congested, causing delays for all the vehicles trying to pass through. Similarly, in a network, bottlenecks restrict the flow of data, leading to increased latency, reduced throughput, and potentially impacting the overall user experience.


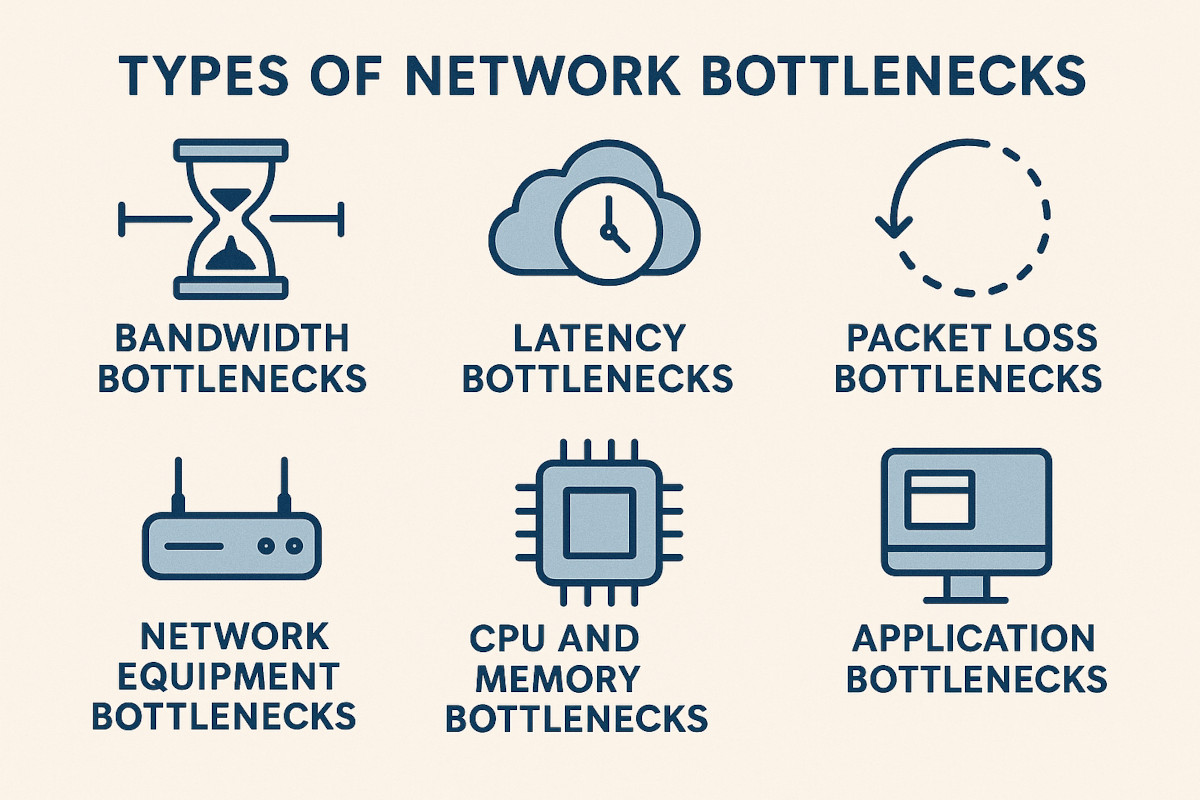
There are several different types of network bottlenecks that can occur within a network infrastructure. Some common types include:
- Bandwidth Bottlenecks: These occur when the available bandwidth on a network link is insufficient to handle the volume of data being transmitted, leading to congestion and reduced performance.
- Latency Bottlenecks: Latency refers to the delay in transmitting data packets across a network. Latency bottlenecks occur when there are delays in data transmission, resulting in slow response times and poor application performance.
- Packet Loss Bottlenecks: Packet loss happens when data packets fail to reach their destination. Packet loss bottlenecks occur when a significant number of packets are lost, leading to data retransmissions and degraded performance.
- Network Equipment Bottlenecks: This type of bottleneck occurs when the network devices, such as routers, switches, or firewalls, are unable to process data at the required speed, causing a bottleneck in the network flow.
- CPU and Memory Bottlenecks: Network devices have finite processing capabilities, and when their CPU or memory resources are overwhelmed by the volume of traffic or complex operations, it can result in bottlenecks that impact overall network performance.
- Application Bottlenecks: Application-specific bottlenecks can occur when certain applications or services consume excessive network resources, monopolizing bandwidth or introducing delays that affect other applications or users.
It's important to identify the specific type of bottleneck affecting your network to implement targeted solutions and optimize performance. By understanding these different types, network administrators can effectively troubleshoot and resolve performance issues for a smooth and efficient network experience.
Network bottlenecks generally happen at predictable locations within your infrastructure. Understanding these constraint points helps you monitor effectively and prevent performance issues before they impact users.
NICs serve as the gateway between devices and your network, often creating the first bottleneck. NIC bottlenecks are often caused by:
- Outdated interface speeds (100 Mbps or 1 Gbps NICs on high-throughput devices)
- Half-duplex configurations limiting bidirectional communication
- Driver issues causing packet processing delays
- Multiple VMs sharing a single physical NIC
- Insufficient buffer memory or processing capability
Network devices process every packet traversing your network. When these reach capacity, entire segments suffer.
Router bottlenecks:
- CPU utilization consistently above 70-80%
- Large routing tables requiring excessive processing time
- NAT port exhaustion
- Exceeding packet-per-second specifications
Switch bottlenecks:
- Backplane saturation when aggregate traffic exceeds internal capacity
- Uplink congestion (example: 48 × 1 Gbps ports with only 10 Gbps uplinks)
- Broadcast storms overwhelming processing
- Insufficient packet buffering causing drops
Firewall bottlenecks:
- Deep packet inspection (DPI) examining packet contents
- Complex rule sets requiring sequential evaluation
- SSL/TLS decryption consuming processing power
- Intrusion prevention adding latency
Physical connections represent hard bandwidth limits that cause immediate congestion when exceeded.
Wired connection issues:
- Cable category constraints (Cat5e vs. Cat6a vs. Cat7)
- Distance limitations and physical damage
- Electromagnetic interference on unshielded cables
- Fiber type mismatches or contaminated connectors
Wireless bottlenecks:
- Channel congestion from competing networks
- Half-duplex shared medium (devices taking turns)
- Legacy clients (802.11g) slowing modern networks
- Distance, obstacles, and signal degradation
WAN connection constraints:
- Insufficient ISP bandwidth for current demand
- Asymmetric upload/download speeds
- ISP oversubscription and peering point congestion
- Last-mile technology limitations (DSL, cable, fiber)
Servers with excellent connectivity still bottleneck when internal resources can't process requests fast enough.
Server resource constraints:
- CPU: Application processing, encryption overhead, inefficient code
- Memory: Insufficient RAM forcing disk swapping, memory leaks
- Storage I/O: Disk IOPS limitations, database query performance
- Network stack: OS buffer limitations, TCP window issues, connection exhaustion
Application-level bottlenecks:
- Single-threaded applications unable to use multiple cores
- Database connection limits
- Inefficient algorithms (O(n²) operations)
- Synchronous processing blocking parallelization
- Poor caching strategies
Cloud environments introduce unique bottleneck considerations through shared resources and virtualization overhead.
Virtual machine limitations:
- vCPU allocation sharing physical cores
- Memory overcommitment
- Virtual NIC software overhead
- Storage IOPS quotas by tier
- Per-instance bandwidth caps
Cloud network constraints:
- Multi-tenancy competing on shared hardware
- Regional capacity limitations
- Inter-region bandwidth restrictions
- VPN throughput limits
- Egress traffic restrictions
One bottleneck sets off a chain reaction: traffic starts rerouting, applications time out, your phone won't stop ringing with complaints, and you're making panicked changes hoping something sticks. It's exhausting and risky.
The fix? Monitor these bottleneck hotspots consistently. Instead of reacting to disasters, you'll spot issues early and handle them during normal business hours. Way less stressful, way more professional.
Ready to supercharge your network performance and conquer bottlenecks? Look no further! Discover the power of Obkio's Network Performance Monitoring tool today.
Obkio offers a comprehensive solution designed specifically for network administrators and IT professionals like you. With Obkio, you gain real-time visibility into your network, allowing you to effortlessly identify and resolve bottlenecks that impede your network's performance.
Don't let bottlenecks hold your network back any longer. Experience the power of Obkio's Network Performance Monitoring tool and unlock the full potential of your network.
- 14-day free trial of all premium features
- Deploy in just 10 minutes
- Monitor performance in all key network locations
- Measure real-time network metrics
- Identify and troubleshoot live network problems

Understanding the causes of network bottlenecks is crucial for network administrators and IT pros looking to identify network bottlenecks and optimize network performance. Identifying the root causes behind these bottlenecks is the first step toward resolving them and ensuring smooth data transmission throughout the network.
So, let's dive in and uncover the factors that can slow down even the most robust network infrastructures.
- Insufficient Bandwidth: One of the most common causes of network bottlenecks is inadequate bandwidth. When the available bandwidth cannot support the volume of data being transmitted, congestion occurs, leading to slower network speeds and reduced performance.
- Network Congestion: High levels of network traffic can result in congestion and subsequent bottlenecks. This can happen during peak network usage times or when multiple devices are competing for limited network resources.
- Misconfigured Network Devices: Improperly configured routers, switches, or firewalls can contribute to network bottlenecks. For example, if a network switch is not properly set up to handle the traffic load, it can become a bottleneck for data transmission.
- Hardware Limitations: Outdated or underpowered network equipment may not be capable of handling the increasing demands of modern networks. For instance, network interface cards (NICs) with lower data transfer rates can restrict the overall network performance.
- Network Protocol Issues: Inefficient or outdated network protocols can cause bottlenecks. Protocols that involve excessive overhead or have limitations in handling concurrent connections can impact network performance.
- Network Security Measures: While essential for protecting network assets, robust security measures such as firewalls, intrusion detection systems, and encryption can introduce processing delays and increase the workload on network devices, potentially leading to bottlenecks.
- Network Topology: The design and structure of the network can contribute to bottlenecks. For example, if multiple devices are connected to a single network switch or if network segments are improperly configured, it can result in congestion and limited data flow.
- Software or Application Issues: Inefficient or poorly optimized software applications can generate excessive network traffic or place a heavy load on network resources, leading to bottlenecks.
Network bottlenecks don't announce themselves—they require systematic detection using the right tools and methodologies. Below are six proven techniques that network administrators use to pinpoint performance issues before they impact users.
Network monitoring tools are your first line of defense against bottlenecks. These solutions continuously collect and analyze real-time performance data across your entire infrastructure.
Key metrics to track:
- Bandwidth utilization and saturation points
- Latency spikes and patterns
- Packet loss rates
- Network utilization trends
- Traffic flow patterns across segments

By establishing continuous monitoring, you'll spot congestion as it develops rather than after users complain. Modern network monitoring tools provide dashboards that visualize these metrics, making bottleneck identification intuitive and actionable.
Traffic analysis reveals what's consuming your bandwidth and where congestion originates. Using packet capture and deep packet inspection tools, you can examine the actual flow of data through your network.
Red flags to investigate:
- Unusual traffic volume from specific sources or destinations
- High-frequency retransmissions indicating packet loss
- Asymmetric traffic flows suggesting one-way congestion
- Extended response times on critical paths
- Broadcast storms or multicast floods
Traffic analysis works best when combined with network utilization monitoring—together they show not just how much bandwidth you're using, but how efficiently you're using it.
Bandwidth tests measure your network's actual throughput against its theoretical capacity. Discrepancies between expected and measured bandwidth often point directly to bottlenecks.
Testing best practices:
- Run tests during both peak and off-peak hours
- Test multiple network paths and segments
- Use consistent testing tools for accurate comparisons
- Document results to track degradation over time
- Test bidirectional throughput (upload and download)
A network segment advertising 1 Gbps capacity but delivering only 300 Mbps during normal operations signals a clear bottleneck requiring investigation.
Your network's physical and logical design directly impacts performance. Bottlenecks often hide in poorly planned network architecture.
Architecture elements to assess:
- Connection points: Are multiple high-traffic devices funneling through a single switch port?
- Network hierarchy: Do bottlenecks exist at aggregation or core layers?
- VLAN segmentation: Is broadcast traffic properly isolated?
- Redundancy gaps: Are there single points of failure creating congestion?
- Traffic flows: Does your design match actual usage patterns?
Network segmentation analysis reveals whether your topology supports your traffic demands or inadvertently creates choke points.
Network bottlenecks aren't always about bandwidth—sometimes the devices themselves become the constraint. Routers, switches, firewalls, and servers have finite processing capabilities.
Critical resources to monitor:
- CPU utilization: Consistently above 70-80% indicates processing bottlenecks
- Memory usage: Memory exhaustion causes packet drops and processing delays
- Buffer utilization: Full buffers force packet queuing or dropping
- Interface statistics: Track errors, discards, and queue depths
- Backplane capacity: Ensure switches can handle aggregate throughput

When a device operates at capacity, it becomes a bottleneck regardless of available bandwidth on the network links.
Baselines define "normal" for your network, making anomalies immediately obvious. Without baselines, you're troubleshooting blind—reacting to problems without context.
How to create effective baselines:
- Monitor during stable, representative periods (avoid holidays or unusual events)
- Capture metrics for at least 2-4 weeks to account for weekly patterns
- Document application-specific performance expectations
- Update baselines quarterly or after infrastructure changes
- Set alert thresholds based on baseline deviations (e.g., 20% above normal)
When current performance diverges significantly from your baseline, you've identified a bottleneck or degradation that requires immediate investigation.
The most effective bottleneck identification strategy uses multiple techniques simultaneously. Network monitoring tools provide continuous oversight, while periodic bandwidth tests and traffic analysis offer deeper diagnostic capabilities when issues arise.
Ready to implement these techniques? Obkio's network performance monitoring platform combines all six methods in a single solution, giving you comprehensive visibility into every potential bottleneck across your infrastructure.
Avoid the network traffic jam! Learn what network congestion is, what causes it, and most importantly, how to fix it using Network Monitoring tools.
Learn more

Identifying network bottlenecks often requires a combination of these methods, as well as a thorough understanding of your network infrastructure and its normal operating conditions. And the best part is - there’s a tool that can identify network bottlenecks for you, using all the strategies we talked about above.
That’s where Obkio’s Network Monitoring Tool comes into play.
Let’s get into the step-by-step guide on how to identify network bottlenecks using easy Network Performance Monitoring.
Say goodbye to the frustration of slow connections and hello to blazing-fast speeds. By proactively monitoring your network with Obkio’s synthetic, end-to-end Network Performance Monitoring tool, you can pinpoint bottlenecks with precision and take swift action to optimize your network's efficiency.
To identify network bottlenecks in all network locations, Obkio continuously monitors end-to-end network performance so you can monitor performance from your local network (LAN, VPN), as well as third-party networks (WAN performance, ISP, and Internet Peering).
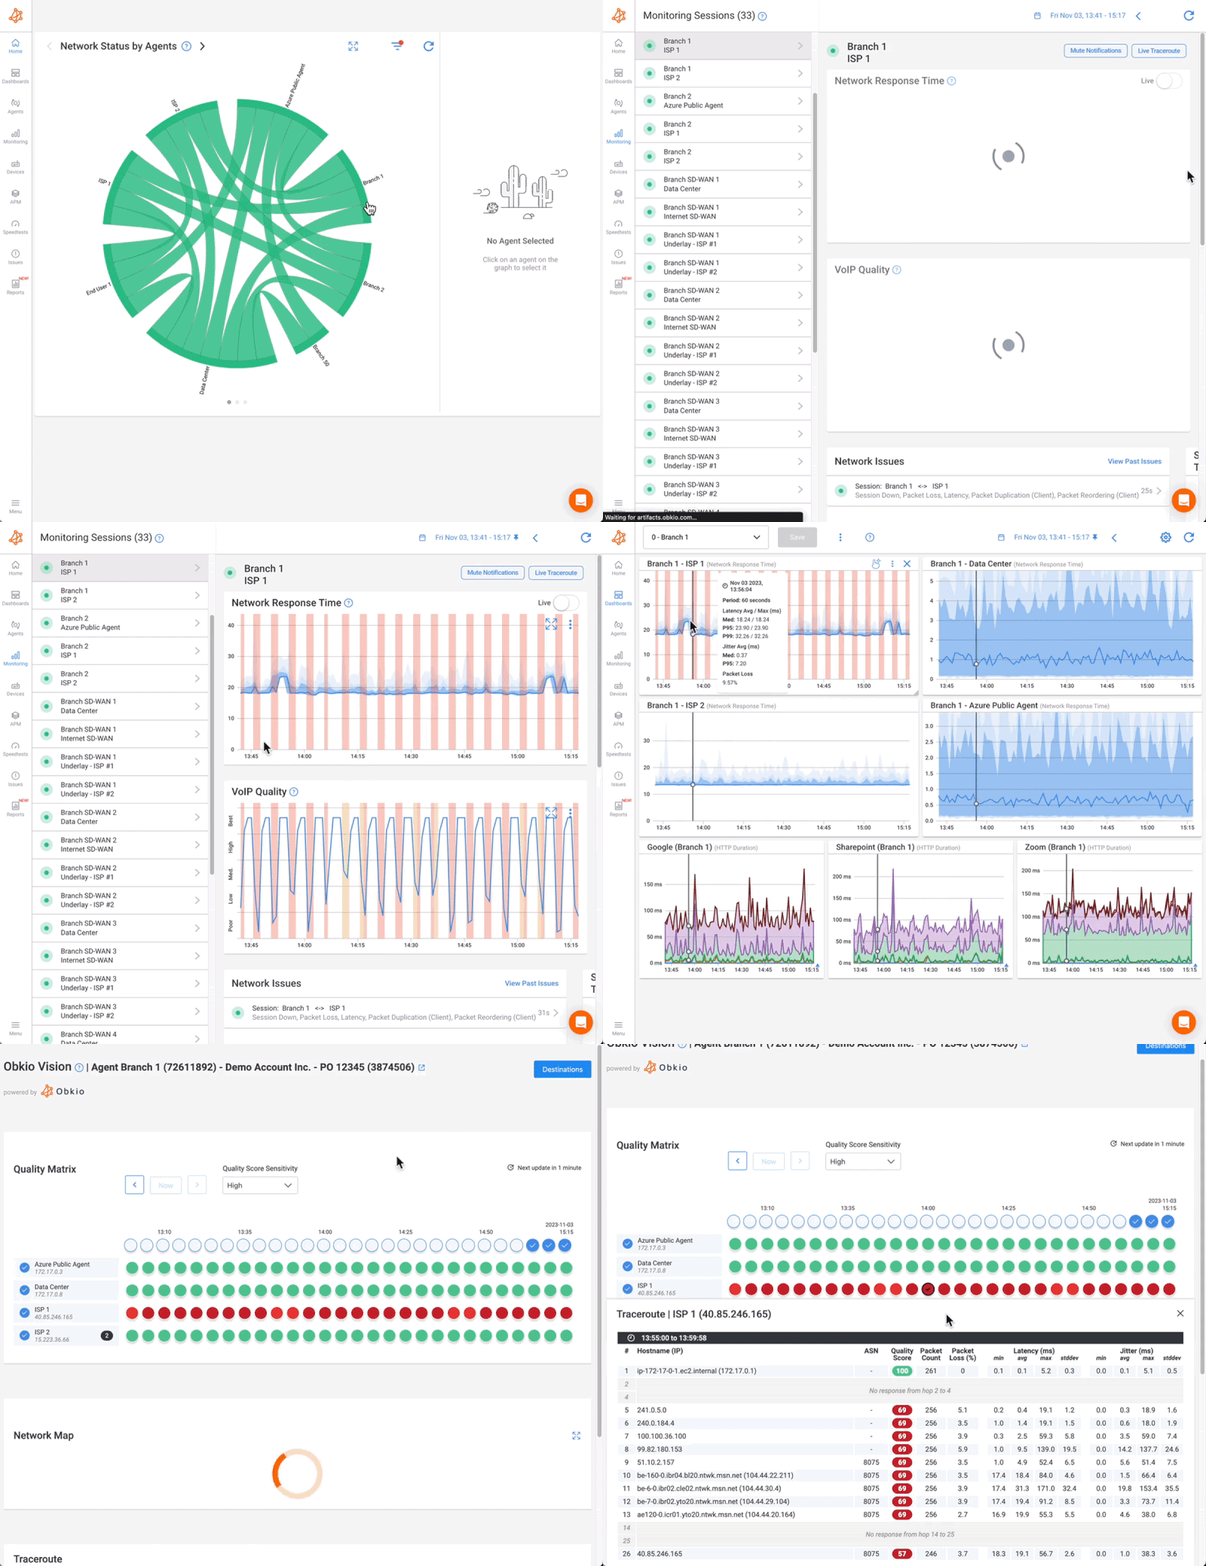
Unlike traditional network monitoring solutions that may only monitor local network equipment, Obkio allows you to monitor performance from every end of your network, where you may not have any IT staff or equipment available.

Obkio monitors network performance and identifies network issues using synthetic traffic using Network Monitoring Agents. Agents are deployed in key network locations, like offices, clouds, data centers, and over the Internet, to measure network metrics, identify network problems (like network bottlenecks) and collect the information to help you troubleshoot.
- Local Agents: Installed in the targeted office locations where you want to monitor network performance and identify network bottlenecks. There are several Agent types available (all with the same features), and they can be installed on MacOS, Windows, Linux and more.
- Public Monitoring Agents: Deployed over the Internet and managed by Obkio. They compare and test network performance up to the Internet and quickly identify if the network bottleneck is global or specific to the destination. This will be great information for later in the troubleshooting process. You can use an AWS or Google Cloud Agent.
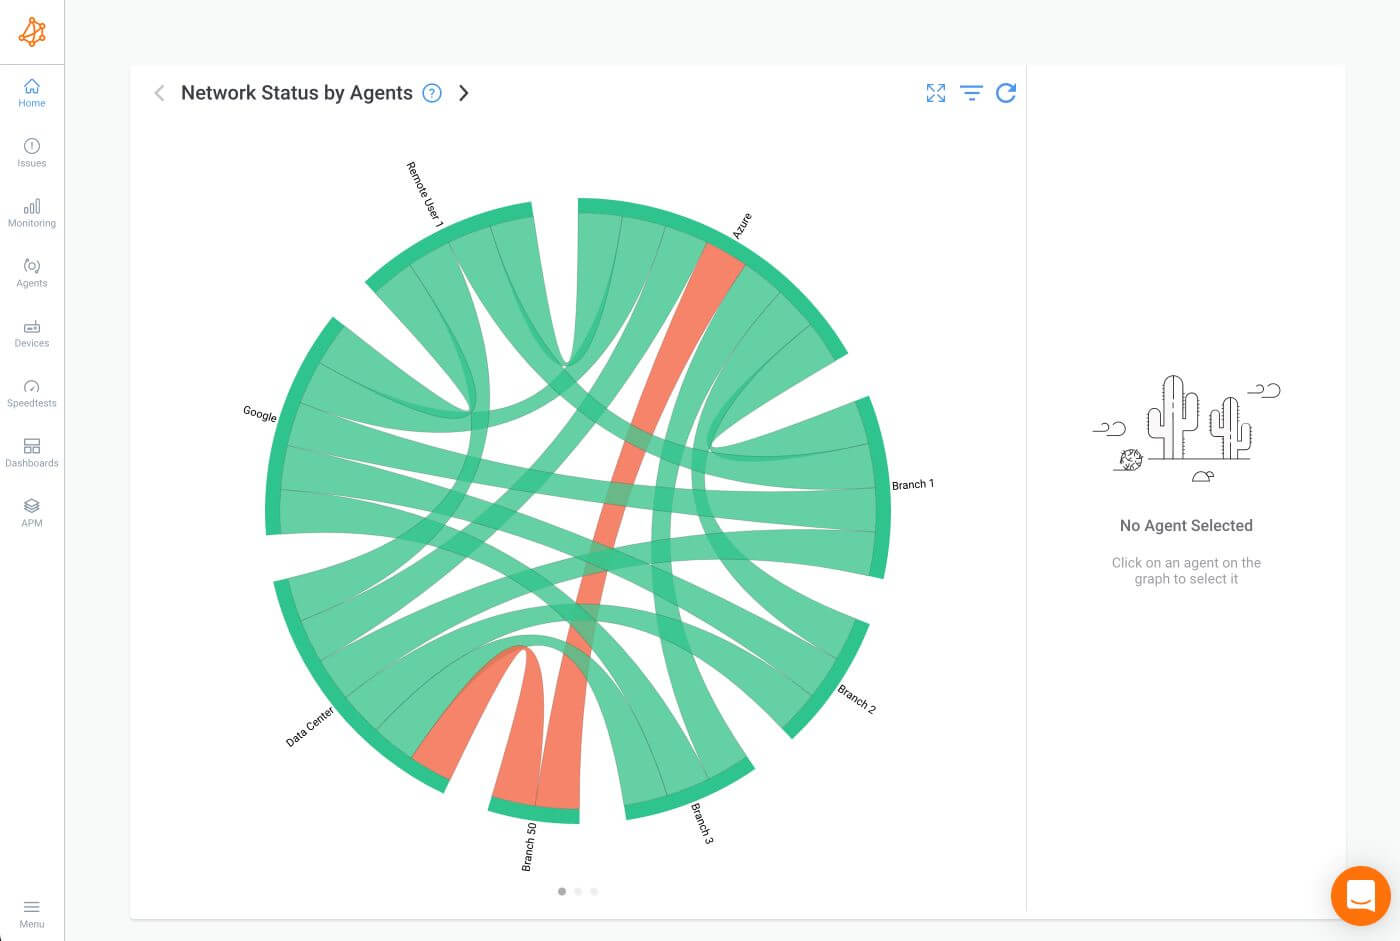
Using the Monitoring Agents, you can monitor the performance of specific network paths or connections between network devices. This allows you to identify bottlenecks in specific links or routes within your network. By monitoring the latency, packet loss, and other metrics for these paths, you can isolate and address any performance issues.
Once your Monitoring Agents are deployed, they will begin continuously exchanging synthetic traffic to measure network performance and identify network issues like bottlenecks.
Using Obkio's synthetic testing capabilities, you can leverage the tool to perform automated network tests that include bandwidth tests and latency tests. These tests simulate traffic patterns and measure the performance of your network under controlled conditions. By running these tests regularly, you can establish performance baselines that represent the expected network performance.
Performance baselines serve as reference points against which you can compare current measurements. By comparing the current network performance to the established baselines, you can quickly detect any degradation or bottlenecks in network performance.
Bandwidth tests allow you to measure the available bandwidth on your network. By generating synthetic traffic and measuring the time it takes for data to transfer between two points, you can accurately assess the bandwidth capacity of your network. Comparing the results of bandwidth tests over time helps you identify any significant decreases in available bandwidth, indicating a potential bottleneck.
Latency tests, on the other hand, measure the round-trip time it takes for data to travel from a source to a destination and back. By simulating network traffic and monitoring the latency of these packets, you can identify delays and fluctuations in network performance. Comparing the latency measurements obtained during tests to the established baselines helps you identify any abnormal latency patterns or bottlenecks that may be affecting network responsiveness.
By regularly running these automated network tests and comparing the results to performance baselines, you can gain insights into the health and performance of your network. Deviations from the established network baselines can alert you to potential bottlenecks or performance issues that require further investigation.
This proactive approach allows you to address network bottlenecks promptly and optimize your network's performance for improved efficiency.
Continuing from the previous step, you can identify network bottlenecks by measuring network metrics!
It's easy to detect bottlenecks when they’re happening with your own network equipment, but you’re not always using your own equipment. Some businesses may be using their ISPs or MSPs’ network equipment, so they don't have direct access to the network equipment’s data.
Additionally, the network bottlenecks may not be actually happening in your own network, but maybe in your ISP’s network, on the local loop of its connection or even on the Internet. But, you can still identify network bottlenecks by monitoring other core network metrics!
To identify network bottlenecks, monitoring specific network metrics is crucial. Here are key network metrics that you should monitor:
- Bandwidth Utilization: Monitor the usage of available bandwidth in your network. High levels of bandwidth utilization, especially nearing or reaching maximum network capacity, can indicate potential bottlenecks and congestion points.
- Latency: Measure latency, aka, the time it takes for data packets to travel from one point to another. High latency values can suggest network bottlenecks or delays in data transmission.
- Packet Loss: Measure packet loss rate within your network. Excessive packet loss can be a sign of network congestion or unreliable connections, both of which can contribute to bottlenecks.
- Jitter: Jitter refers to the variation in latency over time. It can cause disruptions in real-time applications like VoIP or video conferencing. Measuring jitter levels helps identify inconsistencies in network performance that may indicate potential bottlenecks.
- Throughput: Measure the amount of data transferred over the network within a given time frame. Monitoring network throughput helps identify if the network is reaching its maximum capacity and potential bottlenecks due to limited data transfer capabilities.
- Error Rates: Keep an eye on error rates such as CRC errors or retransmission rates. High error rates suggest issues with data integrity and can be indicative of network bottlenecks or transmission problems.
By consistently monitoring these network metrics, you can gain valuable insights into the performance of your network and detect any bottlenecks or areas of concern. It's important to establish baseline values for these metrics during normal network operation to easily identify deviations and take proactive measures to optimize network performance.
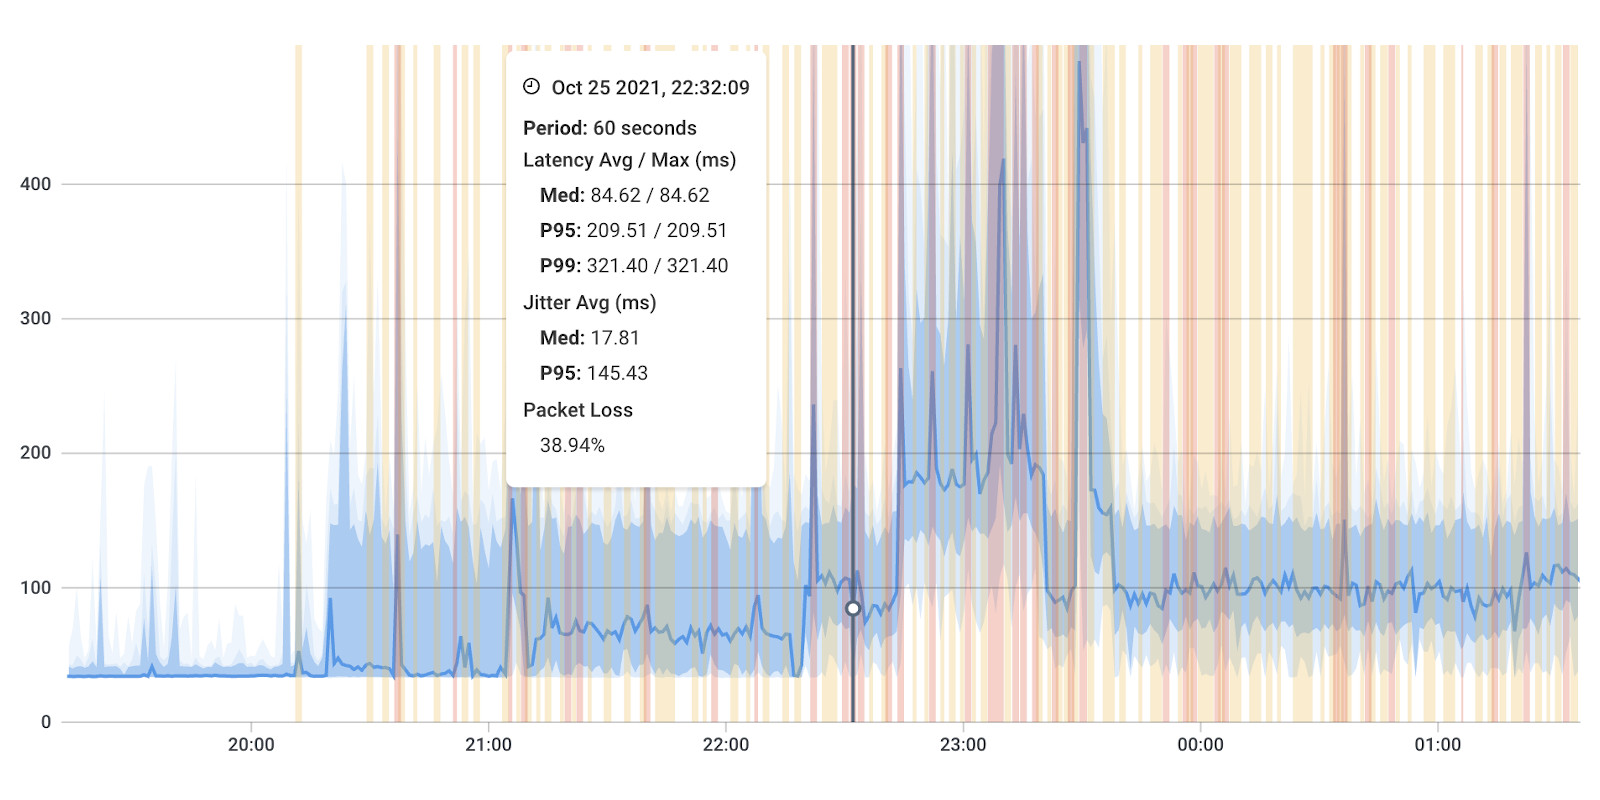

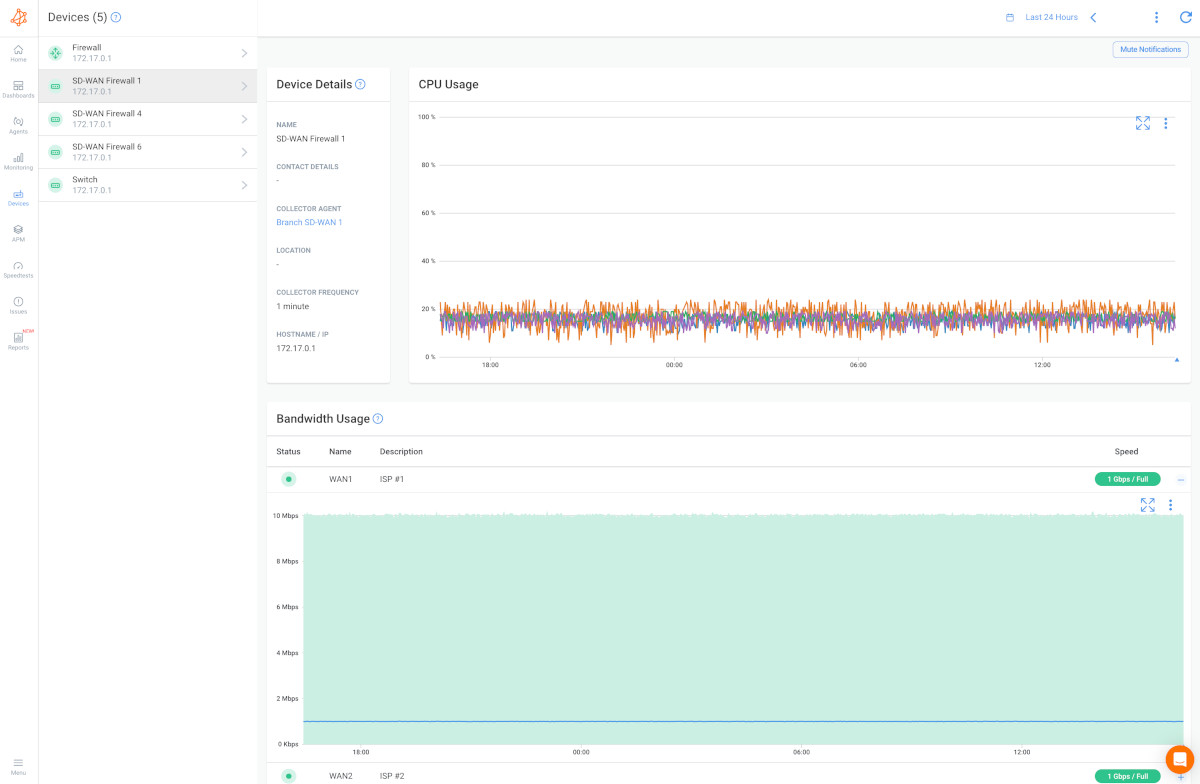
Obkio enables you to monitor the resources of your network devices, such as routers and switches. By measuring CPU usage, memory utilization, and other device-level metrics, you can identify devices that may be operating at their limits or experiencing performance bottlenecks due to resource constraints.
Monitoring network devices is important for identifying network bottlenecks because devices play a crucial role in network performance.

- Device Resource Utilization: Network devices such as routers, switches, and firewalls have limited resources like CPU, memory, and network interfaces. Monitoring the resource utilization of these devices helps identify if they are operating near their capacity or experiencing performance limitations. High resource utilization can indicate potential bottlenecks where devices are struggling to handle the network traffic efficiently.
- Device Misconfigurations: Misconfigurations in network devices can lead to bottlenecks. By monitoring device configurations and performance metrics, you can identify if a device is improperly configured or if there are configuration issues causing performance degradation. Correcting these misconfigurations can alleviate bottlenecks and optimize network performance.
- Device Failures or Malfunctions: Network devices are prone to failures or malfunctions, which can introduce bottlenecks in the network. By monitoring device health and status indicators, you can quickly identify if a device is experiencing issues that may impact network performance. Promptly addressing device failures or malfunctions can prevent bottlenecks from spreading throughout the network.
- Traffic Distribution and Load Balancing: Network devices play a role in distributing traffic and network load balancing across the network. Monitoring the performance of these devices helps ensure they are evenly distributing traffic and properly balancing the load. Imbalanced traffic distribution can lead to bottlenecks in specific areas of the network. By monitoring device performance, you can identify any imbalances and take corrective actions.
Obkio's customizable alerting and notification features empower you to proactively identify network bottlenecks and take immediate action to resolve them. By defining threshold values for various network metrics, you can configure network monitoring alerts to trigger when those thresholds are exceeded.
- For example, you can set a threshold for latency, specifying the maximum acceptable latency value. If the actual latency exceeds this threshold, an alert will be triggered, notifying you of the potential bottleneck.
- Similarly, you can set thresholds for packet loss rates. If the packet loss rate exceeds the defined threshold, an alert will be generated, indicating a potential issue that requires investigation. These customizable alerts allow you to focus on the specific metrics that are most critical to your network's performance and bottlenecks.
Upon receiving an alert, you can take immediate action to investigate the bottleneck. With the information provided in the alert, you can quickly identify the affected network segment, device, or connection experiencing the performance issue. By promptly addressing the bottleneck, you can minimize its impact on network performance and prevent further degradation.
The customizable alerting and notification features of Obkio help you stay ahead of potential network bottlenecks. By proactively detecting performance anomalies based on predefined thresholds, you can respond swiftly and effectively. This proactive approach allows you to address bottlenecks before they cause significant disruptions, optimizing network performance and ensuring a smooth user experience.
When network bottlenecks occur, they can have a significant impact on network performance, affecting the speed, responsiveness, and overall efficiency of data transmission. This is why it’s so crucial for businesses to detect even the earliest signs of network bottlenecks and get to troubleshooting.
Let’s go over how network bottlenecks affect network performance in detail, focusing on the key areas where bottlenecks can cause disruptions and inefficiencies.
- Slow Data Transmission: Network bottlenecks can cause data to be transmitted at a slower rate than expected. When there is congestion or limited bandwidth in a network segment, data packets can experience delays or queues, resulting in slower data transmission. This can lead to increased latency and reduced throughput, affecting the overall performance of applications and services running on the network.
- Increased Latency: Bottlenecks can introduce additional latency, which is the time it takes for data packets to travel from the source to the destination and back. High latency can result in delays and lags in real-time applications such as VoIP (VoIP latency), video conferencing, and online gaming. Users may experience audio and video synchronization issues, communication delays, or unresponsiveness due to the increased time it takes for data to reach its destination.
- Packet Loss: Network bottlenecks can contribute to packet loss, where data packets fail to reach their intended destination. When network resources are overwhelmed, packets may be dropped to alleviate congestion. Packet loss can degrade the quality of data transmission and result in incomplete or distorted data, leading to retransmissions and reduced efficiency in transmitting information across the network.
- Performance Degradation: Network bottlenecks can lead to overall performance degradation across the network. As bottlenecks restrict the flow of data, network resources may be underutilized or not fully optimized. This can impact the responsiveness of applications, slow down file transfers, cause buffering issues in streaming services, and reduce the overall productivity and efficiency of network-dependent operations.
- Limited Scalability: Bottlenecks can limit the scalability of the network, preventing it from efficiently handling increased traffic or growth. As network demands increase, bottlenecks can restrict the network's ability to accommodate additional users, devices, or data volume. This can impede business expansion, hinder the adoption of new technologies, and limit the network's capacity to handle future growth.
- Unpredictable Performance: Network bottlenecks can cause performance fluctuations and unpredictability. As bottlenecks can occur in different parts of the network or at different times, the network's performance may vary inconsistently. This can lead to intermittent connectivity issues, sporadic slowdowns, and an overall unstable user experience.
Monitoring network performance to proactively identify network bottlenecks is the most effective way to stop network bottlenecks from affecting your business, network and user experience. To go a step further, you also need to troubleshoot.
How to measure bandwidth, identify issues & optimize network performance. Use Obkio's Network Performance Monitoring tool for easy bandwidth monitoring.
Learn more

Network bottlenecks don't resolve themselves—they demand systematic troubleshooting and targeted solutions. When performance degrades, follow this proven eight-step framework to quickly identify root causes and restore optimal network performance.
No. While symptoms may temporarily disappear, the underlying constraint remains until you actively address it.
You might experience temporary relief when:
- Traffic naturally decreases during off-peak hours
- Users abandon problematic applications out of frustration
- Automated load balancing shifts workloads to less congested paths
- Bandwidth-intensive transfers complete
These scenarios merely mask the problem. Without proper remediation—capacity upgrades, configuration optimization, or architectural improvements—bottlenecks will resurface during the next traffic spike, potentially with greater impact.
You cannot fix what you cannot see. Real-time visibility forms the foundation of effective bottleneck resolution.
Implement network monitoring tools like Obkio that provide:
- Continuous performance tracking across all network segments
- Real-time alerting when metrics exceed normal thresholds
- Historical data analysis to identify patterns and trends
- Detailed diagnostics pinpointing exact bottleneck locations
- Automated reporting for documentation and capacity planning

Network monitoring solutions detect bottlenecks the moment they emerge, often before users notice performance degradation. This proactive approach transforms reactive firefighting into strategic network management.
There are some key metrics that reveal network bottlenecks. Monitor them to track any changes in network performance:
Bandwidth utilization: Track consumption across all links. Sustained utilization above 70-80% indicates capacity constraints requiring immediate attention.
Latency measurements: Monitor round-trip times for critical paths. Sudden increases or consistently high latency (>100ms for LAN, >150ms for WAN) signal congestion or processing delays.
Packet loss rates: Even 1-2% packet loss severely impacts application performance. Higher rates indicate serious congestion or equipment issues.
Throughput capacity: Measure actual data transfer rates against theoretical maximums. Significant gaps reveal bottlenecks restricting flow.
Jitter variations: Inconsistent latency disrupts real-time applications like VoIP and video conferencing.
Device resource utilization: CPU, memory, and buffer usage on network equipment often precede bandwidth bottlenecks.
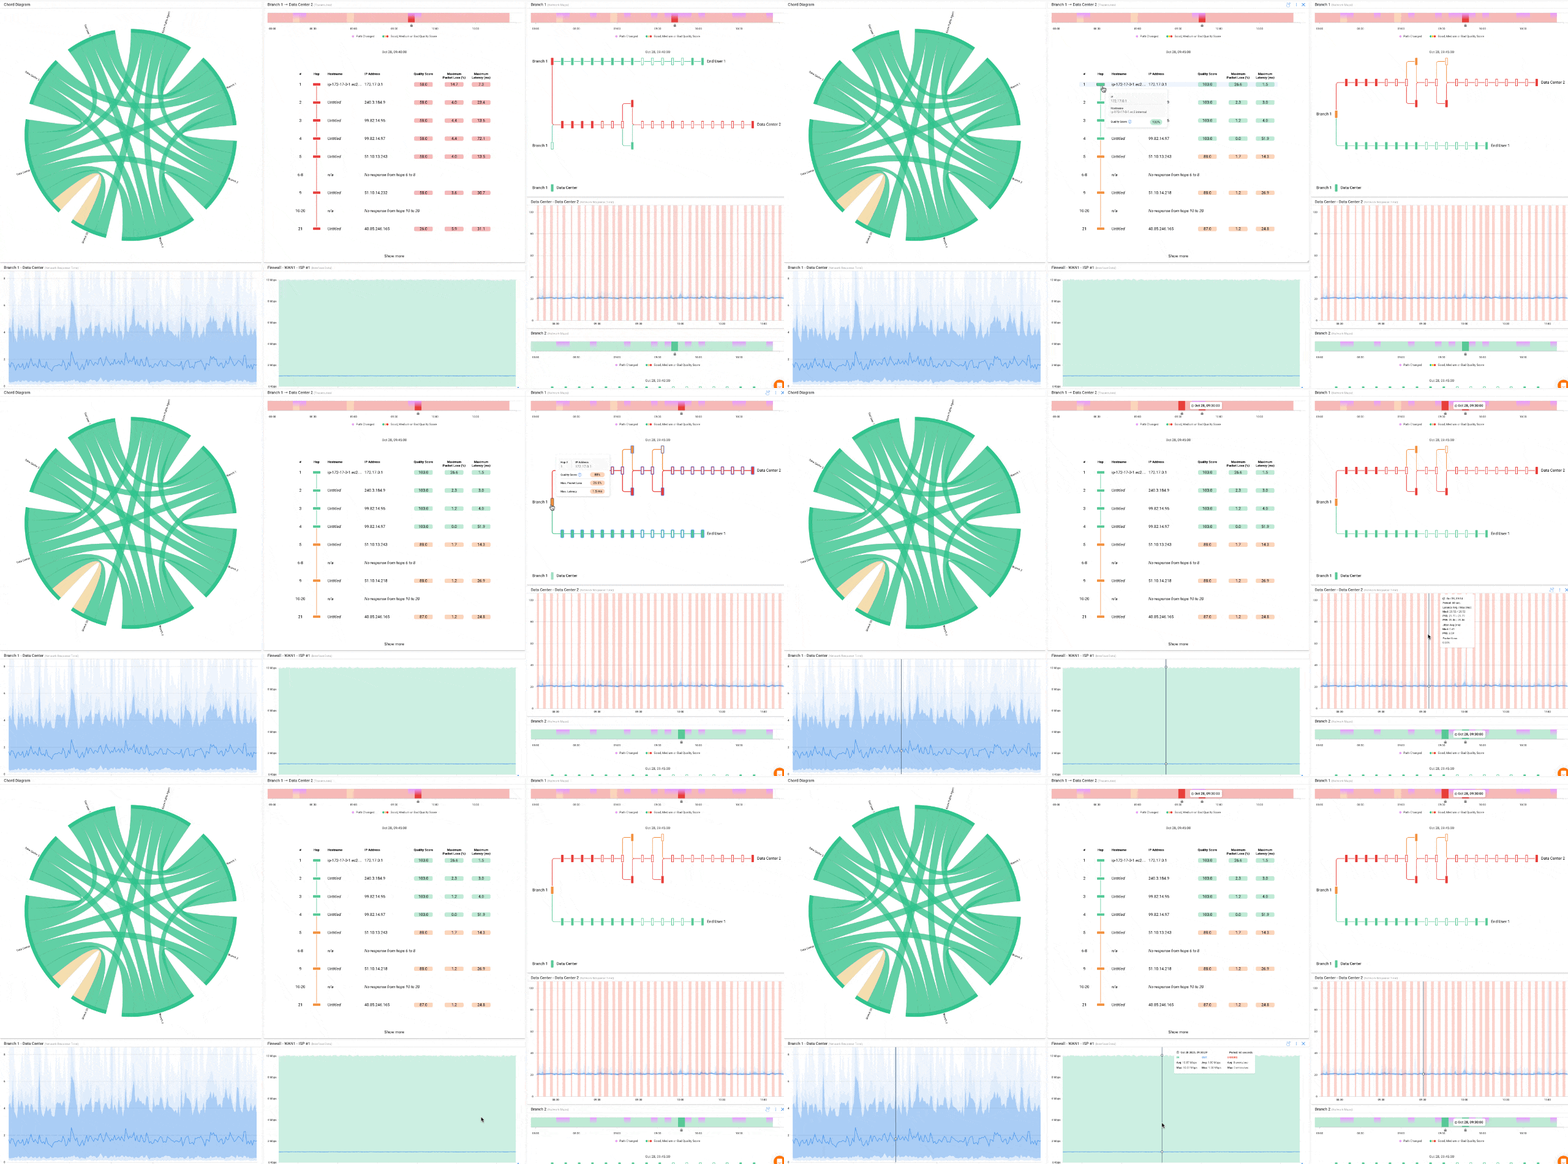
Pro tip: Don't just collect metrics—correlate them. A network bottleneck typically affects multiple metrics simultaneously. For example, high bandwidth utilization combined with increased latency and packet loss definitively indicates congestion.
Network bottlenecks hide in three primary domains. Methodically test each to determine where constraints exist.
These occur within your organization's infrastructure:
- Oversubscribed switches where multiple high-bandwidth connections converge on limited uplinks
- Underpowered routers struggling with routing table processing or packet forwarding
- Saturated WAN links between offices or data centers
- LAN congestion from broadcast storms, spanning tree issues, or design flaws
- Misconfigured VLANs creating unnecessary inter-VLAN routing overhead
Use internal monitoring agents to measure performance between key internal points. Compare metrics across different network segments to isolate the problematic area.
Performance issues often originate beyond your control:
- ISP backbone congestion during peak usage periods
- Peering point limitations where your ISP connects to other networks
- Last-mile connectivity constraints on your internet connection
- MSP network infrastructure issues affecting managed services
- Shared infrastructure where multiple customers compete for resources
Deploy your network monitoring to public endpoints or use ISP-provided monitoring agents. Compare internal performance to external benchmarks—if internal performance is excellent but external connections suffer, the bottleneck lies outside your network.
Third-party devices and connections create hidden constraints:
- Partner or vendor network equipment with insufficient capacity
- Cloud provider virtual network interfaces or security groups
- Firewall appliances at network boundaries performing deep packet inspection
- VPN concentrators overloaded with encryption processing
- Legacy equipment at customer sites or branch offices
Perform path analysis using traceroute and monitoring synthetic traffic to specific destinations. Measure performance before and after suspect devices to isolate their impact.
Configuration issues cause bottlenecks as often as capacity limitations. These are some critical configuration elements to review:
Interface settings: Verify speed/duplex settings, MTU sizes, and flow control. Auto-negotiation failures create persistent performance problems.
Routing protocols: Check for inefficient paths, routing loops, or suboptimal metric configurations forcing traffic through congested links.
Switching configurations: Review port channel settings, spanning tree priorities, and VLAN assignments. Misconfigured trunks limit available bandwidth.
Quality of Service policies: Ensure QoS markings align with actual priority requirements. Misconfigured QoS can throttle critical traffic while allowing low-priority floods.
Security policies: Firewall rules and access control lists performing unnecessary deep inspection create processing bottlenecks.
Buffer and queue sizes: Inadequate buffering causes packet drops under load. Excessive buffering introduces latency.
Best practice: Document all configuration changes in your change management system. Many bottlenecks emerge immediately after "minor" adjustments that seemed harmless at the time.
QoS transforms bottlenecks from catastrophic failures into managed constraints. When you cannot immediately eliminate a bottleneck, Quality of Service (QoS) ensures critical applications continue functioning while less important traffic waits.
Bandwidth reservation: Allocate guaranteed bandwidth to essential services. Even during congestion, priority traffic receives its reserved capacity.
Traffic classification: Identify and mark different traffic types (VoIP, video, file transfers, web browsing) so network devices can treat them appropriately.
Priority queuing: Process high-priority packets first during congestion. Real-time applications like VoIP and video conferencing bypass queues affecting bulk data transfers.
Traffic shaping: Smooth bursty traffic and prevent single applications from monopolizing bandwidth.
Policing: Enforce bandwidth limits on low-priority or problematic traffic, preventing it from overwhelming network capacity.
- Identify critical applications requiring priority treatment
- Classify traffic using DSCP markings or port-based identification
- Define priority levels matching business requirements
- Configure queuing mechanisms on all network devices
- Test and validate that policies work as intended
- Monitor QoS effectiveness and adjust policies based on actual performance
Real-world example: During a bottleneck, properly configured QoS ensures executive video conferences continue flawlessly while software updates and cloud backups temporarily slow down—priorities aligned with business needs.
Learn how to monitor QoS performance on your private network, including MPLS, SD-WAN, or VPN, using Obkio's DSCP features.
Learn more

Strategic infrastructure improvements can eliminate network bottlenecks permanently. Here are some to look into:
Current state evaluation:
- Measure CPU, memory, and throughput utilization on all network devices
- Identify equipment consistently operating above 70% capacity
- Document device age, firmware versions, and manufacturer specifications
Upgrade considerations:
- Replace devices incapable of handling current traffic loads
- Implement higher-performance models at congestion points
- Consider next-generation equipment supporting future growth (10GbE → 25/40GbE)
Link capacity analysis:
- Map all network links and their utilization patterns
- Identify over-utilized connections requiring upgrades
- Implement link aggregation (LACP) to combine multiple connections
- Consider SD-WAN for intelligent multi-path routing
Bandwidth allocation:
- Ensure symmetrical bandwidth for bidirectional applications
- Provide adequate overhead (target 50-60% average utilization)
- Plan for burst capacity during peak periods
Infrastructure validation:
- Test cable quality using certifiers and OTDR for fiber
- Replace Cat5e with Cat6a or Cat7 to support higher speeds
- Verify cable runs don't exceed distance limitations
- Check for electromagnetic interference affecting copper cabling
Physical layer optimization:
- Organize cable management to prevent signal degradation
- Label all connections for easier troubleshooting
- Document infrastructure changes in network diagrams
Topology optimization:
- Implement collapsed core designs for smaller networks
- Deploy three-tier architectures (access/distribution/core) for scalability
- Create redundant paths eliminating single points of failure
- Segment networks logically using VLANs and subnets
Traffic flow improvement:
- Position high-traffic resources closer to users
- Implement caching and content delivery for distributed access
- Use network segmentation to contain traffic within appropriate zones
Distribution strategies:
- Deploy load balancers for server farms and applications
- Implement ECMP (Equal-Cost Multi-Path) routing
- Use DNS round-robin for basic application distribution
- Configure link aggregation for increased bandwidth and redundancy
Failover planning:
- Create redundant paths for critical connections
- Implement automatic failover mechanisms
- Test failover procedures regularly
- Document recovery time objectives (RTO) and procedures
Load balancing transforms bottlenecks from single-point failures into distributed capacity.
Application load balancing - Distribute requests across multiple servers, preventing any single server from becoming a bottleneck.
Link load balancing - Spread traffic across multiple internet connections or WAN links, maximizing available bandwidth.
Geographic load balancing - Direct users to the nearest or least-loaded data center, optimizing both performance and capacity.
DNS-based load balancing - Simple round-robin or weighted distribution of traffic to multiple endpoints.
- Monitor distribution effectiveness: Ensure traffic actually balances rather than overwhelming specific paths
- Configure appropriate algorithms: Choose round-robin, least-connections, or weighted methods based on your needs
- Implement health checking: Automatically remove failed or degraded paths from rotation after network health checks
- Plan for asymmetric traffic: Account for different inbound vs. outbound traffic patterns
- Test failover scenarios: Verify load balancing continues functioning when individual components fail
Proactive testing catches bottlenecks before they impact users.
Regular network performance testing transforms reactive troubleshooting into predictive management. Obkio's continuous monitoring automatically performs these tests without manual intervention.
Initial baseline creation:
- Monitor performance during stable, representative periods
- Capture at least 2-4 weeks of data to account for weekly cycles
- Document seasonal variations (month-end processing, holiday periods)
- Record baseline metrics for all critical paths and applications
Baseline maintenance:
- Update baselines quarterly or after infrastructure changes
- Compare current performance against historical baselines
- Document deviations requiring investigation
- Adjust thresholds as network evolves
By maintaining Obkio as your permanent network performance monitoring solution, you automate this entire cycle—detecting, diagnosing, and preventing bottlenecks before they disrupt operations.
These eight steps transform network bottleneck management from crisis response into strategic optimization. The key difference between networks that constantly struggle with performance issues and those that consistently deliver excellent user experience is continuous visibility and proactive intervention.
In conclusion, identifying network bottlenecks is crucial for maintaining a high-performance network environment. By understanding the causes and effects of bottlenecks, implementing effective monitoring strategies, and utilizing appropriate troubleshooting techniques, you can ensure smooth data transmission and optimal network performance.
However, it's not enough to simply identify bottlenecks; taking proactive measures is equally important. This is where Obkio's Network Performance Monitoring tool comes into play.
With its comprehensive monitoring capabilities, automated network tests, customizable alerting features, and in-depth performance insights, Obkio empowers network admins and IT professionals to effectively identify and resolve network bottlenecks.
Don't let network bottlenecks hinder your organization's productivity and user experience.
Take action today and leverage Obkio's Network Performance Monitoring tool to optimize your network performance.
- 14-day free trial of all premium features
- Deploy in just 10 minutes
- Monitor performance in all key network locations
- Measure real-time network metrics
- Identify and troubleshoot live network problems

Remember, a well-monitored and optimized network is the backbone of seamless communication and efficient operations. Embrace the power of Obkio and unlock the true potential of your network infrastructure.


 Obkio Blog


