Table of Contents
Table of Contents
If you’ve ever been the “network person” in the room, you know how it goes: the moment something slows down or disconnects, everyone looks at you. The pressure’s on, and you need answers fast. Is it the Wi-Fi? The ISP? A misconfigured switch? Or maybe that new cloud app is hogging bandwidth?
That’s where network diagnostic tools come in. They’re not just tools to tell you if your network is up or down, they’re the difference between scrambling to guess what’s wrong and being able to pinpoint the exact issue in minutes. Relying only on basic network monitoring isn’t enough. Network Monitoring tells you that something’s wrong. Network Diagnostics tells you why.
In this article, we’ll break down what network diagnostics really mean, what network diagnostic tools do, how they work, and why every IT professional needs them in their toolkit. Whether you’re dealing with packet loss, jitter, or mysterious slowdowns, the right tool can save you hours of frustration and keep your users happy.
Network diagnostics is the process of analyzing, testing, and evaluating how a network performs in order to identify issues that affect connectivity, speed, and reliability. It’s an essential step that bridges the gap between monitoring (spotting when something is wrong) and troubleshooting (fixing the problem).
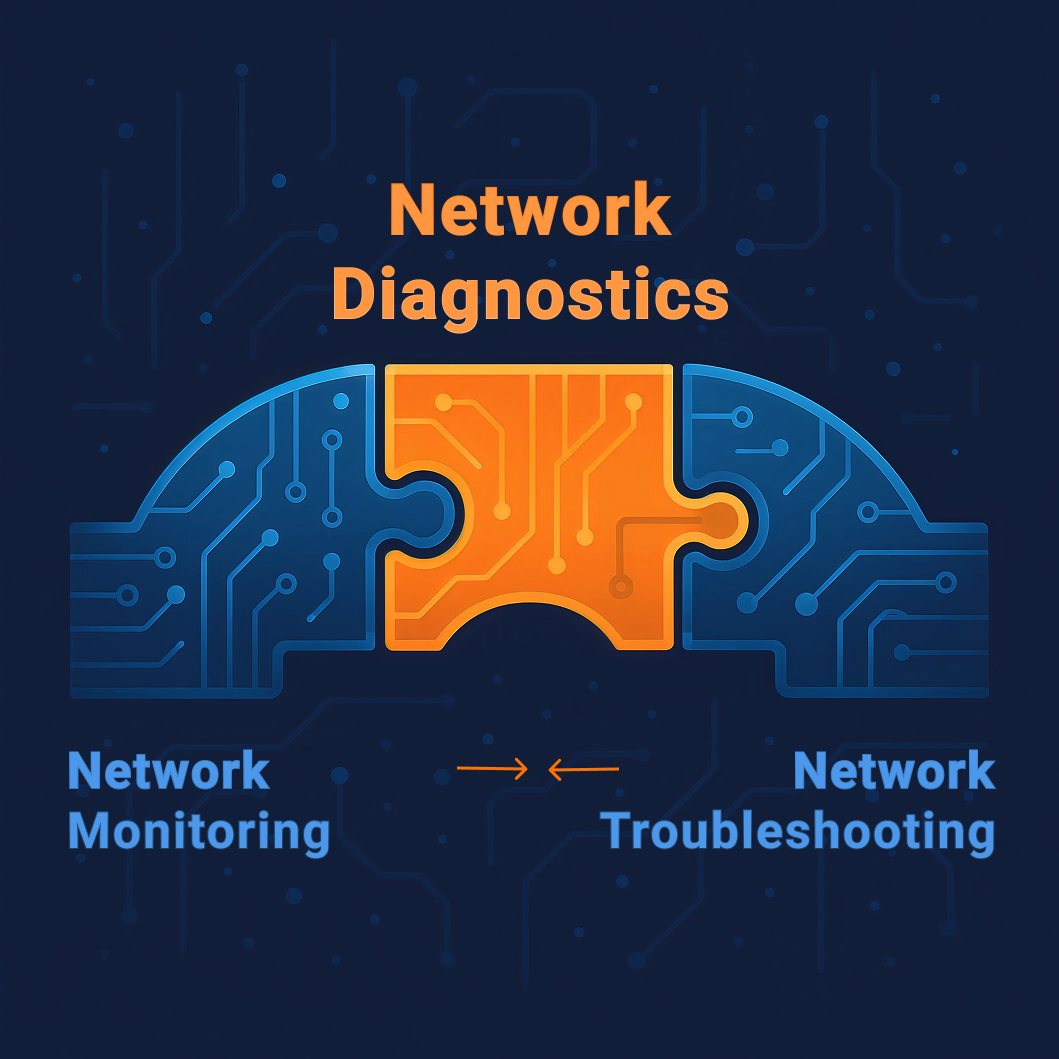
At its core, network diagnostics involves running targeted tests and using specialized tools to check how well different parts of the network are functioning. This can include verifying connections between devices, measuring latency, analyzing packet flow, and ensuring that data paths are efficient and error-free.
Unlike basic network monitoring that simply raises alerts when performance drops, network diagnostics gives you context. It answers the “why” and “where” behind a network issue. For example, instead of just knowing that your application is slow, network diagnostics can show whether the slowdown is caused by high latency on a specific link, a misconfigured router, or congestion on the ISP side.
In short, network diagnostics transforms raw performance data into data that you can use to actually solve your problem, helping IT teams to move from detection to resolution with clarity and confidence.
A network diagnostic tool is not just a test, it’s the instrument that runs the test, gathers the data, and translates it into insights you can act on. Where network monitoring tools watch for unusual patterns, diagnostic tools are more hands-on. They actively probe the network, run targeted checks, and reveal the hidden details behind network performance.
The key difference is that network diagnostic tools don’t just tell you something is wrong, they help you pinpoint the exact device, path, or configuration causing the problem.
These tools can be as simple as:
- Ping: Sending a quick signal to confirm if a device is reachable.
- Traceroute: Mapping the path traffic takes across the Internet.
Or as advanced as:
- Protocol analyzers: Capturing and inspecting traffic down to the packet level.
- End-to-end performance monitoring platforms (e.g., Obkio): Simulating real user traffic across multiple sites and automatically diagnosing performance degradation.
The best network diagnostic tools combine both continuous visibility and on-demand troubleshooting. For example, while network monitoring may alert you to high latency between two sites, a network diagnostic tool can instantly trace the route, analyze packet flows, and confirm whether the slowdown is caused by a local device, a misconfigured firewall, or an ISP hop.
In short, a network diagnostic tool gives IT professionals the “X-ray vision” they need to see past the symptoms and uncover the real cause of network problems.
Unleash the power of network diagnostics! Explore best practices, case studies & trends. Discover how Obkio can supercharge your network performance.
Learn more

At a high level, network diagnostic tools work by actively testing and continuously analyzing traffic across the network. But instead of simply reporting that performance is “good” or “bad,” they dig deeper, breaking down every hop, device, and path to show where things slow down or fail.
Here’s what happens step by step:
Tools continuously gather network performance metrics from key points: routers, switches, servers, applications, and remote endpoints. This data includes latency, jitter, packet loss, throughput, and more. Some network diagnostic tools use lightweight software agents, while others use virtual appliances or cloud-based probes to run tests.
Instead of waiting for users to complain, many modern network diagnostic tools simulate real user activity using synthetic traffic. For example, Obkio continuously sends test packets across your WAN, LAN, and cloud paths to mimic how applications behave. This gives IT teams early visibility into issues before end users even notice them.
When performance drops, network diagnostic tools don’t just say “latency is high.” They trace the full traffic path (hop by hop) across the local network, ISP, and cloud. This allows you to see if the slowdown is caused by a misconfigured router at your office, congestion on the ISP’s backbone, or a bottleneck in the cloud provider’s network.
By analyzing the data collected, network diagnostic tools can narrow down the exact source of the problem. For instance, if packet loss is only visible after traffic leaves your network, it’s likely an ISP issue. If latency spikes occur only at certain times, it may indicate congestion or misconfigured QoS policies.
The real power lies in combining both approaches:
- Continuous testing provides a baseline and alerts IT when performance dips.
- On-demand testing allows admins to instantly dig deeper into a problem as soon as it arises.
This combination means IT pros aren’t just reacting to outages, they’re actively diagnosing issues in real time, across complex environments that may span offices, remote workers, data centers, and cloud services.
A strong network diagnostic tool is more than a dashboard with numbers, it’s a practical assistant for IT teams who need clear answers about what is affecting their network performance and how to fix it. Below are the core features that separate basic tools from professional-grade platforms, with added context from real-world use.
Network diagnostic tools continuously measure key metrics like latency, jitter, packet loss, throughput, and bandwidth utilization. They don’t just collect data; they compare it against baselines and thresholds, triggering alerts when performance dips.
Real-world context: Imagine you’re managing a hybrid workforce, and remote employees start complaining that video calls are choppy. With real-time diagnostics, you’ll know instantly if the problem is inside your LAN, your VPN tunnel, or the ISP link to the remote region. Instead of guessing, you already have evidence.
Why it matters: Being proactive keeps issues from becoming outages. Users notice problems less, and IT teams can respond with confidence instead of panic.
 Screenshot from Obkio's Network Monitoring Tool
Network Diagnostic tools excel at getting past the symptom and uncovering the cause. By mapping the traffic path hop by hop, they highlight where latency, congestion, or loss originates. Visual maps make this faster and clearer than raw logs or manual traceroutes.
Real-world context: Let’s say a cloud-based CRM is slow. Monitoring tells you “high latency.” Diagnostics shows you it’s happening after the traffic leaves your network and hits the ISP backbone. That immediately shifts the resolution from internal troubleshooting to escalating with the provider, armed with proof.
Why it matters: Root-cause clarity means fewer wasted hours, faster fixes, and less blame-shifting between teams.
Performance data isn’t only useful in the moment. By storing historical results, tools let you spot recurring issues, analyze usage patterns, and plan capacity upgrades.
Real-world context: Maybe packet loss spikes happen every Friday afternoon when backups run. Without trend data, you’d see this as “random instability.” With it, you connect the dots and adjust scheduling or bandwidth.
Why it matters: Trend visibility turns firefighting into strategy. You’re not just reacting, you’re preventing.
Today’s networks are distributed. A single office may connect to multiple data centers, SaaS apps, and remote branches. Good network diagnostic tools let you run tests from different regions, user sites, or cloud providers to see performance from multiple perspectives.
Real-world context: If only employees in Europe report slow VPN connections, testing from North America and Europe simultaneously reveals whether the issue is global or regional. This cuts troubleshooting time dramatically.
Why it matters: You see the whole picture, not just one user’s experience. This is crucial in hybrid and cloud-first environments.
Instead of waiting for IT admins to launch manual checks, network diagnostic tools can trigger automated workflows. When latency spikes, they might run traceroutes, capture packet data, or compare against baseline results, storing everything for analysis.
Real-world context: You get an alert at 3 AM that packet loss spiked between two data centers. By the time you log in, the diagnostic tool has already run multiple tests, stored packet captures, and highlighted the exact hop where the issue occurred. You start troubleshooting with answers, not just alerts.
Why it matters: Automation reduces resolution time, saves overnight calls, and ensures consistent troubleshooting steps every time.
🔑 Takeaway: Together, these features give IT teams a complete workflow (from detection, to diagnosis, to resolution) without jumping between disconnected tools. Instead of piecing together evidence from ping, traceroute, and SNMP separately, a unified diagnostic platform shows the story end-to-end.
Obkio’s Network Performance Monitoring tool was created to simplify diagnostics and performance monitoring for today’s modern, decentralized networks. Designed to support all network types (from SD-WAN, MPLS, and Dual-WAN to LAN, WAN, VPNs (L2/L3), and even SASE architectures) Obkio monitors performance from end-to-end, across WAN, LAN, and cloud paths.
Unlike traditional tools that rely on packet captures, Obkio uses synthetic traffic and lightweight Monitoring Agents to measure performance between two points (such as a branch office and a data center). This ensures visibility from the end-user’s perspective and enables IT teams to identify live issues as soon as they appear.
Here’s how to perform effective network diagnostics with Obkio:
Getting started with Obkio takes minutes, not days. IT teams can deploy the solution in under 10 minutes, monitor all critical network locations, and begin collecting real-time performance metrics immediately.
Key benefits of deployment:
- 14-day free trial of all premium features
- Quick and easy installation
- Real-time performance measurements
- End-to-end visibility across LAN, WAN, and cloud
- Faster troubleshooting of live network problems
With Obkio, IT teams can move beyond guesswork and gain immediate diagnostic insights to solve problems faster.

True diagnostics requires visibility across the entire network, not just one site. With Obkio, Monitoring Agents can be deployed at:
Local sites: Installed in targeted offices to capture issues where users are affected. Software monitoring agents available for MacOS, Windows, Linux, and more. \
Public locations: Cloud-based public monitoring agents hosted in AWS or Google Cloud. These provide a comparison point to identify whether problems are global or isolated to specific destinations.
Agents exchange synthetic traffic every 500ms, ensuring constant visibility into end-to-end performance across branches, data centers, SaaS applications, and on-premise resources.
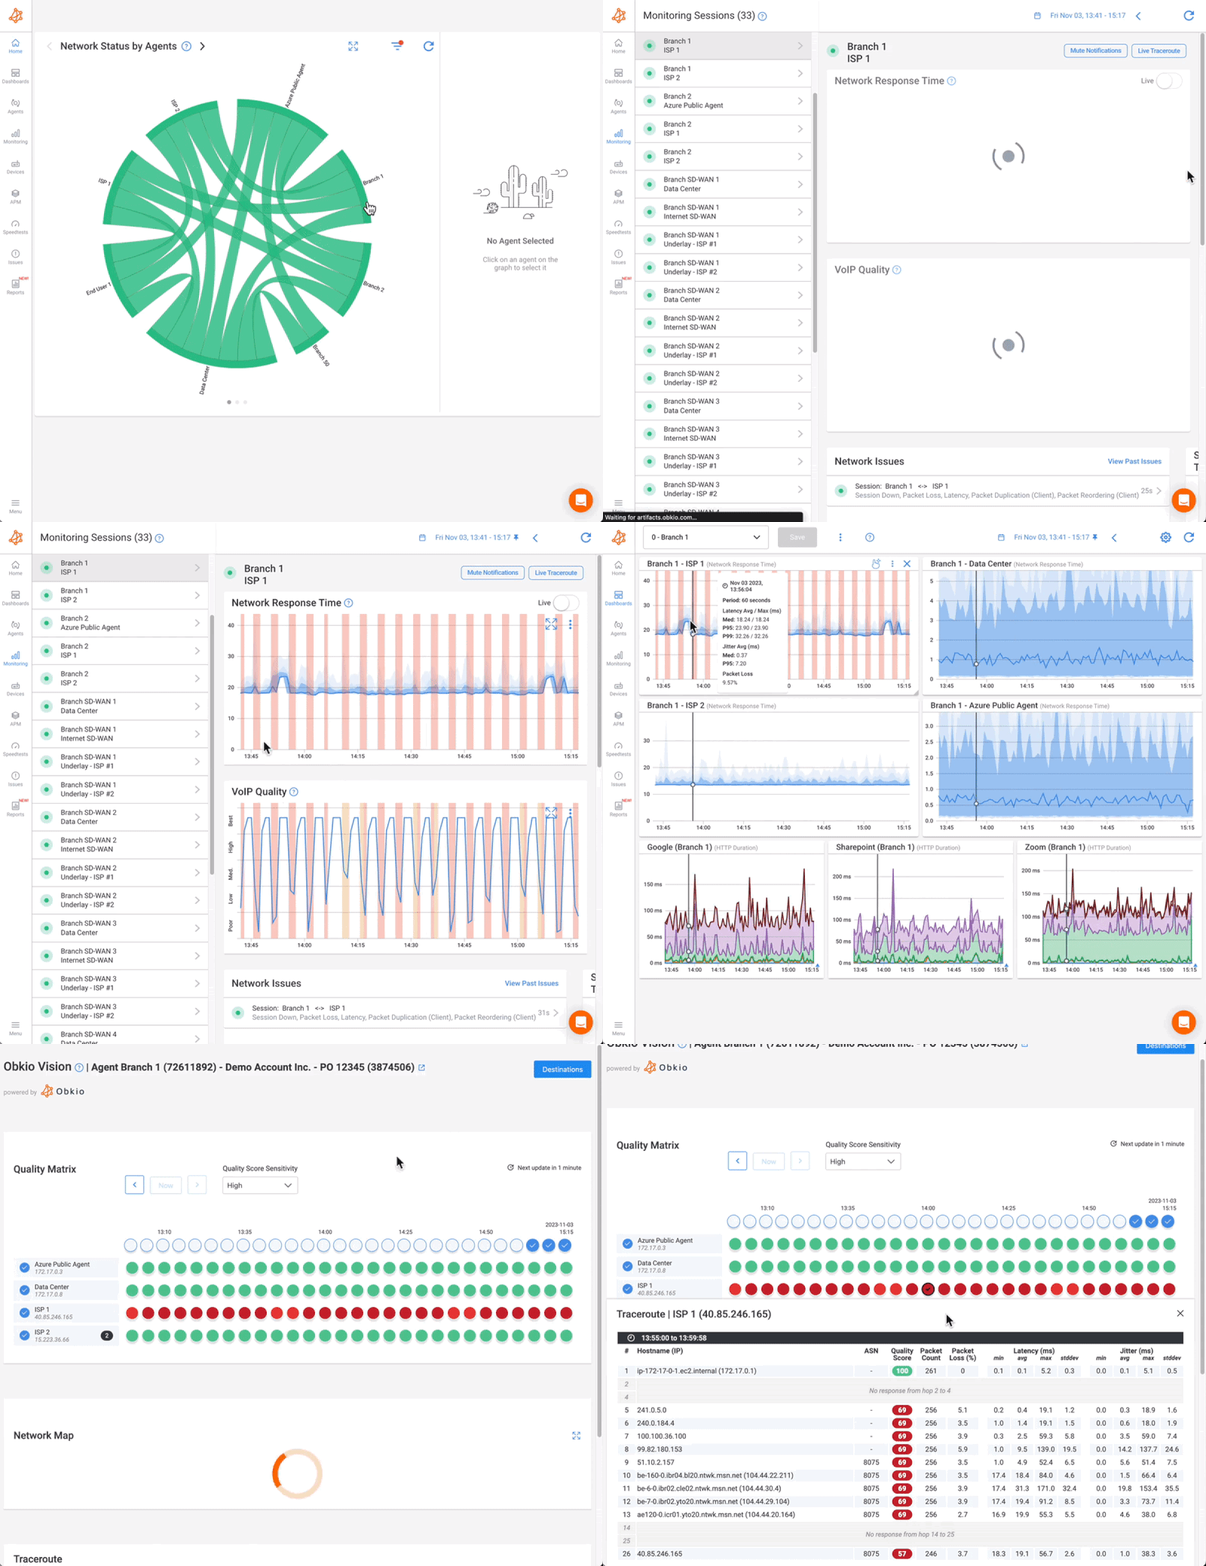
Traditional troubleshooting relied on manual pings or traceroutes run every few minutes. Obkio replaces this with continuous monitoring sessions, where agents exchange UDP traffic every 500ms to deliver precise, always-on diagnostics.
With Obkio’s Visual traceroute tool, IT teams can run advanced traceroutes between every hop and destination, making it possible to identify issues in real time, often before users even notice.
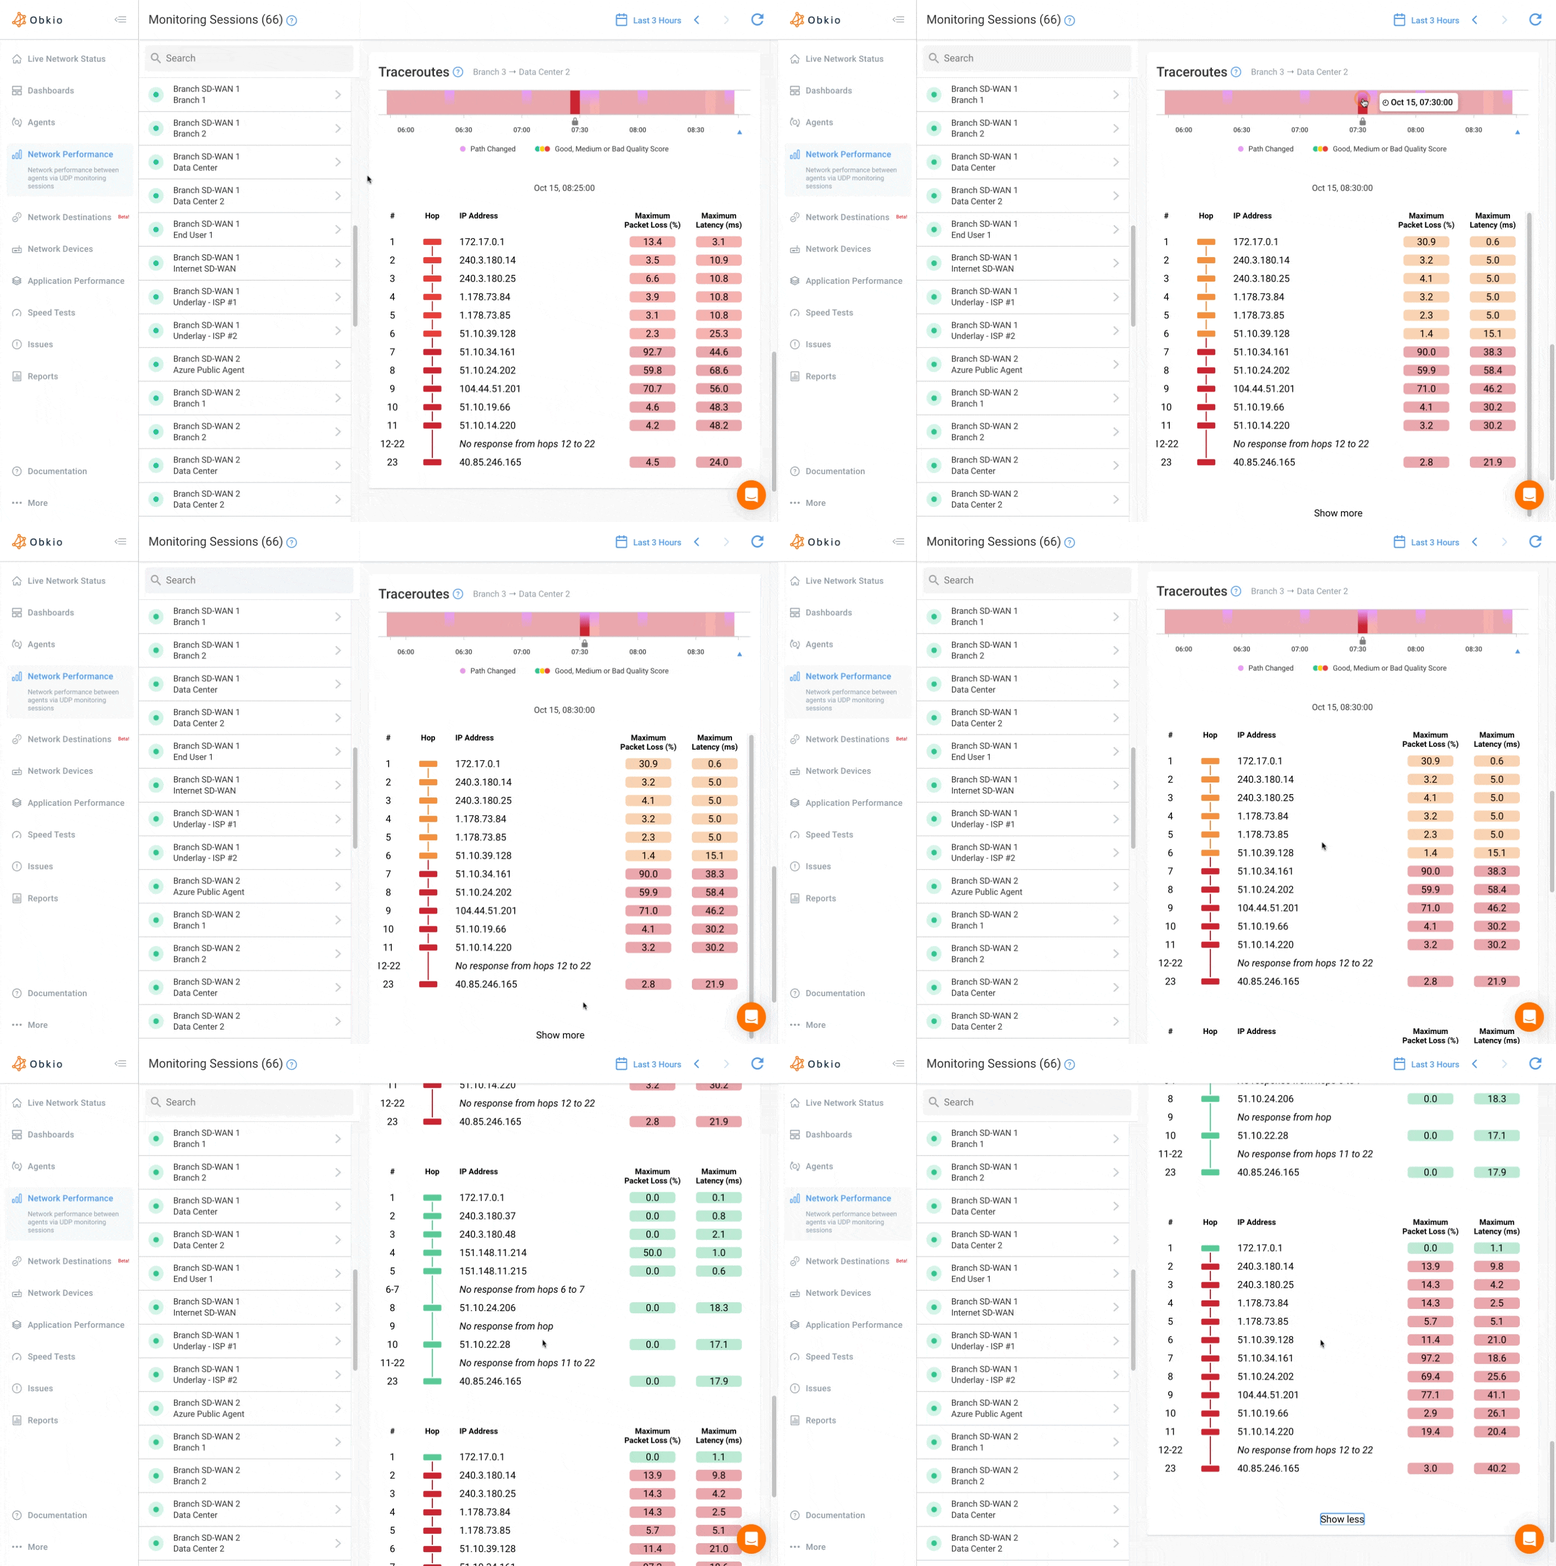
Obkio automatically measures key metrics essential for understanding and diagnosing network problems, including:
- Bandwidth Utilization – Detect congestion and bandwidth-heavy devices/apps.
- Latency – Measure delays affecting real-time applications.
- Packet Loss – Identify packet drops due to congestion, faulty hardware, or misconfigurations.
- Jitter – Spot inconsistent delivery times that disrupt VoIP and video.
- Network Availability – Track uptime and periods of downtime.
- Throughput – Understand overall network capacity and efficiency.
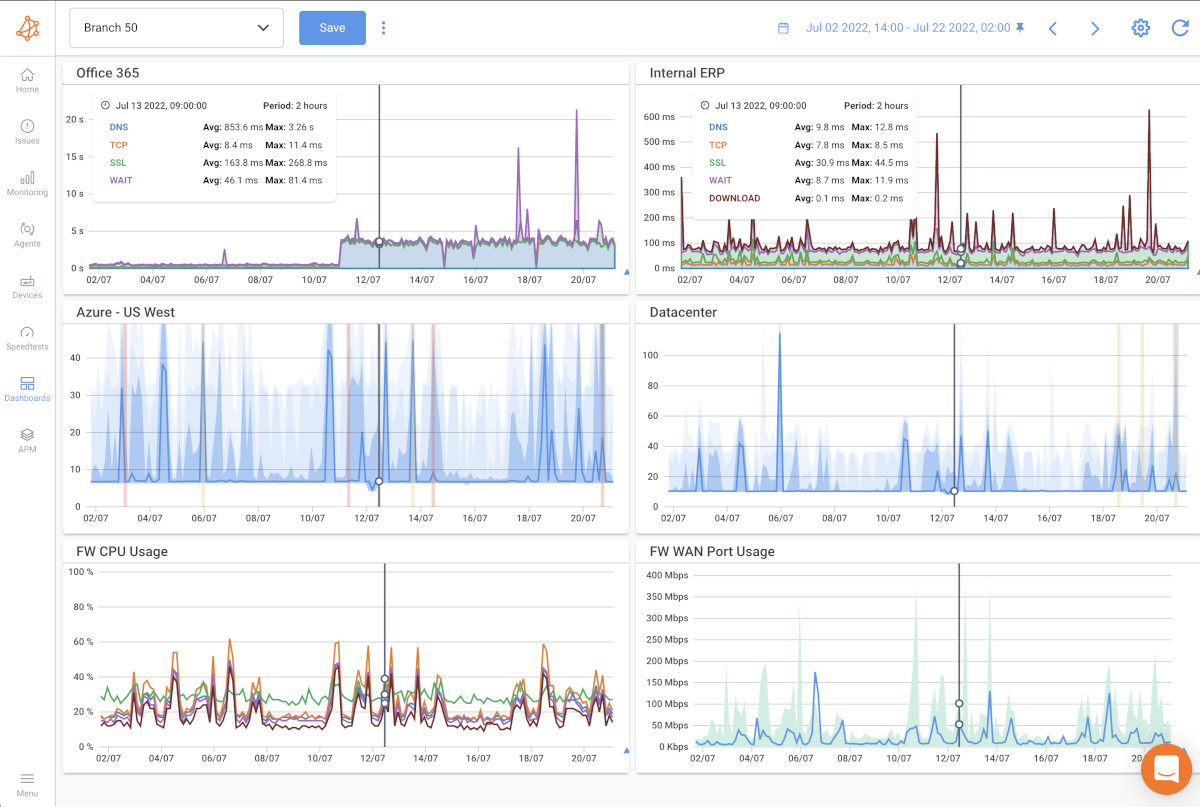
Additionally, Obkio provides Network Device Monitoring for routers, switches, and firewalls. IT teams can track CPU, memory, interface errors, uptime, and configuration changes to detect device-level bottlenecks before they escalate.
Pinpointing the moment problems occurred is critical for understanding the root-cause. With Obkio’s real-time and historical analysis, IT teams can use this info to diagnose issues and:
- Observe live changes in network baselines.
- Pin down the exact time of an issue.
- Dive into past performance data to investigate recurring issues or validate fixes.
This combination of real-time and historical context ensures problems are solved quickly and permanently.
Knowing when an issue occurred is only half the story. Obkio’s visual network map shows the exact path traffic takes and highlights where performance breaks down. Instead of comparing traceroutes manually, IT teams can instantly pinpoint the hop, device, or provider responsible.

WAN problems are notoriously difficult to troubleshoot. With traditional tools, IT admins often end up in endless back-and-forth with ISPs, armed only with basic ping data.
Obkio simplifies this by allowing IT teams to share live traceroute results directly with ISPs through public links. ISP engineers can see the problem, adjust settings, and validate fixes in real time, reducing resolution times dramatically.
LAN issues are often easier to control but still time-consuming with manual methods. Instead of jumping from device to device looking for logs, Obkio uses SNMP polling and agent-based monitoring to quickly highlight changes in baseline performance.
If further visibility is needed, IT teams can:
- Add more SNMP polling for additional devices.
- Deploy extra agents in targeted areas.
- Enable live mode during fixes to validate improvements instantly.
This structured approach replaces guesswork with data-driven troubleshooting.

- 14-day free trial of all premium features
- Deploy in just 10 minutes
- Monitor performance in all key network locations
- Measure real-time network metrics
- Identify and troubleshoot live network problems

Network diagnostic tools deliver value on two levels: they help IT teams work faster and smarter, and they improve business performance by minimizing downtime and disruptions. Below are the key benefits, with both a general explanation and practical technical examples.
Instead of relying on user complaints or vague monitoring alerts, diagnostic tools instantly detect anomalies and trace them to the source. This reduces mean time to resolution (MTTR) and keeps productivity on track.
Let’s say a site-to-site VPN between HQ and a branch keeps dropping. Monitoring shows packet loss, but not the cause. A diagnostic tool runs automated traceroutes and identifies packet drops at the ISP’s edge router. Instead of troubleshooting firewalls or VPN configs for hours, IT escalates directly with the ISP, with proof in hand.
General explanation: Diagnostics aren’t just about fixing problems when they occur, they also help you anticipate them. By analyzing historical trend data and comparing against baselines, IT teams can identify recurring patterns and prevent issues before they impact users.
If latency spikes to a cloud service occur every evening, trend analysis can show that this coincides with nightly data backups. With this insight, IT adjusts QoS to deprioritize backups during business hours, preventing slowdowns from recurring.
Downtime translates directly into lost productivity and revenue. By quickly narrowing down the root cause, diagnostic tools minimize downtime and keep critical applications running.
A VoIP system develops jitter, making calls unusable. Diagnostics reveal a misconfigured switch dropping packets whenever utilization exceeds 70%. Instead of days of trial-and-error, IT resolves the issue in minutes by adjusting the switch buffer and QoS settings.
Network issues often involve multiple teams: networking, security, systems, and application developers. Diagnostic tools provide shared visibility, removing guesswork and finger-pointing.
A web app times out repeatedly. Developers suspect the database; systems teams blame the server. Diagnostics show high TCP retransmissions between the app server and the core switch. The culprit? A faulty NIC. With clear evidence, the right team fixes it quickly.
At the end of the day, what matters most is user experience. By shortening resolution times and preventing problems altogether, diagnostic tools ensure reliable connectivity, faster applications, and happier users.
Remote workers complain about unstable Microsoft Teams calls. Diagnostics reveal asymmetric routing on the ISP path, causing packet reordering. IT reroutes traffic through a secondary provider, restoring smooth video performance.
With diagnostics, IT teams move from reactive firefighting to proactive management. Instead of guessing or relying on fragmented tools, they can see where the problem is, understand why it’s happening, and resolve it quickly, protecting both the business and the user experience.
Learn how to diagnose network problems & optimize performance. Discover the ultimate handbook for businesses & explore the power of Obkio. Get started now!
Learn more

The real challenge isn’t hearing about the problem, it’s figuring out where it comes from and how to fix it quickly. That’s where network diagnostic tools earn their place.
Here are some of the most common network problems, and why diagnostics are essential to solving them:
Nothing frustrates users more than sluggish applications or downloads. The problem could stem from bandwidth saturation, inefficient routing, or even issues with a cloud provider. Monitoring might show that latency is high, but diagnostic tools trace the exact path and identify which hop or device is responsible. Without diagnostics, IT teams are left guessing whether it’s an internal issue or an ISP problem.
Packet Loss can cripple services like VoIP and video conferencing. A monitoring tool may flag degraded call quality, but it won’t explain why. Diagnostics reveal exactly where packets are being dropped, whether it’s a faulty switch interface, a congested link, or an external backbone provider. This level of visibility makes it possible to apply the right fix instead of trial-and-error.

Even if packets arrive, inconsistent delivery times make real-time applications nearly unusable. Network diagnostic tools continuously measure jitter across different segments, so IT can pinpoint if the instability comes from bandwidth contention, poor QoS rules, or upstream provider issues. By diagnosing the exact cause, admins can apply targeted fixes instead of blanket adjustments.
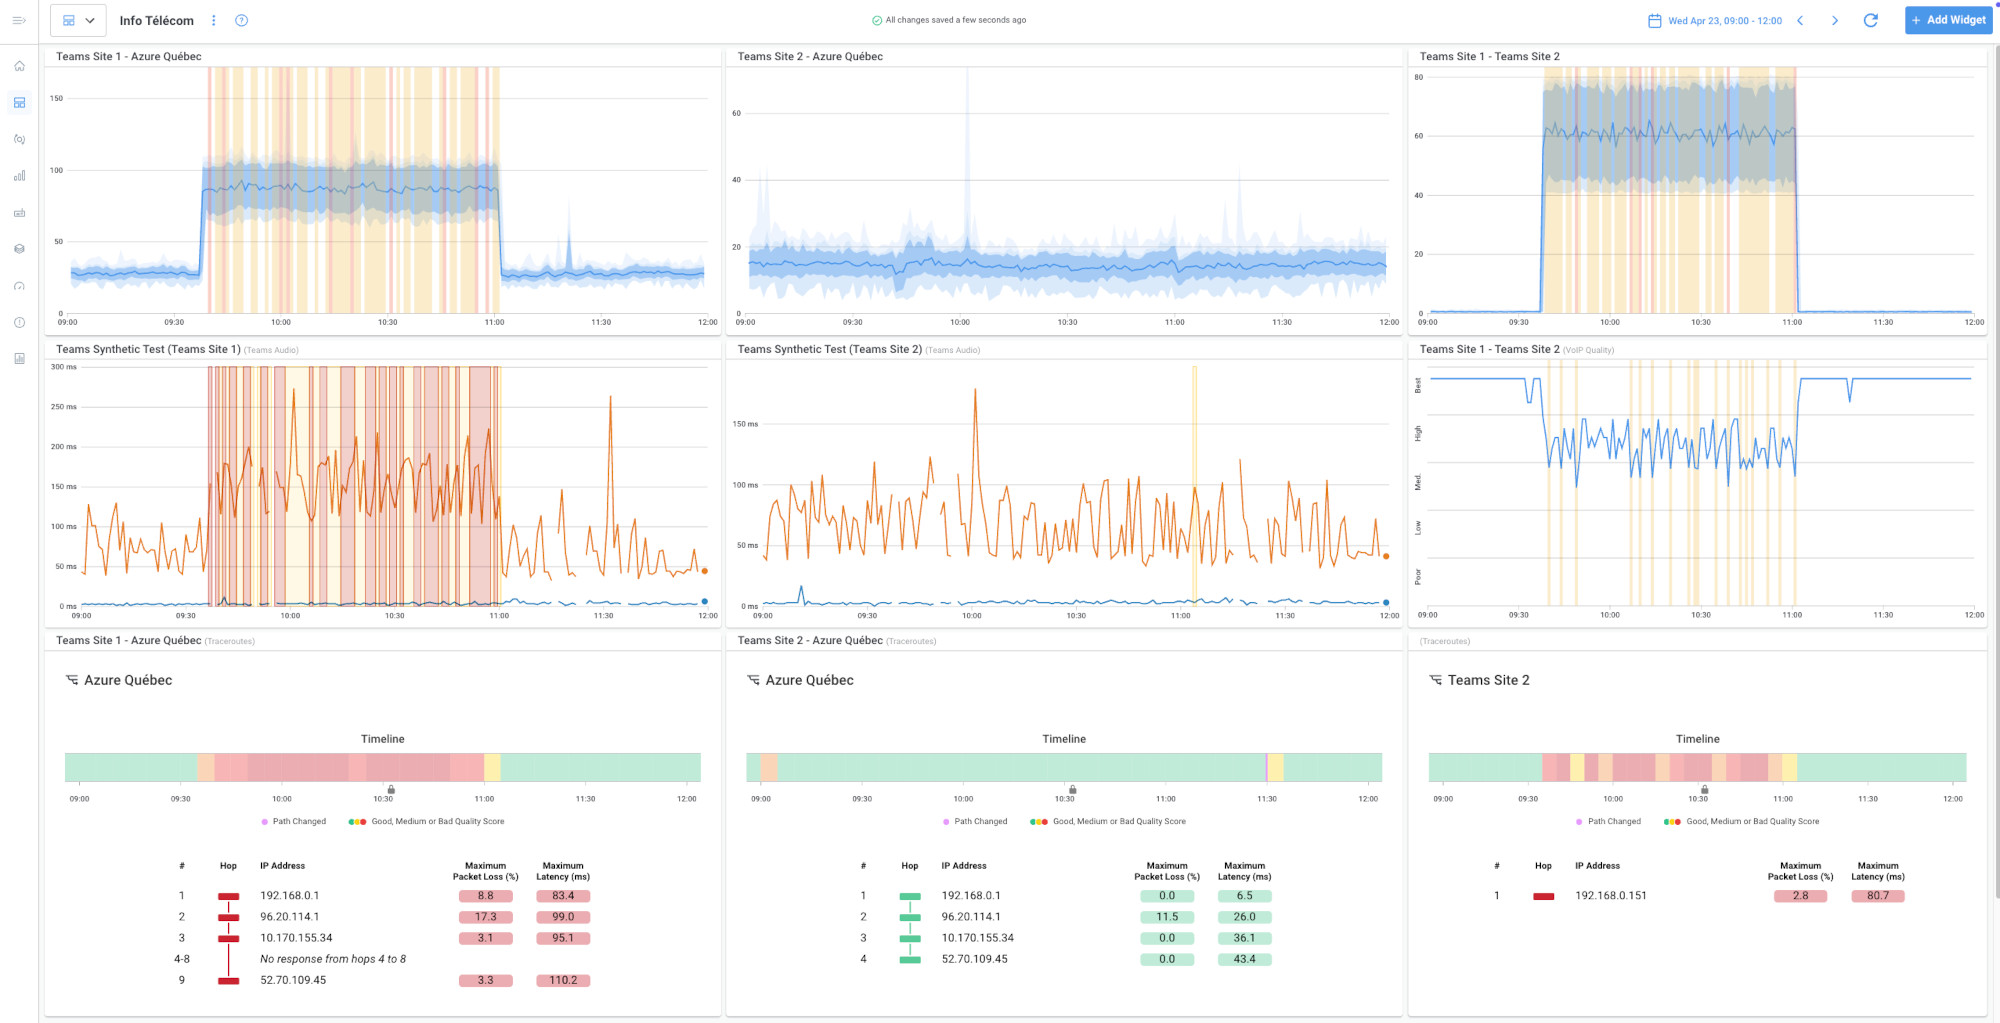
High utilization is common in modern networks, especially when multiple services compete for limited resources. A diagnostic tool doesn’t just confirm “the link is saturated”, it shows when and where congestion happens, and which applications or flows are contributing to it. This helps IT decide whether to upgrade bandwidth, reconfigure routing, or enforce traffic shaping policies.
Human error remains one of the leading causes of outages. A slightly wrong ACL, mismatched MTU, or incorrect routing policy can bring parts of the network down. Diagnostics highlight unusual behaviours or inconsistencies across paths, helping admins uncover misconfigurations that monitoring alone won’t reveal.
Perhaps the most frustrating scenario for IT teams is when the issue is outside their direct control. Users don’t care if it’s “the ISP’s fault”, they just want the problem fixed. Network diagnostic tools prove whether the performance problem is happening inside or outside the corporate network. This not only saves wasted effort but also gives IT the evidence needed to escalate quickly with providers.
Network diagnostic tools come in many forms, ranging from simple built-in utilities to advanced enterprise platforms. Each type serves a different purpose, and knowing when to use them can make troubleshooting faster and more effective.
1. Basic Connectivity Tools
These are the simplest and most widely known tools, often built into operating systems.
- Ping: Tests basic connectivity and measures round-trip time between devices.
- Traceroute: Maps the path packets take through the network and identifies where delays occur.
These tools are quick for first-line checks. If a user can’t reach a service, ping and traceroute can confirm whether the problem is connectivity, routing, or a complete outage.
Learn about what a traceroute is, how traceroutes work, how to read a traceroute, and how they help network engineers troubleshoot network issues.
Learn more

2. SNMP-Based Tools
SNMP (Simple Network Management Protocol) tools collect data directly from network devices like switches, routers, and firewalls. They provide visibility into device health, interface statistics, and error counts.
When to use: Best for diagnosing issues at the device level, such as high CPU usage on a router, interface errors, or port congestion.
Discover SNMP Network Monitoring for proactive monitoring, troubleshooting & issue detection for network devices with Obkio's SNMP Network Monitoring tool.
Learn more

3. Flow-Based Analyzers
These tools analyze traffic flows to show how bandwidth is being used and by which applications or hosts. They help uncover traffic patterns and detect abnormal usage.
When to use: Ideal for identifying bandwidth hogs, detecting suspicious traffic, or analyzing congestion sources.
4. Protocol Analyzers
Packet analyzers like Wireshark capture and decode traffic at the packet level, offering deep visibility into protocols, headers, and payloads. They provide forensic detail for complex troubleshooting.
When to use: Best when you need a microscopic view of traffic behaviour, for example, debugging a misbehaving application or identifying malformed packets.
5. End-to-End Monitoring Tools
Advanced platforms like Obkio simulate user traffic across multiple locations and cloud services. They combine continuous monitoring with automated diagnostics, providing complete visibility from LAN to WAN to cloud.
When to use: Perfect for modern distributed environments with remote users, SaaS applications, and hybrid networks. They provide not only detection but also root-cause insights across different domains.
6. Open-Source vs. Enterprise Tools
- Open-source tools are cost-effective and flexible but often require manual configuration and expertise.
- Enterprise-grade tools offer automation, scalability, and integration with business workflows.
Open-source tools are great for ad-hoc troubleshooting in smaller environments, while enterprise tools are better for large, distributed networks that need always-on visibility.
Choosing the right network diagnostic tool depends on the size of your network, the complexity of your infrastructure, and the type of challenges your IT team faces. At Obkio, we’ve worked with businesses of all sizes (from small offices to global enterprises), and we’ve seen what makes a tool truly effective in the real world.
1. Match the Tool to Your Network Size and Needs
Smaller networks: If you’re running a single office with a handful of devices, basic tools like ping, traceroute, and SNMP monitoring may be enough. They’re simple, lightweight, and effective for basic checks.
Larger, distributed networks: For multi-site businesses, hybrid infrastructures, or companies supporting remote workers, these basic tools quickly become limiting. In these environments, you need advanced diagnostic platforms that test across multiple locations, visualize traffic paths, and automate root-cause analysis.
2. Combine Network Monitoring and Network Diagnostics
Network Monitoring tells you that something is wrong. Network Diagnostics explain why it’s happening. Too often, IT teams use one without the other, which leads to slow resolutions and wasted time.
Our recommendation: Choose tools that integrate monitoring and diagnostics (and troubleshooting) into a single platform. This ensures you can move from detection to resolution seamlessly, without switching between multiple systems.
3. Consider Deployment Flexibility
Today’s networks span on-premises, cloud, and remote environments. A diagnostic tool should adapt to your reality, not force you into a rigid model.
On-premises tools are suitable for traditional setups.
Cloud-based tools are essential for businesses that rely on SaaS applications, remote employees, and distributed offices.
Our take: For most modern IT environments, cloud-based diagnostic platforms deliver the visibility you need across every path, from LAN to WAN to cloud.
4. Automation and Ease of Use
The most powerful tool isn’t useful if it’s too complex for teams to adopt. IT professionals are busy, and manual troubleshooting is time-consuming. That’s why automation, intuitive dashboards, and quick deployment are crucial features.
Our advice: Look for tools that can automatically launch diagnostic tests, correlate results, and provide clear insights without requiring hours of manual work.
Discover the top 30 network monitoring tools that provide you with all the information you need to keep your network running smoothly.
Learn more

Having network diagnostic tools in place is a strong start, but the real value comes from how your IT team uses them on a day-to-day basis. At Obkio, we’ve seen teams across industries transform their network performance strategies by applying a few best practices that ensure tools deliver maximum impact.
Every network is unique. What looks like “high latency” in one business might be perfectly normal in another. That’s why establishing baselines is essential. Baselines act as a reference point for what healthy network performance looks like under normal conditions.
Why it matters: Without baselines, alerts can be misleading.
Example: A 60 ms latency may be unacceptable for a local office LAN but perfectly fine for an international WAN link. With baselines in place, IT can quickly distinguish real problems from expected behavior.
Modern networks extend far beyond a single office — remote workers, branch sites, and cloud applications create multiple potential points of failure. Manual checks simply can’t keep up. Automated tests across distributed environments ensure constant visibility.
Why it matters: Issues can vary by location, provider, or even time of day.
Example: A SaaS application may work perfectly from North America but slow down for users in Europe. Automated multi-location testing reveals these regional differences instantly.
Continuous monitoring alerts you as soon as performance dips. On-demand troubleshooting digs deeper into the issue when it occurs. The combination ensures a complete workflow: you detect problems immediately and then investigate root causes without delay.
Why it matters: Speed is everything in IT.
Example: When packet loss spikes between two data centers, monitoring shows the problem right away. On-demand diagnostics immediately trace the route and confirm the issue lies at an upstream provider’s router, cutting hours off the troubleshooting process.
It’s tempting to focus only on “what’s broken now.” But historical data gives IT teams the long-term perspective they need to prevent recurring problems. Trends reveal patterns that one-off incidents don’t show.
Why it matters: Preventive fixes save far more time and money than reactive firefighting.
Example: Reviewing reports may show that every Friday at 3 PM, WAN bandwidth hits 95% utilization, coinciding with large file transfers. With this insight, IT can reschedule transfers or increase capacity before users start complaining.
Network problems don’t happen in isolation. They often impact applications, security systems, and business operations. Giving multiple teams access to the same diagnostic data reduces confusion and ensures faster collaboration.
Why it matters: Evidence prevents finger-pointing.
Example: If a CRM app is slow, diagnostics might reveal the bottleneck is caused by ISP packet loss, not a database issue. With everyone working from the same visibility, teams stop debating and start resolving.
Even the most advanced diagnostic platform won’t add value if only one engineer knows how to use it. Tools should be intuitive, easy to deploy, and accessible to the whole IT team.
Why it matters: Simplicity increases adoption.
Example: If help desk staff can run basic diagnostics before escalating, Tier 2 and Tier 3 engineers spend less time chasing false alarms.
As networks continue to expand across cloud platforms, SaaS applications, remote workforces, and distributed offices, the days of relying on monitoring alone are over. Network Monitoring tools can tell you that something is wrong, but only network diagnostic tools reveal why it’s happening and how to fix it.
For businesses, this distinction translates directly into value:
- Faster detection and resolution of issues.
- Reduced downtime and business disruption.
- Proactive identification of recurring problems.
- A seamless, reliable user experience across all locations and platforms.
At Obkio, we’ve seen how empowering IT teams with the right diagnostics transforms network management. Instead of reacting to complaints, IT leaders gain full visibility and control over performance (across LAN, WAN, and cloud environments).
The bottom line: network diagnostic tools aren’t a luxury anymore, they’re essential. For organizations that want stable, high-performing networks and satisfied users, investing in diagnostics means investing in long-term reliability, scalability, and peace of mind.

- 14-day free trial of all premium features
- Deploy in just 10 minutes
- Monitor performance in all key network locations
- Measure real-time network metrics
- Identify and troubleshoot live network problems


 Obkio Blog


