Table of Contents
Table of Contents
As organizations transition to distributed work environments and adopt cloud-based applications, the demand for secure, agile, and high-performing networks intensifies. As a result, many businesses have decided to implement Secure Access Service Edge (SASE), which integrates networking and security functions into a unified cloud-native platform.
Yet, implementing a SASE solution like Cloudflare One Zero Trust (CloudFlare SASE) marks only the initial phase in fortifying your network infrastructure. Monitoring and optimizing network performance stand as equally vital facets of this initiative. In this article, we’re going to dive into how to monitor the performance within Cloudflare SASE networks, highlighting how Network Performance Monitoring tools enhance visibility, pinpoint potential issues, and ultimately elevate the user experience.
Cloudflare is most known for its content delivery network and DDoS mitigation services. Cloudflare One, the company's SASE product, is a Zero Trust network-as-a-service platform that enables IT to dynamically connect users to enterprise resources while delivering identity-based security controls proximate to the users' locations. It uses a specially constructed worldwide network to integrate Zero Trust security services with network connectivity services.
Cloudflare One also includes support for Cloud access security broker (CASB), Secure Web Gateway (SWG), Zero Trust network access (ZTNA), and Firewall as a Service (FaaS). Furthermore, via alliances with SD-WAN suppliers, Cloudflare One offers WAN-as-a-Service. With the use of the service, an organization can directly link branch offices and data centers to Cloudflare Network Interconnect (CNI) for better speed and dependability.
- Zero Trust Network Access (ZTNA): More quickly and securely than a VPN, enforce default-deny, Zero Trust policies for users accessing all of your apps.
- Magic WAN: Using the Cloudflare network, connect and secure your branch offices, corporate offices, data centers, cloud VPCs, and SD-WANs.
- Magic Firewall: Throughout the whole WAN, enforce uniform network security standards without backhauling traffic or setting any choke spots.
- Secure Web Gateway (SWG): To assist in preventing ransomware, phishing, and other online threats, secure and monitor corporate Internet traffic.
- Cloud Access Security Broker (CASB): Easily safeguard critical data, manage user access granularly, and secure SaaS tools.

Say no more to MPLS and sluggish VPNs. Many businesses implement Cloudflare SASE to optimize their network performance and simplify the process of operating a corporate network at the edge of the Internet.
Optimize Your Applications: Ensure secure access to apps and facilitate cloud migrations while safeguarding privileged access and preventing the leakage of developer code. Secure DevOps workflows for enhanced productivity.
Safeguard Your Data Everywhere: Streamline compliance with data privacy regulations and manage shadow IT effectively. Safely leverage generative AI and protect sensitive data from unauthorized access.
Streamline Product Integration: Bid farewell to outdated hardware and consolidate point products such as legacy VPNs, SWGs, SEGs, CASBs, DLPs, firewalls, SD-WANs, and MPLS. Embrace a unified solution for comprehensive security and networking needs.
Embrace Zero Trust Principles: Enhance or replace vulnerable VPNs and ensure secure access for contractors or unmanaged networks and devices. Counter ransomware threats effectively and mitigate data exposure risks through a Zero Trust framework.
Modernize Your Network Infrastructure: Simplify branch connectivity and transition away from MPLS networks. Minimize or eliminate the need for DMZs and reduce reliance on LAN trust. Streamline connectivity for mergers and acquisitions.
Fortify Your Defenses: Thwart multi-channel phishing attacks and business email compromises effectively. Extend protection to remote workers and safeguard distributed offices. Strengthen security across the WAN to safeguard against emerging threats.
Why it’s Important to Monitor SASE with A Dedicated Network Performance Monitoring Solution vs. Native SASE Monitoring Features
As businesses increasingly shift towards cloud-based solutions like Cloudflare Zero Trust, it’s important to remember that monitoring your SASE network is just as important as implementing it. Ensuring seamless operations is paramount; downtime is simply unacceptable. Continuously monitoring your Cloudflare SASE network's performance is essential to guarantee that it functions optimally after it’s been implemented
While some SASE services have native monitoring features that may offer some insights, they often fall short, merely indicating whether the network is up or down. This limited visibility severely impacts your ability to maintain smooth business operations and deliver a satisfactory user experience.
In contrast, employing a dedicated Network Performance Monitoring (NPM) solution, such as Obkio, ensures that you’re actually monitoring the performance of your SASE network to understand if it’s working as it should be and if it isn’t - why that is.
1. Achieving Security-Performance Balance:
In the realm of Cloudflare SASE, finding the delicate balance between security and performance is crucial. While robust security measures are indispensable, they must not compromise network responsiveness. A modern NPM solution like Obkio monitors key performance indicators that are linked to security objectives while preserving user experience, ensuring a harmonious coexistence of security and performance metrics.
2. Comprehensive Network Visibility:
Native monitoring features may offer limited insights, focusing on specific aspects of network monitoring without providing a holistic view of network performance. Conversely, an NPM solution like Obkio offers comprehensive visibility into every facet of your Cloudflare SASE network, spanning from WAN to LAN. This broader perspective facilitates a deeper understanding of network behaviour and performance.
3. Proactive Issue Identification:
With Obkio's proactive monitoring approach, potential network issues can be detected before they affect end-user experience. Continuous monitoring of network metrics such as latency, packet loss, and throughput enables the timely identification and resolution of performance deviations, minimizing downtime and optimizing network efficiency.
4. MSSP & MSP Visibility:
While native monitoring features may provide standardized capabilities, an NPM solution like Obkio offers flexibility to tailor monitoring strategies to your specific network architecture and requirements. Whether you need to monitor specific network segments or devices or assess overall network performance, Obkio provides MSSP and MSP businesses with the customization of monitoring agents and sessions to align with your needs.
Learn more in our article: How to Monitor MSP Networks for 360-Degree Visibility
5. Regular Network Audits and Assessments:
Obkio empowers network administrators to conduct regular network assessments to evaluate the overall health, security posture, and performance efficiency of your Cloudflare SASE infrastructure. These routine assessments serve to identify areas for improvement and ensure adherence to industry standards, performance benchmarks, and operational robustness.
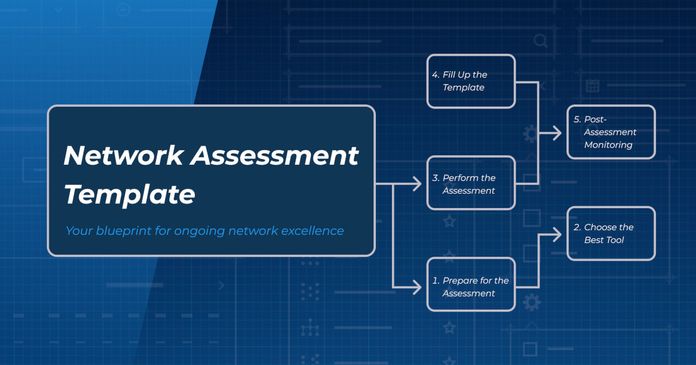
Unlock the power of network assessment with our step-by-step network assessment template. Follow this ultimate blueprint for ongoing network excellence.
Learn more

Tailored for modern networking environments, Obkio's Network Performance Monitoring tool is designed specifically for SASE network monitoring. With end-to-end visibility across all network segments, from branch offices to cloud environments, Obkio empowers you to track performance metrics comprehensively. Pinpoint and resolve issues anywhere in your network infrastructure with ease.
As a dedicated network monitoring solution, Obkio gathers critical network metrics at every location using monitoring agents that simulate traffic. This granular approach provides unparalleled visibility and control, allowing Obkio to identify and address underlying issues impacting network performance effectively.
It's important to note that while this article focuses on Cloudflare SASE, Obkio offers vendor-neutral SASE monitoring. With similar implementation procedures across most SASE vendors, including Cloudflare, Obkio's comprehensive monitoring approach sets it apart.
Ready to elevate your network monitoring? Gain valuable insights into your network's performance today with Obkio's SASE monitoring solution.
Don't let network challenges hold you back - sign up for Obkio's SASE monitoring solution now.
- 14-day free trial of all premium features
- Deploy in just 10 minutes
- Monitor performance in all key network locations
- Measure real-time network metrics
- Identify and troubleshoot live network problems

Now that you understand the importance of monitoring your Cloudflare Zero Trust (CloudFlare SASE) network and the potential performance issues to avoid, it's time to take action and implement SASE network monitoring. But how exactly do you deploy a monitoring solution for Cloudflare Zero Trust services? Don't worry, we've got you covered.
In the following section, we'll walk you through the process of implementing Obkio to monitor your Cloudflare Zero Trust network, ensuring optimal performance and security. We'll provide a comprehensive guide on getting started with SASE monitoring, including selecting the right monitoring tools and configuring policies and alerts.
Obkio is engineered to simplify network monitoring for contemporary distributed network infrastructures such as SASE, SD-WAN, Hybrid, Multi-Homing, and beyond. This active, end-to-end Software as a Service (SaaS) solution empowers you to monitor network performance seamlessly from WAN to LAN.
Leveraging distributed Monitoring Agents and simulated traffic, Obkio’s solution continuously exchanges synthetic traffic to proactively identify network, application, device, and Internet performance issues before they impact end-user experience negatively.

Deploying Obkio is a breeze, requiring just 10 minutes of your time, thanks to its intuitive design. Additionally, you can connect with our sales team to schedule a quick meeting. Our team of network experts stands ready to assist you in troubleshooting any issues within your Cloudflare SASE network.

Achieving end-to-end visibility and comprehensive monitoring of your Cloudflare Zero Trust (CloudFlare SASE) network demands a distributed monitoring approach.
Obkio's Network Monitoring Agents, strategically installed across your network sites, play a crucial role in analyzing network metrics such as latency, jitter, and packet loss. These specialized software agents enable monitoring of SASE network locations and Internet performance, while also providing timely notifications of any potential network issues.
To facilitate decentralized network monitoring from source to destination, Monitoring Agents establish Monitoring Sessions using synthetic UDP traffic. This approach ensures thorough monitoring of network performance and enables proactive detection of network problems.

Monitoring a SASE network means keeping a watch on the local firewalls at each site as well as the network sessions that go to each site via the SASE architecture. You have two options for doing this: going through or around the SASE. To do this, you'll need a range of Agent types:
You need:
- In the specific network locations you want to keep an eye on, including data centers and remote offices, one Local Agent is set up. Other types of Agents, which may be installed on Windows, Linux, and MacOS, provide the same functions.
- Three Public Monitoring Agents, managed by Obkio, are deployed across the Internet. They quickly discern whether network issues are widespread or specific to the destination by evaluating performance up to the Internet. For example, they evaluate network performance between your firewall and head office.

The network diagram above shows an Obkio Chord Diagram, and agents are keeping an eye on the following:
- ISP-1: A UDP flow from Branch 5 sticky on the first Internet connection
- ISP-2: A UDP flow from Branch 5 sticky on the secondary Internet connection
- SD-WAN Internet: UDP flows load balanced across the two Internet links following the SD-WAN algorithm
- SASE: Internet experience through the SASE service
- 8 Remote Branches
- 2 Data Centers
You have the option to either traverse through or bypass the SASE framework while monitoring the Cloudflare SASE network. This decision depends on the specific objectives and desired level of visibility.
Bypassing the Cloudflare SASE
Direct monitoring of specific network segments or devices becomes feasible by circumventing the SASE framework, as traffic avoids routing through it. This approach is beneficial when monitoring is confined to particular sites or subnets, and detailed visibility into local networks or devices is required.
To bypass the SASE, deploy monitoring agents on designated devices or directly within the local network. These agents can capture and analyze local traffic independently of the SASE infrastructure.
Going Through the Cloudflare SASE
Routing traffic through the SASE framework offers a centralized and comprehensive overview of the entire network. This is essential for monitoring end-to-end connections, assessing SASE service performance, and ensuring consistent implementation of security rules across the network.
To navigate through the SASE framework, utilize synthetic traffic that mimics real-world scenarios. This method facilitates the evaluation of SASE services' performance in practical usage situations, such as FWaaS and SD-WAN.
Unlock the power of your SASE architecture with effective monitoring. Learn how to optimize SASE performance and security with data-driven insights.
Learn more

The goals of a SASE architecture complement the dynamic and application-aware routing features of SD-WAN, which contribute to the development of a scalable, secure, and high-performance network infrastructure.
It actually serves a number of purposes inside the SASE architecture.
Dynamic Traffic Routing: SD-WAN intelligently routes traffic based on real-time conditions, enabling dynamic adjustments to ensure optimal performance. This is particularly important when cloud-based applications and dispersed users interact in a SASE setting.
Application-Aware Routing: SD-WAN classifies and identifies different types of network traffic based on the unique needs of individual applications. Simplifying the path for essential applications, it ensures dependable operation and a satisfying user experience.
Integration with Security Services: ZTNA (Zero Trust Network Access) and FWaaS (Firewall-as-a-Service) are two examples of security services that SD-WAN is commonly integrated with within the SASE architecture. This integration allows for a seamless blend of security and performance, simplifying network administration.
Load balancing: To prevent traffic jams on specific routes, SD-WAN distributes traffic as evenly as possible over available paths. The load-balancing feature improves the network's dependability and responsiveness.

To obtain the level of detail required for SD-WAN network monitoring, you must deploy Network Monitoring Agents in the client LAN, behind the SD-WAN appliance. This is because monitoring both the end user's experience and their own underlying connections is necessary to compare the performance.
So, you need:
- Every network location, including data centers and remote offices, has one Local Agent.
- Three Public Agents will be monitoring the Internet.
The good news is that Obkio can monitor the SD-WAN network's overall performance as well as the amount of time the SD-WAN device spends using each connection.
For example, the following snapshot shows a dashboard with three network monitoring sessions. The monitoring sessions' setup falls between:
- A local Monitoring Agent is located behind the SD-WAN appliance.
- The head office, data center, or cloud are the three locations where three remote monitoring agents are deployed.

The three network monitoring sessions monitor the network performance between the two locations using different connections:
- Performance as seen by the end user (load is distributed throughout the connection using the SD-WAN algorithm) - top graph
- The performance of the ISP A connection is shown in the center graph.
- The performance of the ISP B connection is displayed in the bottom graph.
A lot of SD-WAN clients make use of this setup. They may both verify the real network performance of the traffic from the end users and keep an eye on each and every ISP connection in this way. In that scenario, the top graph shows the branch end users' actual network performance. There are three connection alterations in this specific case:
- Just after 18:00: ISP A has congestion and quickly moves to ISP B;
- Around 18:20, ISP A starts to provide service again as the congestion drops;
- Just prior to 20:00: ISP A is overtaken by ISP B due to packet loss and increasing latency/jitter.
Your firewall filters all Internet traffic before it enters your network to make sure there are no security risks. But with so much potential traffic, this can lead to network congestion. Before it threatens your network as a whole, you need to determine whether your firewall is overwhelmed. That's what Obkio's role is.
Obkio's Network Device Monitoring solution uses SNMP polling to monitor the operation of firewalls and other critical network devices. Position Monitoring Agents next to your firewall for complete visibility. You will then be able to observe comprehensive information about how your firewall is operating thanks to the exchange of traffic between your firewall agent and the agents installed in your offices, LAN, and WAN.

On-Premises at the Network Edge: Agents may be stationed nearby or on the network edge itself. This provides traffic patterns and local network security information before the SASE environment's FWaaS processing.
Within the FWaaS Infrastructure: Agents can be deployed directly within the FWaaS infrastructure by using virtual appliances or APIs. This logs specific information on FWaaS processing, rule enforcement, and SASE network performance.
At Branches and Remote Offices: Send agents to branches and remote offices to gather localized insights. Monitoring traffic prior to it entering FWaaS contributes to the security of the SASE network.
Devices and Endpoints: Install agents for user-specific insights on user devices, including endpoints. very helpful for remote user monitoring using FWaaS connections in the SASE scenario.
VPN Connection Points: Agents should be placed at VPN connection points in order to monitor encrypted traffic. Within the SASE architecture, keep an eye on user authentication and VPN speed.
If your firewall supports SNMP Polling, Obkio's network device monitoring tool will communicate with it or an SNMP-enabled device to provide you with crucial firewall performance information.
Latency: Quantifies the amount of time it takes for data to travel from its source to its destination via the firewall. Application performance and user experience may be hampered by high latency. Ensuring that latency is monitored guarantees timely data delivery within acceptable limits.
Throughput: The amount of data that passes through the firewall in a predetermined amount of time. Consistent network performance depends on monitoring throughput, which guarantees that the FWaaS manages network traffic effectively without becoming a bottleneck.
CPU, Memory, and Storage Usage: Monitor the FWaaS platform's use of CPU, memory, and storage resources. The efficiency of traffic processing might be impacted by high resource utilization. Planning resources, scaling, and optimizing performance are all facilitated by monitoring.
Packet Loss: The percentage of data packets that are lost en route to their destination is measured by packet loss. Reliability and quality of network connections are impacted by packet loss. Problems with data integrity and network performance are found through monitoring.
VPN Performance: Keep an eye on the effectiveness of your Virtual Private Network (VPN) connections, as they are essential to FWaaS's secure remote access. It is critical to identify problems affecting encrypted communication.
Metrics for Quality of Service (QoS): Track how FWaaS affects the performance of particular applications. By permitting modifications for security and application responsiveness balance, QoS metrics guarantee that FWaaS doesn't impair crucial application performance.
Since FWaaS is a managed service, you may monitor performance all the way up to the network of your Cloudflare appliance to ensure that there are no issues that might limit your service provider's capacity to supply your firewall.

As soon as your Monitoring Agents are deployed, Obkio's Network Monitoring tool will start exchanging synthetic traffic continuously, enabling you to monitor network performance from any point inside your Cloudflare SASE networks. Understanding the performance of your SASE network depends on measuring key network metrics.
Network metrics can help you discover any potential issues that your network might be hiding in addition to helping you understand how your network is functioning.

- Latency: Latency refers to the time taken for data to travel from its source to its destination. Low latency is crucial for responsive and real-time applications. Monitor end-to-end latency across the SASE network for both local and remote users.
- Throughput: Throughput indicates the speed at which data is transmitted over a network. Assess the network's capacity to handle data transport. Ensure consistent throughput within the SASE system for various users and applications.
- Packet Loss: Packet loss refers to the percentage of data packets lost during transmission. High packet loss can degrade communication quality. Minimize packet loss to maintain data transmission integrity within the SASE network.
- Jitter: Jitter represents the variability in the time intervals between data packet arrivals. Elevated jitter can lead to inconsistent performance, particularly in real-time applications. Effective monitoring and control of jitter are essential for a robust SASE network.
- Bandwidth Utilization: Bandwidth utilization measures the proportion of available network bandwidth being utilized. Analyze bandwidth utilization patterns to ensure efficient resource allocation and prevent congestion within the SASE network.
- Firewall Performance Metrics: Evaluate specific metrics related to firewall performance, such as connection and session limits, rule processing times, etc. Firewall monitoring in the SASE network ensures effective enforcement of security policies and optimal firewall service performance.
- VPN Performance: Assess the performance, latency, and stability of VPN connections. VPNs are integral to SASE for secure remote access. Monitoring VPN performance is crucial to ensure a secure and seamless user experience.
- Quality of Service (QoS) Metrics: QoS metrics relate to the prioritization and distribution of specific types of traffic. Monitor QoS data to ensure that critical applications on the SASE network receive the necessary bandwidth and priority.
- Resource Utilization: Monitor the utilization of CPU, memory, and storage resources on the network. Maximizing scalability and resource allocation helps maintain the robustness and responsiveness of the SASE network.
- Redundancy and Failover Performance: Evaluate the effectiveness of redundancy and failover mechanisms through performance assessments. Ensure minimal disruption within the SASE framework during failover scenarios to uphold network reliability.
By monitoring these network metrics, which provide a thorough overview of the SASE system, network administrators can make decisions about network enhancements and proactively identify performance issues before they affect end users.
One of the primary objectives of SASE network monitoring is to proactively identify and address performance concerns. In this endeavor, network managers and IT specialists can promptly detect any deviations from optimal performance by utilizing their network monitoring tools, designed to evaluate critical parameters.
Through the constant collection of data and analysis of network performance, network monitoring solutions like Obkio offer real-time insights into security incidents, latency, throughput, and other important metrics.
Above all, a powerful network monitoring tool is not just an observer. It continuously scans your SASE network for anomalies and out-of-the-ordinary behaviour using sophisticated algorithms. It acts as a proactive guardian, ensuring that potential performance issues are discovered before they worsen.

The network monitoring tool doesn't stop there; it's like having eyes and ears across your SASE architecture. By sending out network monitoring warnings automatically, it becomes your proactive guardian when deviations, bottlenecks, or potential security issues are found. Administrators can use these messages as an early warning system to respond quickly and forcefully to emerging issues.
The question is not if network issues will arise, but rather when they will. SASE networks have a lot of moving parts, which makes them large and complex and prone to a variety of network issues. Although your network monitoring software will identify these for you, you should still be aware of them:
1. Challenges with Latency:
- Cause: Lengthy data transfers, inefficient routing, and network congestion contribute to high latency.
- Solution: Streamline routing, utilize content delivery networks (CDNs), and ensure network capacity adequacy to reduce latency.
2. Bandwidth Limitations:
- Cause: Slow data transfer and poor speed result from insufficient bandwidth.
- Solution: Upgrade network infrastructure, implement Quality of Service (QoS) policies and optimize traffic prioritization to address bandwidth constraints.
3. Packet Loss:
- Cause: Hardware issues, network congestion, or faulty connections lead to packet loss.
- Solution: Implement error detection and correction mechanisms, troubleshoot hardware problems, and address network congestion to mitigate packet loss.
4. Jitter:
- Cause: Variations in network traffic cause jitter, resulting in uneven data packet delivery.
- Solution: Prioritize real-time traffic, employ buffer management, and optimize network routing to minimize jitter.
5. Firewall Processing Delays:
- Cause: Slow firewall processing leads to traffic inspection and permission delays.
- Solution: Ensure efficient firewall management of network load, optimize firewall configurations and utilize hardware acceleration.
6. VPN Performance Issues:
- Cause: Network congestion, encryption overhead, or misconfigurations impact VPN performance.
- Solution: Allocate sufficient bandwidth for VPN traffic, optimize VPN configurations, and use effective encryption methods to resolve performance issues.
7. Content Delivery Shortfalls:
- Cause: Slow content delivery stems from ineffective CDN configurations orthe absence of a content delivery network (CDN).
- Solution: Utilize a CDN to cache and deliver content closer to end users to enhance speed and reduce latency.
8. Resource Overutilization:
- Cause: Excessive network resource usage, including CPU, memory, and storage, leads to performance degradation.
- Solution: Monitor resource usage, scale infrastructure as needed, and optimize resource allocation for effective network functioning.
9. Authentication Delay:
- Cause: Slow authentication procedures delay device and user secure connections.
- Solution: Implement efficient user/device onboarding processes, optimize authentication systems, and use multi-factor authentication judiciously.
10. Redundancy and Failover Challenges:
- Cause: Failover mechanism delays or misconfigurations result in service interruptions.
- Solution: Ensure correct redundancy setups, regularly test failover processes and promptly address any issues to maintain service reliability.
11. Insufficient Monitoring and Visibility:
- Cause: Delayed identification and resolution of performance issues stem from inadequate monitoring tools and network visibility.
- Solution: Establish proactive alerting systems, utilize analytics tools, and deploy comprehensive network monitoring solutions to improve visibility.
12. Configuration Inaccuracies:
- Cause: Performance issues arise from incorrect network device settings, security rules, or routing tables.
- Solution: Conduct routine configuration audits, employ automation for consistency, and promptly rectify any misconfigurations.
13. Remote User Connectivity Issues:
- Cause: SASE performance is affected by problems with remote user connections, such as unstable VPNs or lost connectivity.
- Solution: Ensure reliable and secure remote user connections, optimize VPN configurations, and provide user support to address connectivity issues.
Cloudflare SASE network performance optimization is a continuous process. It's critical to monitor your SASE network in order to understand and maximize performance. This careful monitoring of network activity and the evaluation of significant indicators becomes a transformative force that yields valuable insights regarding latency, bandwidth, security, and other metrics.
We will explore the relationship between optimization and monitoring at this stage, where network administrators use their keen eyes and powerful instruments to find potential for improvement.
By actively managing and optimizing available bandwidth, one may ensure efficient utilization, prevent bottlenecks, and enhance overall data transmission efficiency. A SASE network cannot be responsive or high-performing without effective bandwidth control.
Finding and fixing delay sources is necessary for maximizing the performance of a SASE network. Techniques including enhancing network paths, leveraging edge computing, and minimizing unnecessary protocol overhead may be employed to lessen latency issues. By reducing latency, businesses may give users a trustworthy and responsive network experience, particularly in situations when they operate remotely.
The implementation of efficient routing and traffic control policies is necessary to optimize data flow inside a SASE network. By employing efficient routing algorithms and policies, organizations can reduce latency, limit congestion, and enhance the overall responsiveness of their network. Effective traffic management makes a flawless user experience possible, especially when it comes to distributed and remote operations.
Content delivery networks, or CDNs, optimize web application and service performance inside a SASE architecture. By employing geographically distributed servers to cache and deliver content closer to end users, CDNs significantly reduce latency. This optimization method increases the speed at which material is delivered while ensuring a responsive and uniform user experience across a range of geographic locations.
In a SASE network, QoS policies help prioritize traffic and important applications. By providing appropriate bandwidth and latency priorities, organizations can ensure that high-priority apps have the resources they require for optimal performance.
Maintaining a balance between security and speed in SASE networks requires regular firewall configuration reviews and adjustments. Fast traffic inspection processes are ensured by effective firewall configurations, which also aid in the elimination of unnecessary bottlenecks. Finding the ideal balance between network performance and security measures is essential to developing a reliable and responsive network infrastructure.

To ensure continuous remote access in a SASE setting, efficient Virtual Private Network (VPN) configurations are essential. By assigning adequate bandwidth, utilizing authentication methods, and fine-tuning encryption algorithms in their VPN settings, organizations can maximize secure connections. This optimization method is especially important in light of the growing need for secure remote work alternatives.
Cloud service optimization is necessary in a SASE architecture in order to maximize connectivity to cloud services. By carefully choosing the finest access points and ensuring that they adhere to SASE requirements, businesses may increase the speed of connections to cloud apps and services. Cloud service optimization increases the flexibility and responsiveness of the entire network architecture.
In a SASE setting, testing and planning for redundancy and failover procedures are essential to minimizing downtime and maximizing network performance. Robust failover protocols ensure seamless transitions in the event of network outages when they are regularly tested.
Collaborating with SASE service providers to optimize performance is a strategic partnership that leverages their expertise. When businesses and service providers cooperate together, important insights and suggestions for improving network performance can be obtained. Together, we can ensure that the network employs state-of-the-art optimization strategies and adheres to industry best practices.
For your Cloudflare SASE network, don't undervalue the need for proactive network monitoring. Even after you’ve successfully implemented your new SASE service, you still need to proactively identify and address network problems before they have a negative impact on your company's operations, and ensure that your SASE network is working the way your vendor promised.

Take your Cloudflare SASE deployment to new levels with Obkio's vendor-neutral Network Performance Monitoring (NPM) solution. Gain access to priceless insights about network performance, strengthen your troubleshooting skills, and guarantee a flawless user experience for your employees. Unlock the full potential of your network architecture by beginning your SASE monitoring journey right now.
Don't wait! Level up your Cloudflare SASE network now!
- 14-day free trial of all premium features
- Deploy in just 10 minutes
- Monitor performance in all key network locations
- Measure real-time network metrics
- Identify and troubleshoot live network problems


 Obkio Blog


