Table of Contents
Table of Contents
From its inception, Obkio's Network Performance Monitoring software has been committed to elevating the field of Network Monitoring, boasting robust feature sets like Network Performance Monitoring and Network Device Monitoring. These features empower IT teams with the tools to scrutinize and resolve intermittent network anomalies, all while providing precise network metrics, including invaluable Quality of Experience (QoE) measurements like VoIP Quality and MOS Score.
The ultimate mission of IT teams is to furnish end-users with a swift, secure, and dependable infrastructure, ensuring seamless productivity without the disruptions of sluggish IT performance. Yet, hiccups are bound to arise, prompting IT professionals to swiftly troubleshoot and minimize any impact on their users.
It's tempting to attribute every slowdown to network issues, but the truth isn't always so straightforward. Enter Obkio's Application Performance Monitoring (APM) tool, featuring an innovative HTTP URL monitoring feature. This tool equips IT teams with the means to pinpoint specific website performance and ensure rapid response times, dispelling doubts about sluggish website experiences and guaranteeing optimal user satisfaction.
Let's first start with a little introuction!
Application Performance Monitoring (APM) is a comprehensive approach to managing and optimizing the performance of software applications. It involves the collection, measurement, and analysis of various metrics and data points related to the performance of an application to ensure that it operates efficiently and meets user expectations.
APM is a critical practice in the world of software development and IT operations, as it helps organizations identify and address performance bottlenecks, errors, and other issues that can impact the user experience.
APM HTTP, or Application Performance Monitoring for HTTP, is a subset of Application Performance Monitoring (APM) focused specifically on monitoring the performance of web applications and the HTTP (Hypertext Transfer Protocol) transactions that occur between clients (such as web browsers) and servers.
Use APM HTTP tests to monitor the performance from the application standpoint of any website or web service, like this example below, where the performance to reach https://www.google.com/ is measured.

APM HTTP monitoring typically involves the following:
- HTTP Request and Response Metrics: APM tools capture data related to HTTP requests and responses, including response times, latency, status codes (e.g., 200 OK, 404 Not Found), and data transfer rates. These metrics provide insights into how web applications are performing and how they respond to client requests.
- URL and Endpoint Monitoring: APM HTTP tools can track the performance of specific URLs or endpoints within a web application. This allows organizations to monitor critical pages or functions and detect issues like slow loading times or errors.
- Transaction Tracing: Transaction tracing in the context of APM HTTP involves monitoring the flow of HTTP requests and responses as they traverse different components of a web application. This helps identify bottlenecks, dependencies, and performance issues within the application's architecture.
- Error Detection: APM HTTP tools can detect and report HTTP errors, such as 4xx and 5xx status codes, which indicate problems like client-side errors (e.g., 404 Not Found) or server-side errors (e.g., 500 Internal Server Error).
- User Experience Monitoring: Some APM solutions for HTTP incorporate end-user monitoring (EUM) features to measure and report on the actual experiences of users interacting with a web application. This includes tracking page load times, user interactions, and transaction success rates.
- Alerting and Notification: APM HTTP tools can be configured to generate alerts and notifications when predefined performance thresholds are exceeded or when errors occur. This enables proactive issue resolution.
- Code-Level Insights: Advanced APM solutions may offer code-level insights into the performance of individual HTTP transactions or functions within an application, helping developers identify and resolve performance bottlenecks in the codebase.
The primary goal of APM HTTP monitoring is to ensure that web applications deliver a fast, reliable, and responsive experience to users. By monitoring HTTP transactions, organizations can identify and address performance issues that may arise due to network latency, server load, database queries, or code inefficiencies.
The Application Performance Monitoring (APM) HTTP monitoring feature is elegantly simple yet yields a wealth of invaluable information to aid in the troubleshooting and identification of elusive intermittent issues. Aptly named, the APM HTTP feature conducts periodic tests on a single HTTP URL, extracting a trove of real-time performance metrics for comprehensive URL monitoring.
Obkio's APM HTTP feature is part of Obkio's comprehensive Network Performance Monitoring tool. So to access this feature, you need to first get started with Obkio's free 14-day trial!

Networks may be complex. But Obkio makes network monitoring easy. Monitor, measure, pinpoint, troubleshoot, and solve network problems.
- 14-day free trial of all premium features
- Deploy in just 10 minutes
- Monitor performance in all key network locations
- Measure real-time network metrics
- Identify and troubleshoot live network problems

To harness the power of APM HTTP and unlock its full potential in monitoring web application performance, you'll need to deploy specialized monitoring agents. In this case, we'll focus on the deployment of Obkio Network Monitoring Agents, which form the backbone of the APM HTTP solution.
The core function of these Monitoring Agents is to exchange synthetic traffic, simulating real user interactions with web applications. By doing so, they replicate the actual flow of HTTP requests and responses, allowing you to gain valuable insights into how your web applications perform from various geographical locations and network segments.
- Local Agents: Installed in the targeted office location experiencing connectivity issues. There are several Agent types available (all with the same features), and they can be installed on MacOS, Windows, Linux and more.
- Public Monitoring Agents: Deployed over the Internet and managed by Obkio. They compare performance up to the Internet and quickly identify if the problem is global or specific to the destination. This will be great information for later in the troubleshooting process. You can use an AWS or Google Cloud Agent.
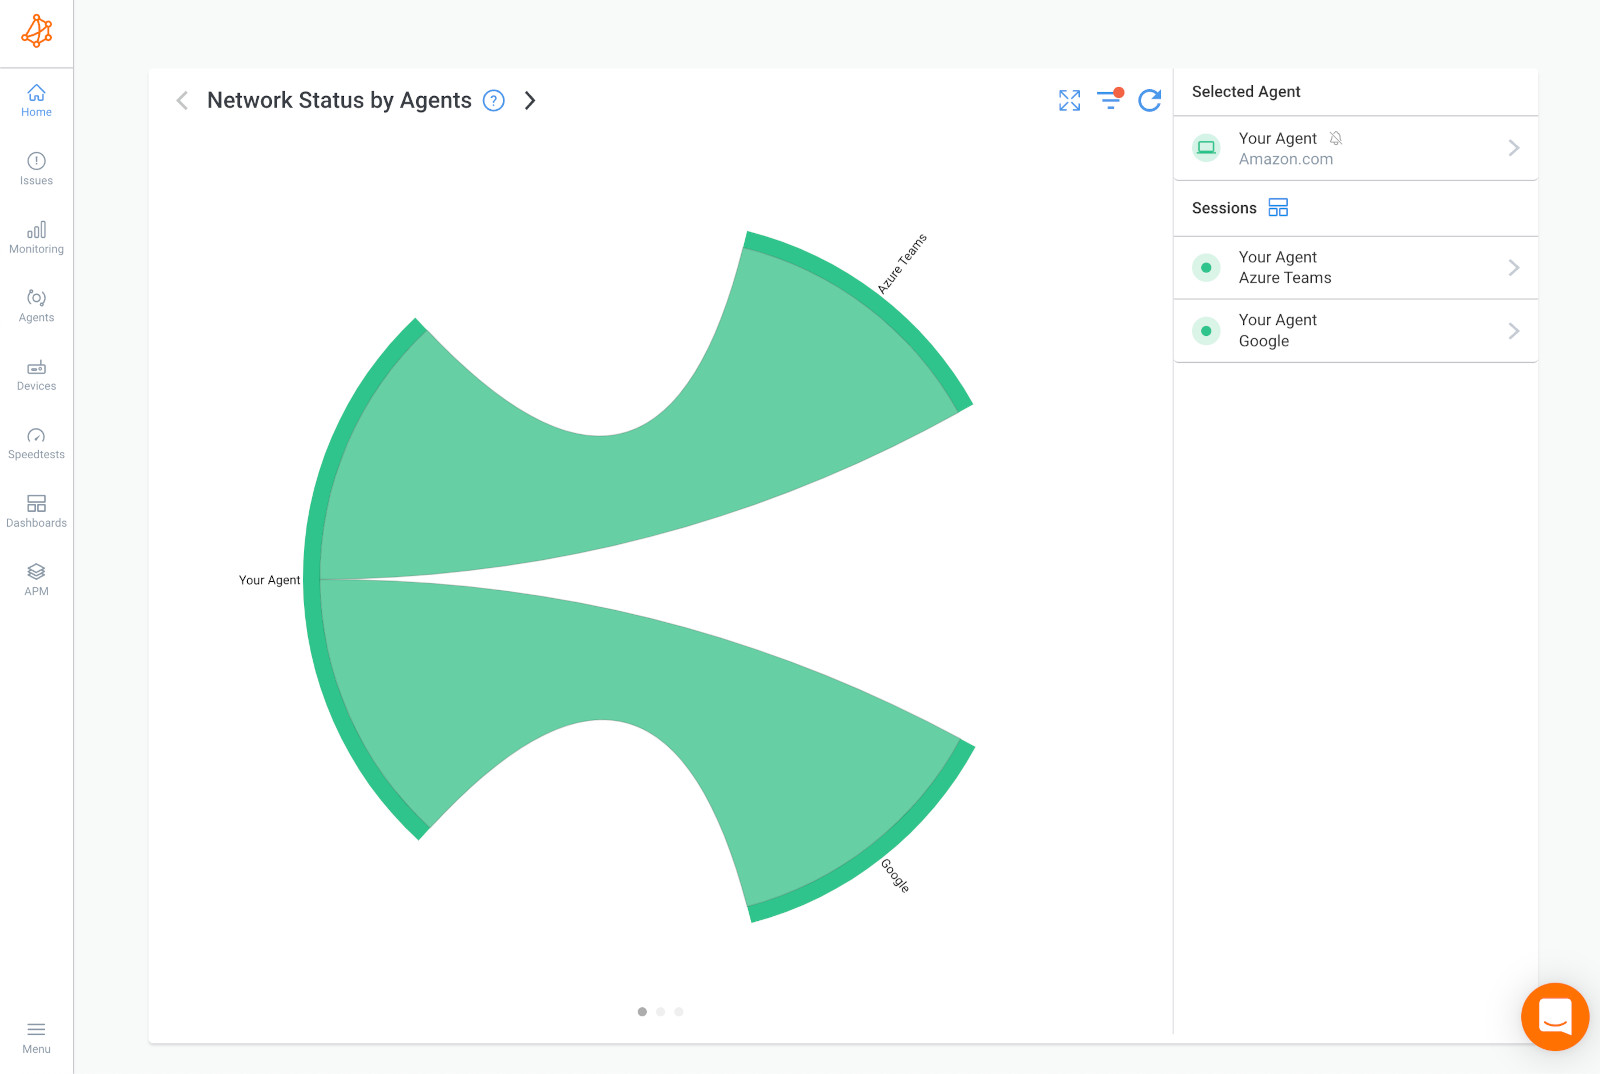
APM monitoring is effortlessly configured using APM templates. For detailed guidance on setting up APM templates, please refer to the comprehensive APM template documentation.
Once your APM tests are configured, you can conveniently access the collected metrics via the dedicated APM tab. Simply click on the APM tab to access an overview of all active APM tests.
To delve into the specifics of a particular APM test and explore the associated metrics, select the desired test from the list. It's worth noting that a single APM test can be conducted by multiple Obkio Agents simultaneously. For a deeper understanding of the diverse metrics at your disposal, check out the APM graphs documentation, which provides detailed insights into the available metrics.

And that's it! You now have everything you need for APM HTTP monitoring!
In the world of Application Performance Monitoring (APM) for HTTP, certain metrics serve as beacons, guiding us toward optimized web application performance. These metrics are the pulse of your digital presence, revealing the vital signs of your web applications' health.
In this section, we'll explore the key metrics that matter most in the realm of APM HTTP. These metrics provide crucial insights into the performance, reliability, and user experience of web applications, enabling organizations to proactively enhance their online presence and respond swiftly to any issues that may arise
Response Time: Response time measures the total time it takes for a web server to respond to an HTTP request. It includes DNS resolution time, connection time, server processing time, and data transfer time. Longer response times can indicate performance issues.
Latency: Latency represents the delay between sending an HTTP request and receiving the first byte of the server's response. High latency can lead to slow-loading web pages and negatively impact user experiences.
Time to First Byte (TTFB): TTFB measures the time from when an HTTP request is sent until the first byte of data is received from the server. It reflects server processing time and network latency. A high TTFB can indicate server-related performance problems.
HTTP Status Codes: Monitoring HTTP status codes (e.g., 200 OK, 404 Not Found, 500 Internal Server Error) helps identify issues. For example, 4xx codes indicate client errors, while 5xx codes signal server errors.
Content Download Time: This metric measures the time it takes to download all the content of a web page, including HTML, images, scripts, and other resources. Slow content download times can result in a poor user experience.
Page Load Time: Page load time is the total time required for a web page to fully load in the user's browser. It encompasses all HTTP requests and rendering processes. Longer page load times can lead to user frustration and higher bounce rates.
Transaction Success Rate: For web applications that involve multiple HTTP requests (e.g., e-commerce transactions), monitoring the success rate of these transactions is critical. It helps identify transaction failures and their causes.
Error Rate: Tracking the rate of HTTP errors, such as 404 errors or 500 errors, provides insights into the stability of web applications. A high error rate may indicate issues with server-side or client-side components.
Network Errors: Monitoring network errors (e.g., TCP retransmissions, packet loss) helps identify network-related issues that can affect HTTP performance.
Resource Utilization: Monitoring server CPU usage, memory, and disk usage can help pinpoint resource bottlenecks that impact web application performance.
DNS Resolution Time: The time taken to resolve domain names into IP addresses can affect overall page load times. Slow DNS resolution can lead to delays in accessing websites.
Connection Time: Connection time measures the time it takes to establish a network connection to the web server. Long connection times can indicate network issues.
Client-Side Metrics: For single-page applications (SPAs) and modern web applications, tracking client-side metrics such as JavaScript errors and rendering performance is essential.
End-User Monitoring (EUM): EUM metrics provide insights into real users' experiences, including page load times, interactions, and geographic performance variations.
API Performance: If an application relies on APIs, monitoring API response times, error rates, and throughput is crucial for overall performance.
These APM HTTP metrics, when monitored and analyzed effectively, enable organizations to detect, diagnose, and address performance issues promptly, ultimately enhancing the reliability and speed of web applications while improving user satisfaction.
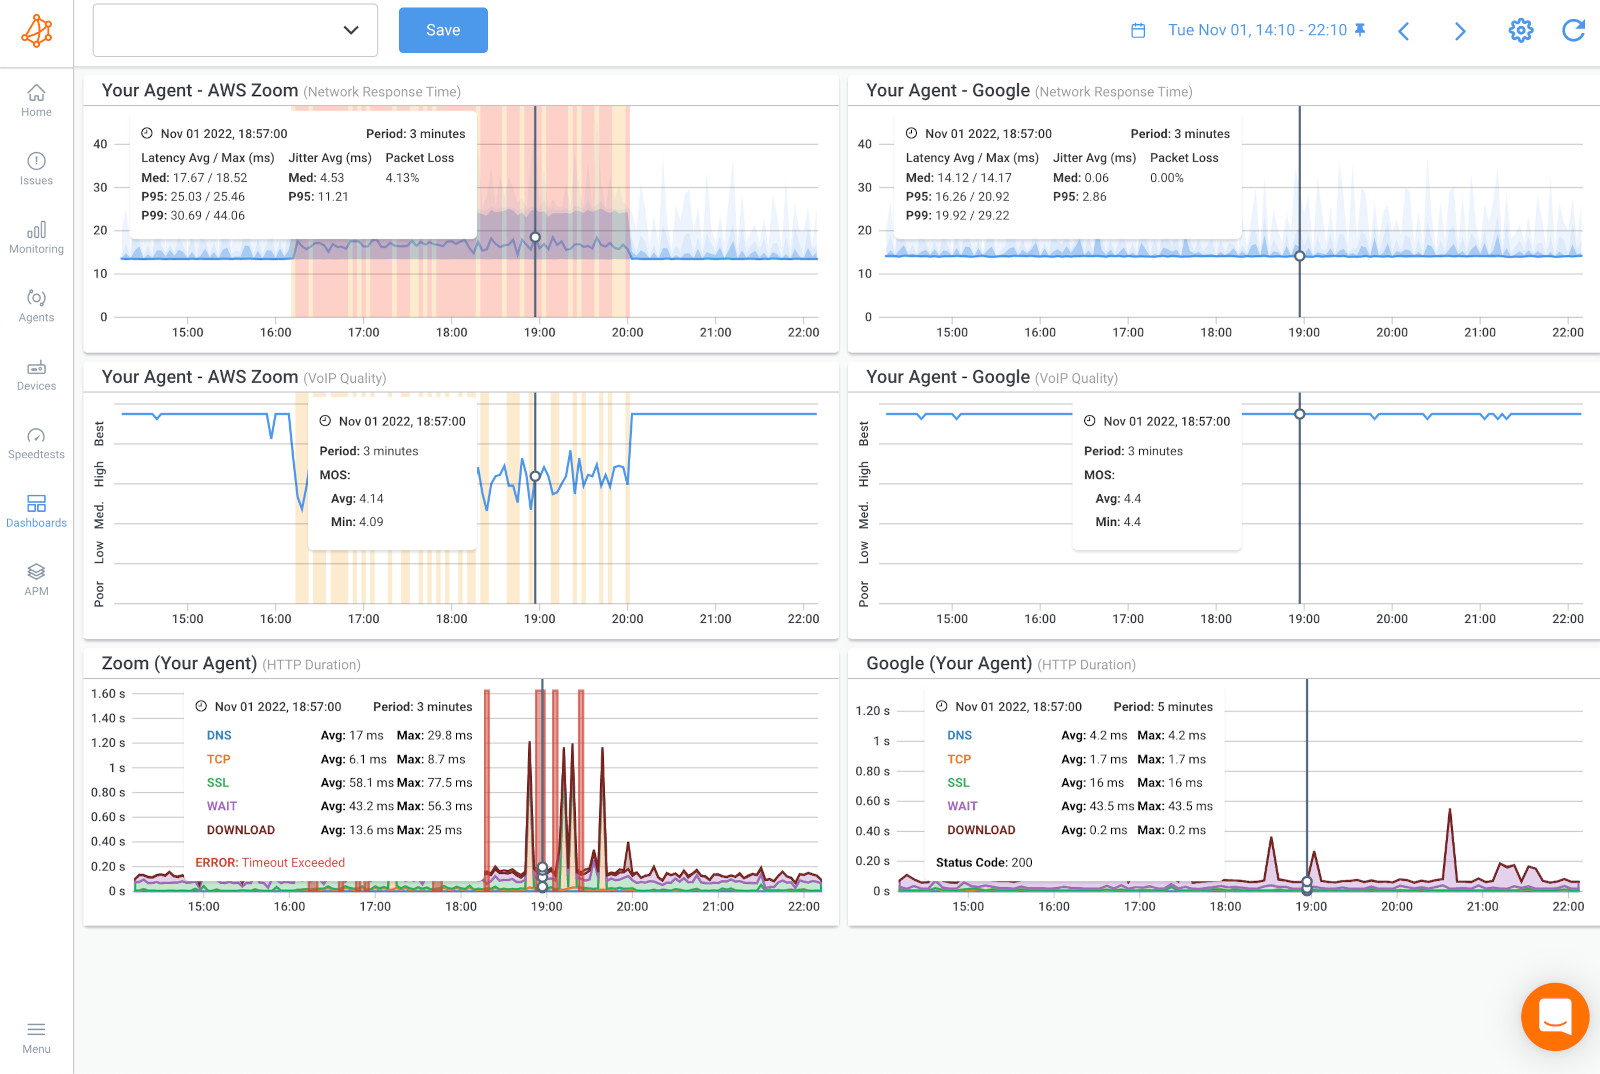

In this section, we delve into the practical applications of APM HTTP, shedding light on how this specialized monitoring approach serves as a vital tool for optimizing web applications. From enhancing the user experience to troubleshooting issues and ensuring security, APM HTTP plays a multifaceted role in the performance and reliability of web-based services. Let's explore the key use cases and benefits that make APM HTTP an indispensable asset for modern organizations.
APM HTTP (Application Performance Monitoring for HTTP) is used for several important purposes related to monitoring and optimizing the performance of web applications:
Performance Optimization: APM HTTP is primarily used to optimize the performance of web applications. By monitoring HTTP transactions, organizations can identify bottlenecks, slow-loading pages, and other issues that may hinder the user experience. This information can then be used to make necessary improvements, such as optimizing code, reducing latency, and improving server response times.
User Experience Enhancement: APM HTTP helps ensure a positive user experience. Slow-loading web pages or frequent errors can frustrate users and lead to abandonment. By tracking HTTP performance metrics and user interactions, organizations can proactively address issues that affect user satisfaction.
Issue Detection and Troubleshooting: APM HTTP tools are crucial for detecting and troubleshooting problems within web applications. They can identify issues such as broken links, HTTP errors (e.g., 404 or 500 errors), and performance degradation. IT teams can use this information to quickly pinpoint the source of problems and take corrective action.
Load Testing and Capacity Planning: APM HTTP is valuable for network load testing and network capacity planning. By simulating heavy traffic loads and monitoring how an application responds to increased demand, organizations can ensure that their web applications can handle peak traffic without performance degradation or crashes. This is especially important for e-commerce websites and other applications with variable traffic patterns.
Resource Allocation: APM HTTP provides insights into resource utilization, such as server CPU and memory usage during HTTP transactions. This data helps IT teams allocate resources efficiently and plan for infrastructure scaling when needed.
Security Monitoring: APM HTTP can also play a role in security monitoring. It can detect unusual or suspicious HTTP requests that may indicate security threats, such as distributed denial of service (DDoS) attacks or SQL injection attempts.
Compliance and Reporting: APM HTTP tools often store historical performance data, which can be used for compliance reporting and auditing. This is important for industries with regulatory requirements related to application performance and uptime.
Third-Party Service Monitoring: Many web applications rely on third-party services and APIs. APM HTTP can monitor the performance and availability of these external dependencies, helping organizations ensure that their applications function as expected, even when relying on external services.
In summary, APM HTTP is used to monitor, analyze, and improve the performance, reliability, and security of web applications. It is a critical tool for organizations that want to deliver a seamless and satisfying user experience while maintaining the health and efficiency of their web-based services.
To truly appreciate the impact and effectiveness of APM HTTP, it's often best to examine a real-world scenario. In this case, we'll dive into an actual use case that demonstrates how APM HTTP monitoring can provide invaluable insights into the performance of a website.
The screenshot provided below depicts a snapshot of APM HTTP monitoring in action. It shows a series of tests conducted at regular 60-second intervals on the https://obkio.com website. Each test represents an attempt to download the content of the URL, capturing crucial performance data along the way.

The graph above shows the network performance from one Monitoring Agent to the server hosting https://obkio.com.
Regular Intervals: The fact that tests are conducted at consistent 60-second intervals highlights the continuous nature of APM HTTP monitoring. This real-time monitoring approach ensures that any performance fluctuations or anomalies are promptly detected.
Performance Metrics: Within each test, a wealth of performance metrics is gathered. These metrics include DNS resolution times, connection times, time to first byte (TTFB), content download times, and page load times. Each metric provides a specific piece of the performance puzzle.
Historical Data: Over time, as more tests are conducted, APM HTTP accumulates a valuable historical dataset. This dataset can be analyzed to identify trends, patterns, and potential issues. For example, sudden spikes in DNS resolution time might indicate DNS-related problems, while prolonged TTFB could signify server performance issues.
With APM HTTP, you'll start collecting data and key performance indicators (KPIs) that are essential for assessing the performance of web applications, specifically in the context of downloading content from a single URL. These metrics provide valuable insights into the various stages and aspects of this process
The five APM HTTP metrics in the graph tooltip are the five steps to download the content of a single URL.
1. DNS Resolution Delay
DNS (Domain Name System) resolution delay refers to the time it takes for the DNS system to translate a human-readable domain name (e.g., www.example.com) into the corresponding IP address (e.g., 192.168.1.1). This process is essential for internet communication because computers and servers primarily use IP addresses to identify and locate each other, while humans find it more convenient to use domain names.
DNS resolution delay refers to the time it takes for these DNS-related processes to occur. Understanding DNS resolution delay is important for optimizing web performance and diagnosing network issues. Minimizing this delay ensures that users can access websites and resources quickly, contributing to a smoother internet experience.
By default the OS DNS Servers are used but it's possible to change them in the APM Template Advanced Parameters. A long DNS delay can means a few things:
- The DNS request has been lost (maybe due to heavy packet loss) and needs to be resent.
- The first DNS server used is down and after a timeout another DNS server has been queried.
- The DNS entry has a very short TTL and the authority DNS server needs to be queried again.
- The DNS server is overloaded and is not able to respond quickly.
DNS is key to URL monitoring, which is why a DNS issue must be addressed quickly. In some cases, it can affect all the users, like for example, in the case of a down or wrong configured DNS server.
2. TCP
The TCP delay is the time taken by the TCP session establishment with the TCP 3-way handshake. A long TCP delay is usually a sign of network latency or packet loss.
For the majority of the servers, the TCP handshake is done by the OS Kernel and is very fast compared to the SSL and WAIT delays. This delay can be reduce by using a CDN, more on that later in the article.
3. SSL
The SSL delay is the time taken by the SSL negotiation with the SSL handshake. An overloaded server will result into higher SSL delays. This delay can be reduce by using a CDN, more on that later in the article.
4. WAIT
Waiting for the server to respond to the request. This is often called the Time to first byte (TTFB) metric. This is a very good metric that indicates the server load and the time it takes to generate the page. If the page is using a CMS (Content Management System) with a database behind it, all the delay to get the data in the database and render the page is included in this WAIT delay.
5. DOWNLOAD
One of the most most common tactics used in URL monitoring is downloading. Download the content of the page, and if this page is a simple HTML file, the download will be very fast. It can be much longer if the content of the download is a file.
6. Status Code
The last information provided Application Performance Monitoring software tooltip is the HTTP Status Code of the request. The expected status code is 200. If the status code is 301 or 302, the URL is redirected to another page. For example:
- http://www.google.com is redirected to https://www.google.com (note the S in HTTP)
- https://google.com is redirected to https://www.google.com (the www is added to the hostname)
To really test the performance of an URL, it is recommended to use the final URL and avoid any 3xx status codes.

For all the metrics mentioned above, a degraded network with high latency and/or packet loss will result in longer delays than usual. This is why the Network Performance Monitoring features should be used to monitor and baseline the network performance metrics. This way, it's very simple to find out if bad APM HTTP monitoring results are the fault of the network or moreso of the application/server.
In the intricate landscape of web application performance, APM HTTP metrics are akin to the heartbeat, indicating the vitality of your digital assets. However, the journey of data from the user's device to the web server is a complex one, involving multiple network components and potential pitfalls. For this reason, understanding the health of your network is paramount.
I. Network-Related Challenges:
When we consider the metrics discussed above—response time, latency, time to first byte, and others—it becomes evident that a network's condition plays a pivotal role. A degraded network characterized by high latency or packet loss can significantly prolong these metrics. In practical terms, this translates to slower page load times, delayed server responses, and a subpar user experience.
II. The Role of Network Performance Monitoring:
This is precisely where Network Performance Monitoring (NPM) features come into play. NPM focuses on scrutinizing the network's behavior, providing crucial insights into latency, packet loss, bandwidth utilization, and other key network performance metrics. By continuously monitoring and baselining these metrics, organizations gain a clear understanding of the network's usual behavior and performance standards.
Learn about network performance monitoring to optimize network performance. Discover key network metrics, tools & techniques & the benefits for businesses.
Learn more

III. Differentiating Network Issues from Application/Server Problems:
The beauty of integrating NPM with APM HTTP lies in its ability to disentangle the intricacies of network performance from application or server-related issues. When APM HTTP metrics show signs of degradation, it's not always clear whether the network is to blame or if the issue originates from the application or server itself. Without NPM, finger-pointing can ensue, causing delays in issue resolution.
IV. The Power of Baselines:
By establishing baselines for network performance metrics using NPM, organizations can quickly discern whether deviations in APM HTTP metrics are attributable to network challenges or issues within the application/server stack. If network performance metrics remain within expected ranges, it becomes evident that the application or server may require attention.
V. Simplified Troubleshooting:
This harmonious integration of APM HTTP and NPM streamlines troubleshooting efforts. When APM HTTP monitoring results deviate from the norm, a glance at NPM data can provide immediate clarity. If network performance metrics are stable, the focus can shift to diagnosing and resolving application or server-related issues, saving valuable time and resources.
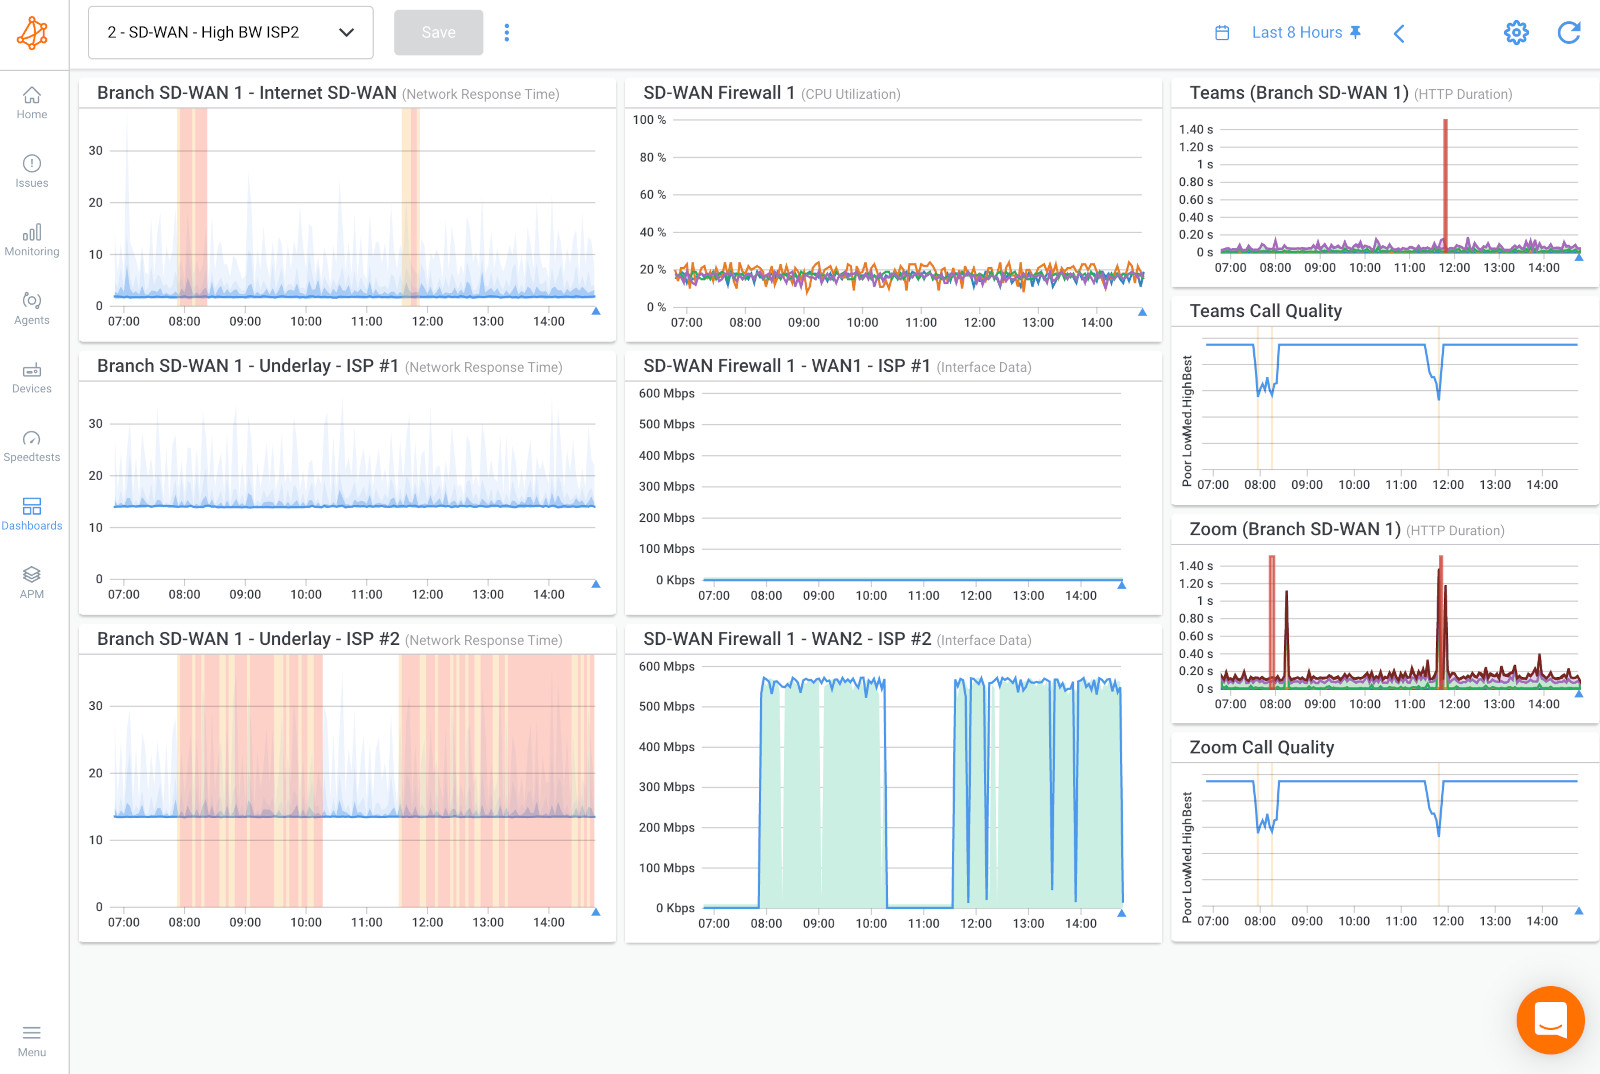
In summary, the synergy between APM HTTP and Network Performance Monitoring is a strategic approach to ensure that web applications deliver exceptional experiences. It empowers organizations to swiftly pinpoint the root cause of performance issues, whether they stem from network challenges or the application/server stack, ultimately contributing to a seamless and reliable digital presence.
Within APM, there are different subcategories or focus areas. Two of these focus areas are Application Performance Monitoring HTTP and Application Performance Monitoring Web. Here's an explanation of each:
APM HTTP, also known as HTTP monitoring, primarily concentrates on monitoring and optimizing the performance of web applications from the perspective of HTTP transactions. It involves tracking the communication between web browsers (clients) and web servers, specifically focusing on the Hypertext Transfer Protocol (HTTP) requests and responses.
Key aspects of APM HTTP include:
- Metrics Related to HTTP Transactions: APM HTTP monitors metrics such as response times, latency, status codes, DNS resolution times, connection times, and more, all related to the HTTP communication between clients and servers.
- Web Application Performance: It provides insights into how well web applications respond to user requests, including how quickly web pages load, how efficiently resources (images, scripts, stylesheets) are delivered, and how often errors occur during HTTP interactions.
- User Experience: APM HTTP often incorporates end-user monitoring (EUM), which measures the actual experiences of users interacting with web applications. It includes tracking page load times, interactions, and transaction success rates.
- Troubleshooting: APM HTTP helps identify performance bottlenecks, diagnose issues, and optimize web applications. It can pinpoint problems in various stages of the HTTP transaction lifecycle.
APM Web, on the other hand, encompasses a broader scope beyond just HTTP transactions. It focuses on monitoring the overall performance of web applications, including their client-side and server-side components, as well as the interactions with databases, external services, and APIs.
Key aspects of APM Web include:
- Comprehensive Application Monitoring: APM Web provides a holistic view of web applications, encompassing not only HTTP transactions but also the performance of server-side code, database queries, third-party service integrations, and more.
- End-to-End Transaction Tracing: It offers end-to-end transaction tracing capabilities, allowing organizations to visualize and analyze the flow of transactions across all components of a web application. This includes tracing transactions through front-end JavaScript code, backend server processing, and database queries.
- Code-Level Insights: APM Web often provides detailed insights into the performance of individual lines of code or functions within web applications, helping developers identify and resolve performance bottlenecks at a granular level.
- Comprehensive Diagnostics: APM Web tools can diagnose issues that go beyond HTTP interactions, such as slow database queries, inefficient code, and third-party service failures.
In summary, while both APM HTTP and APM Web aim to enhance web application performance, APM HTTP specifically focuses on monitoring and optimizing HTTP transactions and user experiences, whereas APM Web offers a broader, end-to-end view of web applications, including server-side and client-side components, making it suitable for more comprehensive application performance monitoring. The choice between the two depends on the specific monitoring needs and objectives of an organization.
It's important to understand that the APM HTTP monitoring feature is executing only a single HTTP request and it is NOT interpreting the downloaded content. It will not load images, styles or scripts inside a web page. Obkio's Application Performance Monitoring (APM) Web feature, on the other hand, launches a website into a browser and will load it completely, including compiling and executing all the scripts inside a page.
Obkio's Application Performance Monitoring (APM) Web feature is only available, on demand, for Enterprise customers and is developed as a custom script to test specific web workflows from a full web browser. It is with that APM Web feature that we discovered the Microsoft Login Failures Affecting Office 365 and Azure.
Contact Obkio's Team to learn more

The APM HTTP feature offers a valuable capability to assess the throughput of an Internet connection by downloading large files. Throughput, in the context of networking, refers to the rate at which data can be transmitted between two points, typically measured in megabits per second (Mbps) or gigabits per second (Gbps).
By conducting such tests, organizations can gauge the actual speed and capacity of their Internet connections, helping them make informed decisions about bandwidth needs and performance optimization.
As an illustrative example, let's consider a scenario where an organization wishes to test its Internet connection's tthroughput. To do so, they use APM HTTP to download large files from the OVH Static Download Files repository.
Below is an example of downloading a large file from OVH Static Download Files.
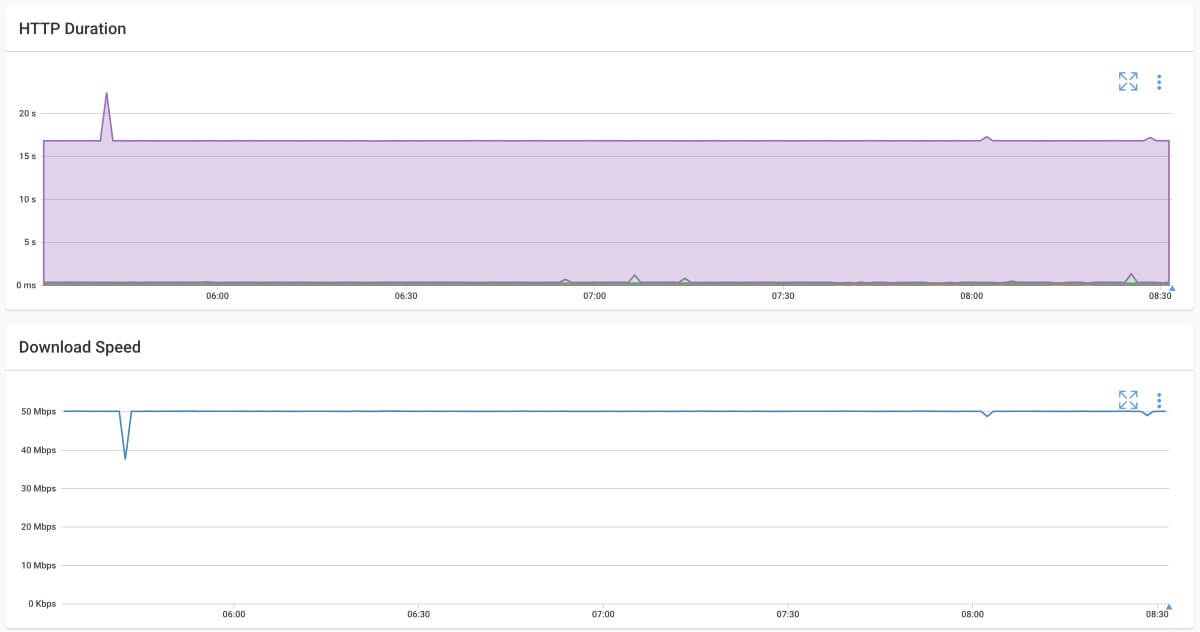
In the APM Template Advanced Parameters, specific settings can be adjusted to control the behavior of the APM HTTP test. One critical parameter is the limit imposed on the download speed. For instance, in the example mentioned, the test is configured to be limited to 50 Mbps, meaning the test will not exceed this download speed.
The APM HTTP test generates valuable data that is visualized in graphs. One of these graphs represents the download speed for each execution of the test. This graph provides a clear view of how the download speed performs over time, allowing organizations to spot trends, fluctuations, or potential issues in their Internet connection's throughput.
An important note is that the files downloaded during these tests are not stored in memory or on disk. This design ensures flexibility in the choice of file size for testing purposes. Organizations can test with files of various sizes without worrying about consuming storage resources.
However, a word of caution is necessary. Without proper rate limiting configured in the Advanced Parameters of the APM Template, conducting tests with unrestricted download speeds can saturate the local Internet connection. This saturation can lead to congestion, adversely affecting other network traffic and potentially causing disruptions in regular operations. Therefore, it's essential to set appropriate rate limits to ensure controlled testing that doesn't impact network stability.
In summary, APM HTTP testing with large files is a valuable tool for assessing Internet connection throughput. It allows organizations to make informed decisions about bandwidth requirements and performance optimization. However, responsible testing practices, including rate limiting, are essential to avoid network congestion, disruptions and network disconnections.
Learn how to monitor network speed & Internet speed with Obkio Network Monitoring tool for continuous network speed monitoring.
Learn more

The APM HTTP feature extends its utility beyond testing website performance; it can also be harnessed to assess the performance and reliability of HTTP-based APIs. APIs (Application Programming Interfaces) play a critical role in modern software development, facilitating data exchange and interaction between different systems. Ensuring the responsiveness and stability of APIs is paramount for maintaining the functionality of applications that rely on them.
Within the APM Template, advanced parameters offer a range of customization options for conducting HTTP API tests. Here's a breakdown of these customization capabilities:
HTTP Method Configuration: By default, HTTP API tests in APM HTTP use the GET method, which is commonly used for retrieving data. However, APIs support a variety of HTTP methods, including POST (for creating data), PUT (for updating data), DELETE (for removing data), and others. In the APM Template Advanced parameters, you have the flexibility to change the default HTTP method to suit the specific API action you want to test.
Adding Custom HTTP Headers: API requests often require specific headers to convey information or authentication tokens. APM HTTP allows you to include custom HTTP headers in your API calls. In the custom headers text area, each header should be on a new line, following the "HEADER: VALUE" format. This capability enables you to simulate real-world API requests accurately, including any required headers.
- Realistic Testing: Customizable HTTP methods and headers allow you to replicate the behavior of various API calls accurately. This realism is essential for identifying and addressing potential performance bottlenecks or issues in your API interactions.
- Performance Analysis: By testing API calls with APM HTTP, you gain insights into the response times, latency, and overall performance of the API. This information helps you assess how well the API performs under different conditions and loads.
- Scalability Assessment: API testing can simulate various usage scenarios, helping you understand how well the API scales to handle increased traffic or load. This is particularly important for APIs serving a large user base.
- Troubleshooting: When API tests reveal performance issues, you can use the data to troubleshoot and diagnose the root causes. Whether it's server-side delays or network-related problems, APM HTTP provides the visibility needed for effective troubleshooting.
In conclusion, the APM HTTP feature's flexibility and customization options make it a valuable tool for testing and monitoring HTTP API calls. Whether you're assessing the performance of RESTful APIs, GraphQL APIs, or other HTTP-based services, APM HTTP empowers you to conduct realistic tests and gain valuable insights into the responsiveness and reliability of these critical components of modern software applications.
Application Performance Monitoring (APM) for HTTP is a powerful tool for uncovering various performance issues within web applications. By continuously monitoring HTTP transactions and collecting data on various metrics, APM HTTP can help identify and diagnose a wide range of performance-related challenges. Here are some of the performance issues that APM HTTP can uncover:
Slow Page Load Times: APM HTTP can identify pages or resources that load slowly, pinpointing which components of the page (e.g., images, scripts, stylesheets) contribute to the delay. Slow page load times can result from issues such as large file sizes, unoptimized assets, or server bottlenecks.
High Latency: APM HTTP measures the time it takes for data to travel between the client and the server. High latency can be indicative of network congestion, long distances between servers and users, or issues with content delivery.
DNS Resolution Delays: APM HTTP monitors DNS resolution times, highlighting delays in converting domain names into IP addresses. Slow DNS resolution can impact the time it takes to initiate an HTTP request.
Connection Delays: Connection time metrics provided by APM HTTP reveal the time taken to establish a network connection with the web server. High connection delays can be caused by network issues or server-side bottlenecks.
Time to First Byte (TTFB): TTFB measures the time it takes for the server to start sending the first byte of data in response to an HTTP request. Elevated TTFB can indicate server performance problems, including database queries or server-side processing delays.
HTTP Error Rates: APM HTTP can monitor HTTP status codes, helping identify the occurrence of errors such as 404 (Not Found), 500 (Internal Server Error), and others. High error rates can signal issues with the application or server.
Resource-Specific Delays: APM HTTP can highlight delays associated with specific resources (e.g., API calls, database queries, third-party services). This helps in identifying resource-specific bottlenecks that affect page load times.
Load Balancer Performance: When load balancers are part of the infrastructure, APM HTTP can detect performance issues related to load balancing, such as uneven distribution of traffic or poorly performing load balancers.
Geographic Performance Variations: APM HTTP can reveal performance variations across different geographic regions or for users accessing the application from diverse locations. This information is critical for ensuring a consistent user experience worldwide.
Content Delivery Issues: For websites using CDNs, APM HTTP can identify issues related to content delivery, including caching problems, misconfigured CDN settings, or CDN outages.
Resource Utilization: APM HTTP can track server resource utilization, such as CPU and memory usage. High resource utilization can lead to server overload and performance degradation.
Third-Party Service Dependencies: APM HTTP can help detect performance issues caused by third-party services or dependencies, such as slow API responses or external service outages.
In summary, APM HTTP is a valuable tool for identifying and diagnosing a wide range of performance issues within web applications. It provides granular insights into the behavior of HTTP transactions, enabling organizations to proactively address performance bottlenecks, optimize user experiences, and ensure the reliability of their web applications.

Once you've implemented Application Performance Monitoring (APM) for your web application, you've unlocked a treasure trove of data and insights. These insights can be instrumental in optimizing the performance of your web application for both technical teams and business objectives.
Identifying Performance Bottlenecks: APM tools provide detailed metrics on various aspects of your application's performance. Use these metrics to identify bottlenecks and areas of improvement. For instance, if you notice that database queries are taking too long to execute, you can focus on optimizing those queries to reduce latency.
Root Cause Analysis: APM tools often offer transaction tracing, allowing you to trace the path of a request through various components of your application. This feature helps in pinpointing the exact location of performance issues, whether they are in the application code, third-party services, or the network.
Real User Monitoring (RUM): Leverage RUM data to gain insights into how real users are experiencing your web application. Identify geographical performance variations, commonly used browsers, and devices. This information can guide optimization efforts, such as optimizing for popular browsers or improving the experience for users in specific regions.
User Behavior Analysis: Understand how users interact with your application. APM can track user journeys, including clicks, navigation paths, and actions taken. Analyzing this data can help in optimizing user flows and improving the overall user experience.
Alerts and Thresholds: Set up network monitoring alerts based on performance thresholds. APM tools can notify you when performance metrics breach predefined limits. This proactive approach allows you to address issues before they impact users.
Load Testing and Scalability: APM can assist in load testing and assessing the scalability of your application. Simulate heavy traffic loads and monitor how your application responds. Use these insights to fine-tune your infrastructure for optimal performance during peak usage periods.
Best Practices for Maximizing APM Benefits:
- Continuous Monitoring: APM is most effective when it's continuous. Set up monitoring to run 24/7, providing ongoing visibility into your application's health and performance trends.
- Collaboration: Encourage collaboration between development, operations, and IT teams. APM data should be accessible to all relevant teams, fostering a culture of shared responsibility for performance.
- Data Integration: Integrate APM with other monitoring tools, such as log management and network monitoring systems. Combining data sources can provide a comprehensive view of your application's performance.
- Regular Analysis: Make performance analysis a regular part of your workflow. Regularly review APM data to spot trends, anomalies, or performance degradation early.
- Response to Incidents: Develop incident response plans based on APM insights. When performance issues arise, teams should know how to access APM data to expedite troubleshooting and resolution.
Incorporating APM insights into your workflow and adhering to best practices ensures that your web application remains high-performing, resilient, and capable of delivering an exceptional user experience. It's not just about identifying issues but also about continually improving and optimizing your application's performance.
Learn to use network optimization and monitoring to optimize network performance, improve your end-user experience, and compare performance from the past.
Learn more

In the ever-evolving digital landscape, ensuring swift and seamless website performance is a top priority. To achieve this, organizations turn to advanced solutions like Content Delivery Networks (CDN). CDNs, such as AWS Cloudfront and Azure CDN, revolutionize the way web content is delivered to end-users by leveraging a network of distributed servers strategically positioned across the globe.
The Advantages of Utilizing a CDN:
- Reduced Latency: CDNs operate on a simple principle: content is stored on servers that are geographically closer to end-users. As a result, the distance data must travel is significantly reduced, leading to lower latency. Lower latency translates to quicker loading times for web pages and a more responsive user experience. Notably, this benefits both TCP (Transmission Control Protocol) and SSL (Secure Sockets Layer) delays, optimizing secure data transmission.
- Efficient Caching: CDNs excel at caching frequently accessed content. By storing copies of web assets (e.g., images, scripts, stylesheets) on edge servers, CDNs can deliver content to users from nearby locations, reducing the load on origin servers. This not only enhances the performance but also minimizes WAIT and DOWNLOAD delays, making web pages load faster.
- Scalability: CDNs are highly scalable, capable of handling spikes in traffic without compromising performance. This scalability is especially valuable for websites with fluctuating or unpredictable visitor loads.
DNS delays can significantly impact website performance, as they involve the translation of domain names into IP addresses. To mitigate these delays on a global scale, organizations turn to global DNS server solutions like AWS Route 53.
Key Benefits of Using AWS Route 53:
- Global Reach: AWS Route 53 operates a distributed network of DNS servers worldwide. This extensive network reduces DNS lookup times for users located in various regions, enhancing the overall user experience.
- Traffic Management: Route 53 offers traffic management features that allow organizations to distribute traffic across multiple endpoints (e.g., different AWS regions or data centers). This not only improves network availability but also optimizes response times by directing users to the closest and most responsive servers.
- Health Checks: Route 53 continuously monitors the health of endpoints, automatically routing traffic away from unhealthy or underperforming resources. This ensures that users are consistently directed to responsive and reliable servers.
In conclusion, the strategic use of CDNs and global DNS server solutions is instrumental in accelerating website performance. CDNs minimize latency, optimize content delivery, and reduce server load, while global DNS solutions like AWS Route 53 enhance DNS lookup efficiency on a global scale. Together, these technologies create a faster, more reliable, and highly responsive web experience for users worldwide, ultimately benefiting businesses and end-users alike.
Certainly! Let's expand on the "Conclusion" section, including a recap of the importance of Application Performance Monitoring (APM) for HTTP URLs and a call to action (CTA) for implementing APM to enhance web application performance using Obkio:
Recap of the Importance of APM for HTTP URLs:
In the ever-evolving digital landscape, the performance of web applications plays a crucial role in shaping user experiences and determining business success. Application Performance Monitoring (APM) tailored for HTTP URLs emerges as a potent tool in the hands of developers, IT professionals, and business leaders, offering invaluable insights into the intricate workings of web applications.
From assessing critical metrics and diagnosing performance bottlenecks to optimizing user experiences and proactively addressing issues, APM for HTTP URLs provides a comprehensive approach. Through real-time monitoring and actionable data, businesses can enhance their applications, ensure seamless user interactions, and maintain a competitive edge in today's fast-paced digital realm.
As we navigate this dynamic era of technological innovation, integrating APM into our strategies becomes not just a choice but a necessity. Embrace the power of APM for HTTP URLs, and unlock the potential to revolutionize your web applications, delight your users, and pave the way for a future where performance knows no bounds.
Now that you understand the significance of APM for HTTP URLs, it's time to take action.
Obkio's Network Performance Monitoring (NPM) tool, combined with APM (Application Performance Monitoring) features, offers a range of benefits for organizations seeking comprehensive insights into their network and application performance.
- End-to-End Visibility: Monitor both network and application performance for a complete view.
- Proactive Issue Resolution: Identify and address problems before they impact users.
- Faster Troubleshooting: Streamline issue resolution by pinpointing network or app-related problems.
- Resource Optimization: Optimize resource allocation based on real-time insights.
- Improved User Experience: Enhance the user experience by aligning network and app improvements.
Make the decision to implement APM for HTTP URLs with Obkio today, and join the ranks of businesses and organizations that have transformed their web applications into high-performing, reliable, and user-friendly platforms. Your users deserve nothing less, and your business stands to gain immeasurably from the results.


 Obkio Blog


