


Application Performance Monitoring Graphs
- The different Application Performance Monitoring Graphs available
What you are going to learn:
The APM Tests page view displays the information to reach a specific URL from a specific agent. The title of the page follows this pattern: <APM-TEMPLATE-NAME> - <URL> (<AGENT-NAME>).
It contains two graphs:
- The HTTP Duration Graph
- The Download Speed Graph.
Both graphs can be added to a dashboard as a widget, which is a good practice to follow so network and application metrics can be compared easily.
HTTP Duration Graph 
The six metrics available in the HTTP Duration graph tooltip are related to the five steps required to download the content and the returned status code to reach the specified URL.
Here is an example of these metrics on the tooltip with the detailed information below.
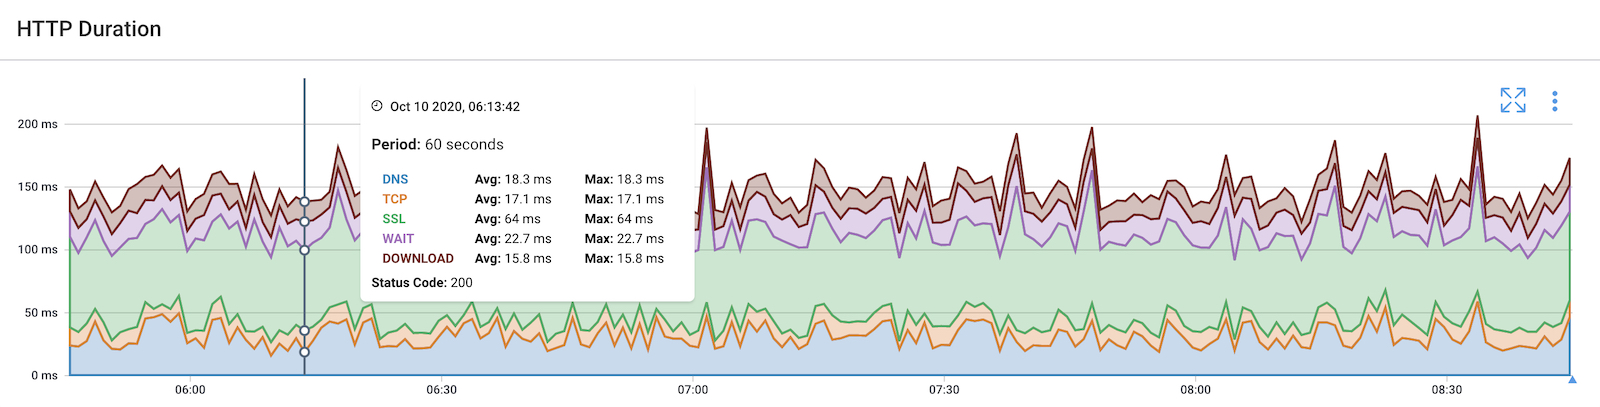
DNS: The DNS resolution delay to resolve the domain name into an IP address. This is useful to detect DNS performance issues.
TCP: The TCP delay is the time taken by the TCP session establishment with the TCP 3-way handshake. A long TCP delay is usually a sign of network latency or packet loss.
SSL: The SSL delay is the time taken by the SSL negotiation with the SSL handshake. An overloaded server will result in higher SSL delays.
WAIT: Waiting for the server to respond to the request. This is often called the Time to first byte (TTFB) metric. This is a very good metric that indicates the server load and the time it takes to generate the page. If the page is using a CMS (Content Management System) with a database behind it, all the delays to get the data in the database and render the page is included in this WAIT delay.
DOWNLOAD: One of the most common tactics used in URL monitoring is downloading. Download the content of the page, and if this page is a simple HTML file, the download will be very fast. It can be much longer if the content of the download is a file.
Status Code: The HTTP Status Code returned by the web server. The expected status code is 200. 400s and 500s error codes are leading to client side and server side issues respectively. If the returned status code is 301 or 302, this means the URL is redirecting to another page and the 3xx status codes will be shown on the top right of the screen. For example, https://google.com is redirected to https://www.google.com (the www is added to the hostname). The APM HTTP tests only the configured URL, even if this URL is redirecting to another page via 3xx status codes. To really test the performance of a URL, it is recommended to use the final URL and avoid any URL returning 3xx status codes.
Download Speed Graph
The Download Speed Graph is used to see the bandwidth used in the DOWNLOAD phase, so the amount of bandwidth used for each HTTP call is known.
A common strategy is to run an APM test used to download a large file and look at this graph to make sure the bandwidth available is consistent over time. You can read more on this strategy here.
