Scaling Up with Private Network Monitoring
- How to monitor network performance inside a private network
- How to implement end-to-end network monitoring
- How to monitor performance between offices & the Cloud
- How to monitor remote users
What you are going to learn:
This documentation article is the third part of the Onboarding Tutorials. This article follows the part 2, Identify Issues with a Two Session Network Monitoring Setup, and will start exactly where the second part left.
The goal of this tutorial is to introduce agent networks, introduce agent modes, and teach you how to leverage Obkio Network Monitoring to monitor between private locations such as branch offices, data centers, private clouds or remote users over VPN.
At the end of this tutorial, you will have 7 monitoring agents:
Branch Office 1Branch Office 2Data CenterHeadquartersPublic AWSPublic GoogleRemote User
3 agent groups:
Branches and Remote UsersHQ and Data CenterPublic Clouds
and 1 agent network:
Business Private Network
In this tutorial, we will suppose that all the business monitoring agents (i.e. all except the two public cloud agents) will use a private network to communicate. It can be a LAN, L2VPN, IPVPN, MPLS VPN, SD-WAN or Internet VPN. It doesn't matter as long as they have a connection with their private IPs.
Before we start this tutorial, let's rename the agents and group names to reflect the new setup:
- Rename the agent to
Remote User(assuming the agent has been installed on your laptop/desktop). To do so, visit theSoftwareagent page, click on...at the top-right of the page and then clickEdit. - Rename the agent
PublictoPublic AWS(or the name of the public cloud agent you previously selected). - Rename the agent
Public 2toPublic Google(or the name of the public cloud agent you previously selected). - Visit the Agent Groups page (
Menu -> Groups) and renameBusiness AgentstoBranches and Remote Users. - Create an empty agent group named
HQ and Data Center.
The last thing we will do is modify the network monitoring template with the new group we just created.
- Replace the first agent list with
HQ and Data CenterandPublic Clouds. - Replace the second list with
Branches and Remote UsersandHQ and Data Center.
With this template configuration, we will have a full-mesh between the agents in HQ and Data Center. In addition, all your agents will communicate with HQ and Data Center and Public Clouds.

By default, monitoring agents will communicate with their Public IPs. If you want to have performance monitoring between agents in the same private network, the agents must be configured in the same Agent Network.
The rule is very simple: If two monitoring agents are in the same agent network, they will communicate using private IPs instead of public IPs.
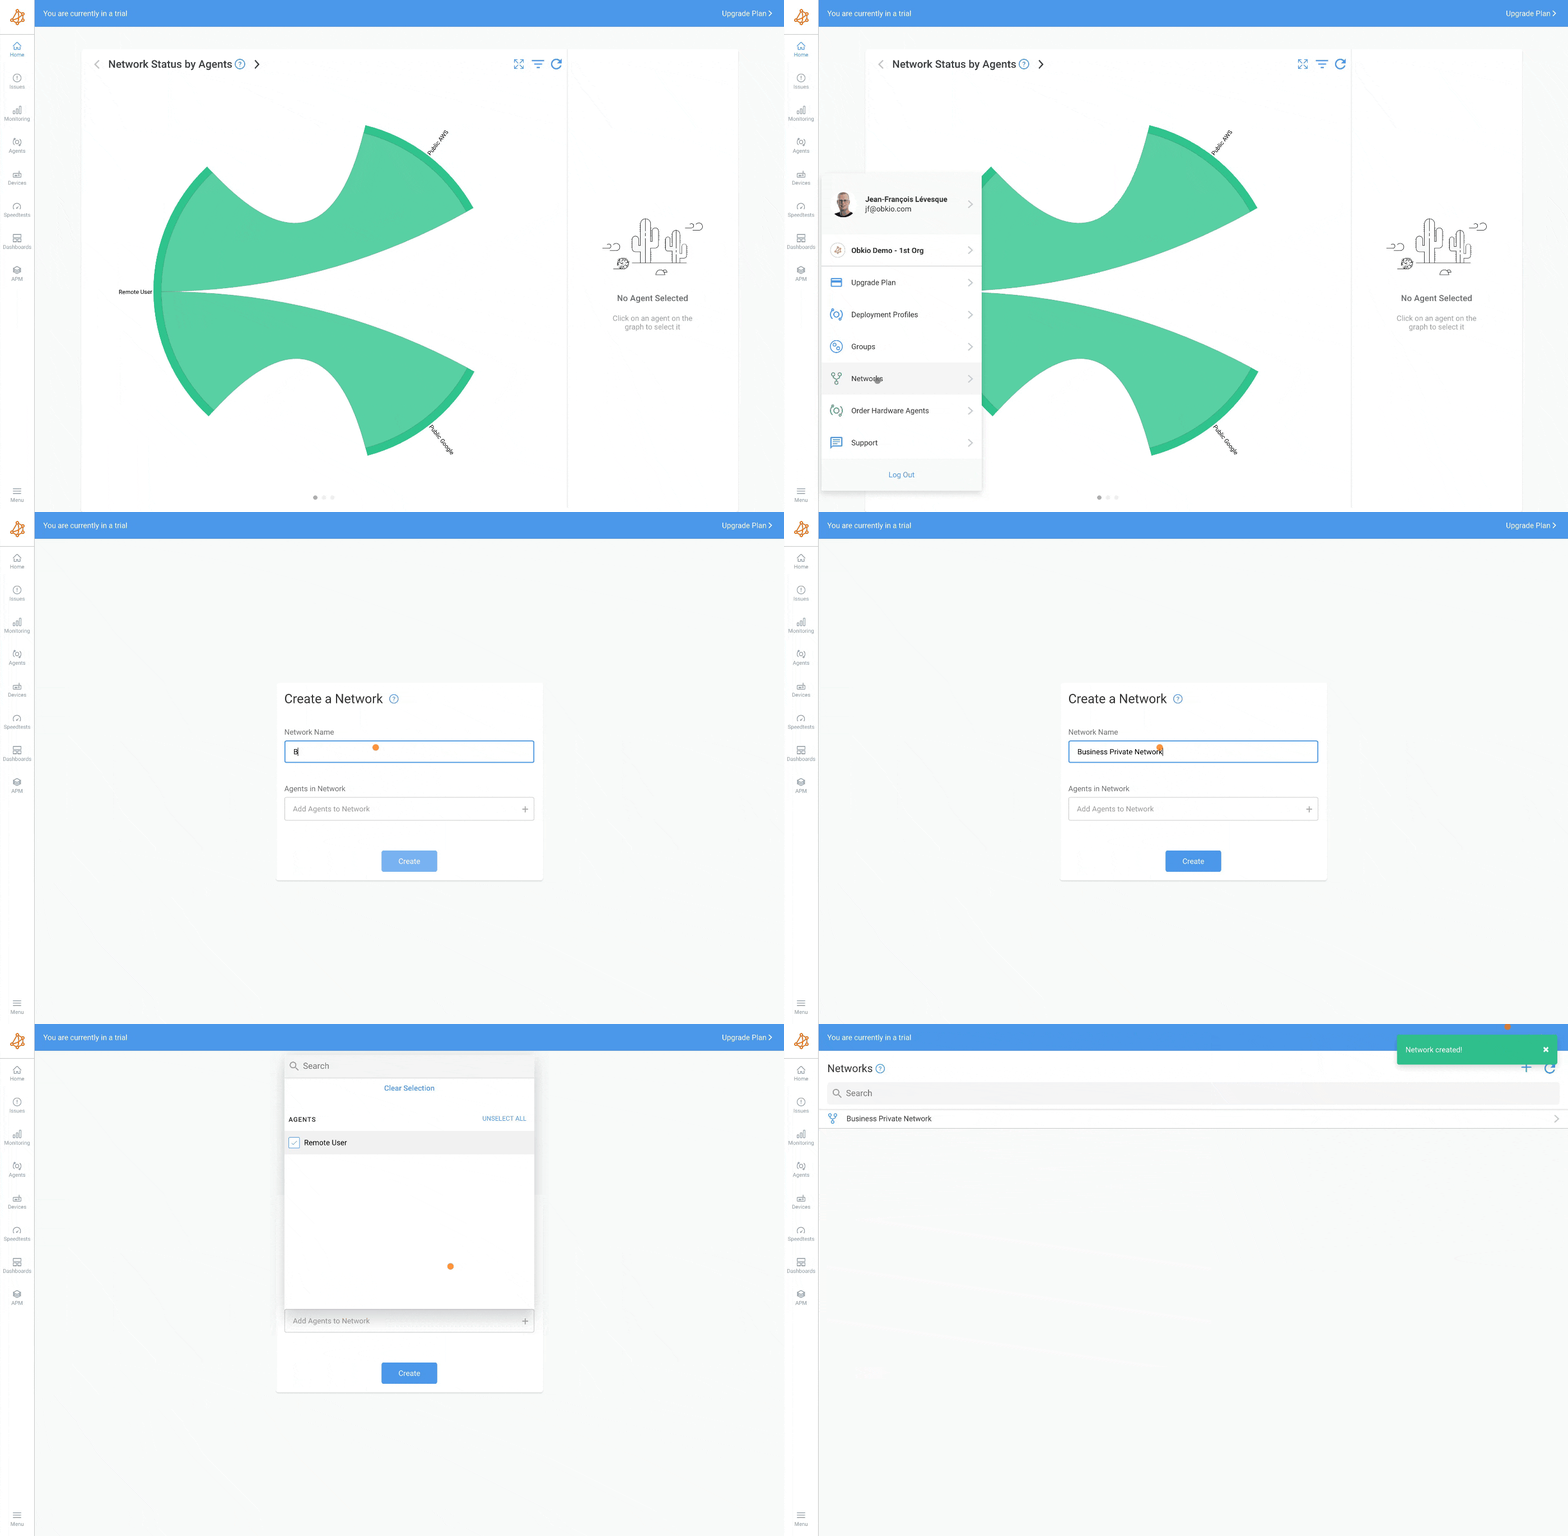
So before we continue, let's create an agent network that will be used to monitor network performance between monitoring agents on the business private network:
- Visit the Networks Menu to manage your networks (
Menu -> Networks). - For this tutorial, create the network
Business Private Network. - Assign the Software Agent created in the first tutorial to the network:
Remote User->Business Private Network

The Agent Mode will determine which agent will initiate the network monitoring session and which one will accept the incoming connection. The agent mode is selected during the creation of a monitoring agent, but it can be changed at any time in the Agent Settings.
In this mode, the agent will always initiate the connection to the server. In this tutorial, it will be used for all the agents in the group Branches and Remote Users.
The private server agent mode is used for agents that can accept connections within the same agent network. In this tutorial, it will be used for all the agents in the group HQ and Data Center.
If an agent outside the agent network needs to communicate with that agent, the Private Internet Server mode should be used and Firewalls must be configured accordingly.
It's now time to add the missing agents to complete this tutorial: Branch Offices, Data Center and Headquarters. Since we already created the agent groups and we modified the network monitoring template, we only need to create and install the agents to complete the tutorial.
We will focus on the agent creation but we will skip the installation because it really depends on the environments of your HQ, Data Center and Branch Offices.
We recommend you read the Agent Types article which gives more details on our Software (Windows, Linux, Docker), Virtual Appliance (VMware, Hyper-V) and Hardware Agents.

- Agent Type: Refer to Agent Types
- Agent Mode:
Client Only - Agent Name:
Branch Office 1 - Agent Group:
Branches and Remote Users - Agent Network:
Business Private Network - Install the agent as per the agent type instructions
- Agent Type: Refer to Agent Types
- Agent Mode:
Client Only - Agent Name:
Branch Office 2 - Agent Group:
Branches and Remote Users - Agent Network:
Business Private Network - Install the agent as per the agent type instructions
- Agent Type: Refer to Agent Types
- Agent Mode:
Private Server - Agent Name:
Data Center - Agent Group:
HQ and Data Center - Agent Network:
Business Private Network - Install the agent as per the agent type instructions
- Agent Type: Refer to Agent Types
- Agent Mode:
Private Server - Agent Name:
Headquarters - Agent Group:
HQ and Data Center - Agent Network:
Business Private Network - Install the agent as per the agent type instructions
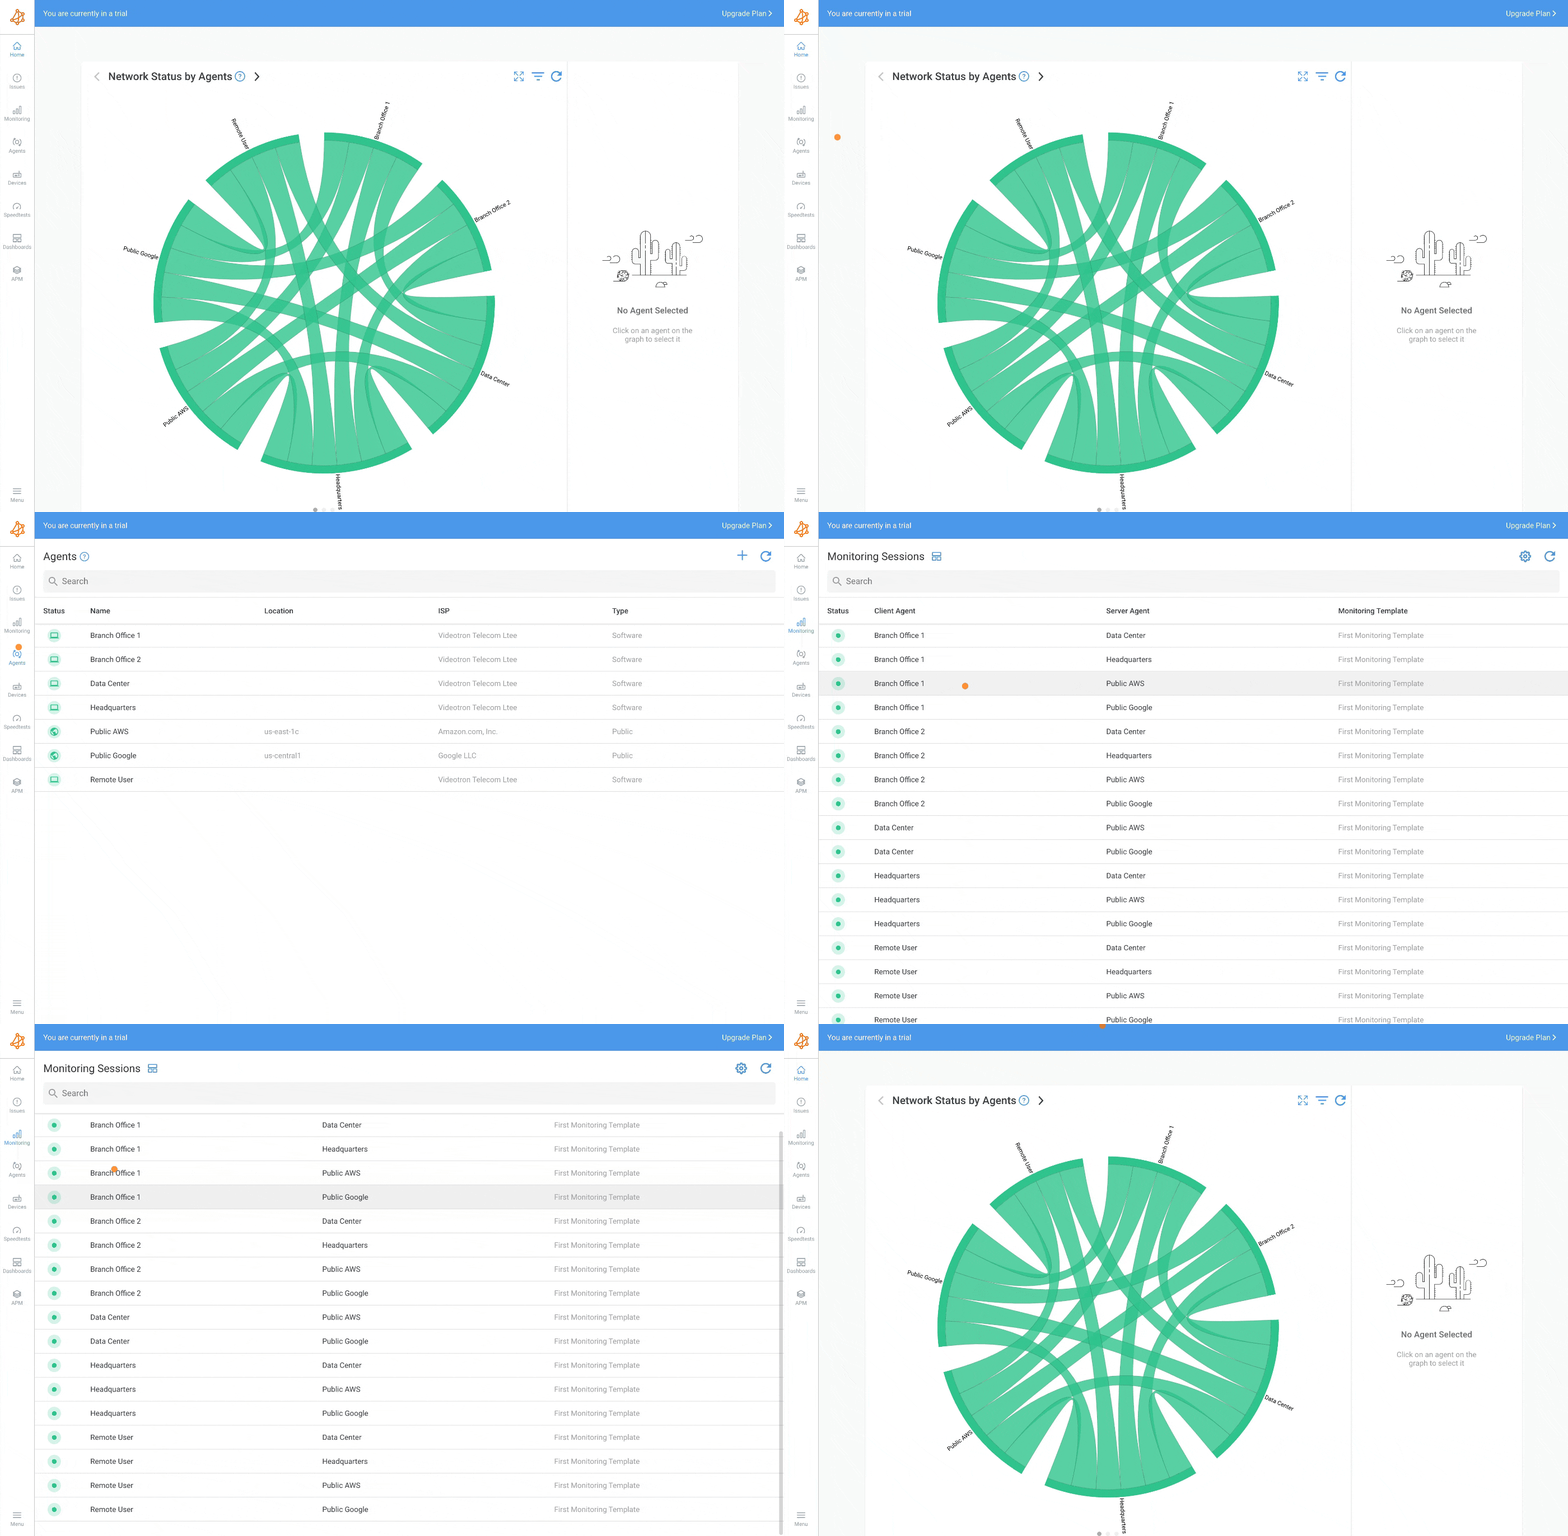
Once all the agents are created and installed, the Chord Diagram in the Home page should look like this one. No need to add the agents to the network monitoring template because we are using the agent groups.

At the end of the tutorial, you should now have 7 monitoring agents in your Obkio account, as well as 3 agent groups and 1 agent network. This setup will now allow you to continuously monitor network performance between private locations such as your branch offices, data centers, private clouds or remote users over VPN.


