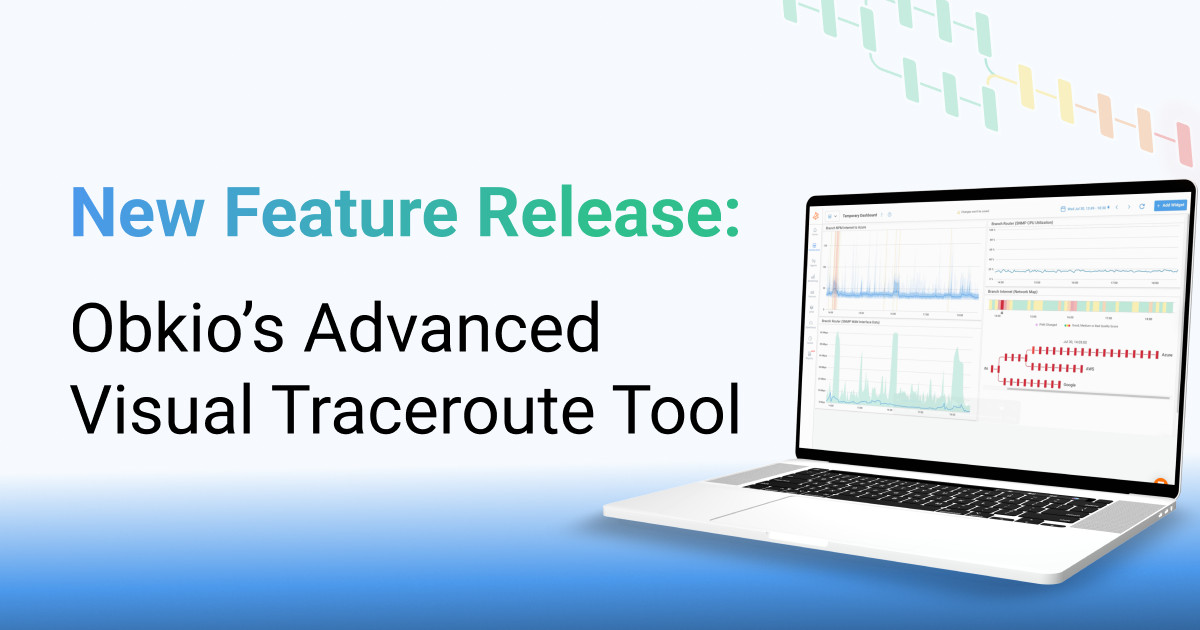
Dashboards widgets types
- What are the types of widgets that can be used in the dashboards
What you are going to learn:
There are multiple types of widgets available to create a dashboard. Here's the list with the details on each type further down in this documentation page:
- Network Metrics
- Device Metrics
- APM Metrics
- Speedtests Metrics
- Network Status Chord Diagram
- Agent System Status
Use the Network Metrics widget to get the historical network performance in terms of raw network metrics like packet loss, latency or jitter. This widget can also be used to get performance from a VoIP Quality standpoint.
To add a Network Metrics widget select the related agent, then the Monitoring Sessions and finally the type of graph.
- Related Obkio feature: Monitoring Sessions
- Source of data: UDP packets exchanged between the Obkio agents
- Types of graph:
- Network Response Graph
- This graph include packet loss, latency and jitter in a single widget,
- Latency
- Jitter
- MOS Score
- Packet loss
- VoIP Quality
- Network Response Graph
Use the Device Metrics widget to get the metrics obtained from your network equipment, like bandwidth and CPU usage, via the SNMP queries sent by the Obkio agent.
- Related Obkio feature: Device Monitoring
- Source of data: SNMP Get sent from the Obkio agent to the network equipment
- Types of graph:
- Bandwidth usage on each interface
- CPU usage
Use the APM Metrics widget to see duration or download speeds on a specific URL. This type of graph displays performance metrics from an application standpoint.
- Related Obkio feature: APM (Application Performance Monitoring)
- Source of data: HTTP requests sent from the Obkio agent to the configured URL
- Types of graph:
- HTTP
- HTTP Duration
- Download speed
- Web
- Note: This type of graph is only available in the Enterprise Plan and is developed on a custom and case-by-case basis. Contact Obkio sales team to get more information.
- HTTP
Use the Speed Test Metrics widget to get the results of the speed tests over time. You can upload and download speed tests from the manual and scheduled speed tests in this widget. When looking at aggregated data, because of the time range selected, the minimum speed test is shown on the graph and the period on the tooltip shows the aggregated period of time. If the period of time doesn’t force data aggregation, each speed test done is shown on the graph and the period on the tooltip shows N/A.
- Related Obkio feature: Speedtests
- Source of data: Speedtests between two the Obkio agents
Use the Network Status Chord Diagram widget to view *live network performance between your Obkio agents, following the monitoring sessions configuration. The chord diagram is updated every 5 minutes when used as a dashboard widget.
- Related Obkio feature: Obkio Chord Diagram
- Source of data: UDP packets exchanged between the Obkio agents
- Types of graph:
- Agent
- ISP
- Groups
Pro-Tip: The Network Status Chord Diagram can be filtered to display specific agents or agent groups (More details on Chord Diagram filtering can be found here). Multiple Chord Diagrams in a single dashboard can each be filtered to show a different perspective.
Use the Agent System Status widget to get information about the underlying host where the Obkio agent is installed.
- Related Obkio feature: Obkio Monitoring Agents
- Source of data: System metrics obtained from the underlying host.
- Types of graph:
- CPU Usage
- Memory Usage
- Network Usage
- Disk Usage
Pro-Iip: Add the Agent System Status widgets on your dashboard to make sure that the performance issues detected aren't caused by a lack of processing power on the host where the Obkio agent is installed.


