Table of Contents
Table of Contents
Even a few seconds of delay in your network can be the difference between closing a deal on a video call, or watching it buffer into oblivion. These delays, known as latency spikes, are unpredictable surges in the time it takes for data to travel across your network. Whether you're running a cloud-based CRM, managing VoIP calls across offices, or supporting remote teams on Microsoft Teams or Zoom, latency spikes can disrupt productivity, hinder performance, and lead to a flood of support tickets.
Unlike consistently high latency (which you can often plan around), latency spikes strike without warning, often disappearing before you have a chance to diagnose them. One minute, everything is running smoothly; the next, your users are reporting frozen screens, dropped calls, or painfully slow file uploads.
If you're wondering, “Why am I getting latency spikes?”, “Why does my latency spike?” or searching for “How to stop latency spikes?”, you're not alone.
While gamers frequently run into latency issues (and yes, if you're a personal user or gamer, the tips here will help you too), this guide is purpose-built for business networks.
It’s for IT teams who manage WAN and LAN performance at scale, for network administrators facing mounting user complaints, and for IT directors who want to ensure optimal service delivery across locations and cloud services.
Before you can fix a latency spike, you need to understand what it is and, more importantly, why it’s different from just “slow internet.”
Latency refers to the time it takes for a data packet to travel from its source (like a user's device) to its destination (like a cloud app server) and back. It’s typically measured in milliseconds (ms) and is a critical metric in understanding network performance.

In simpler terms, latency is the delay between when you send a request and when you get a response. Low latency means fast communication. High latency? That’s when things start to feel sluggish: video freezes, laggy mouse movements on remote desktops, or delayed voice on a call.
Several factors influence latency:
- Physical distance between endpoints (e.g., New York to London takes longer than New York to Boston)
- Network routing efficiency
- Firewall and device processing delays
- Bandwidth congestion or queuing
For IT teams, knowing your network’s baseline latency (what’s “normal” under optimal conditions) is key to identifying issues.
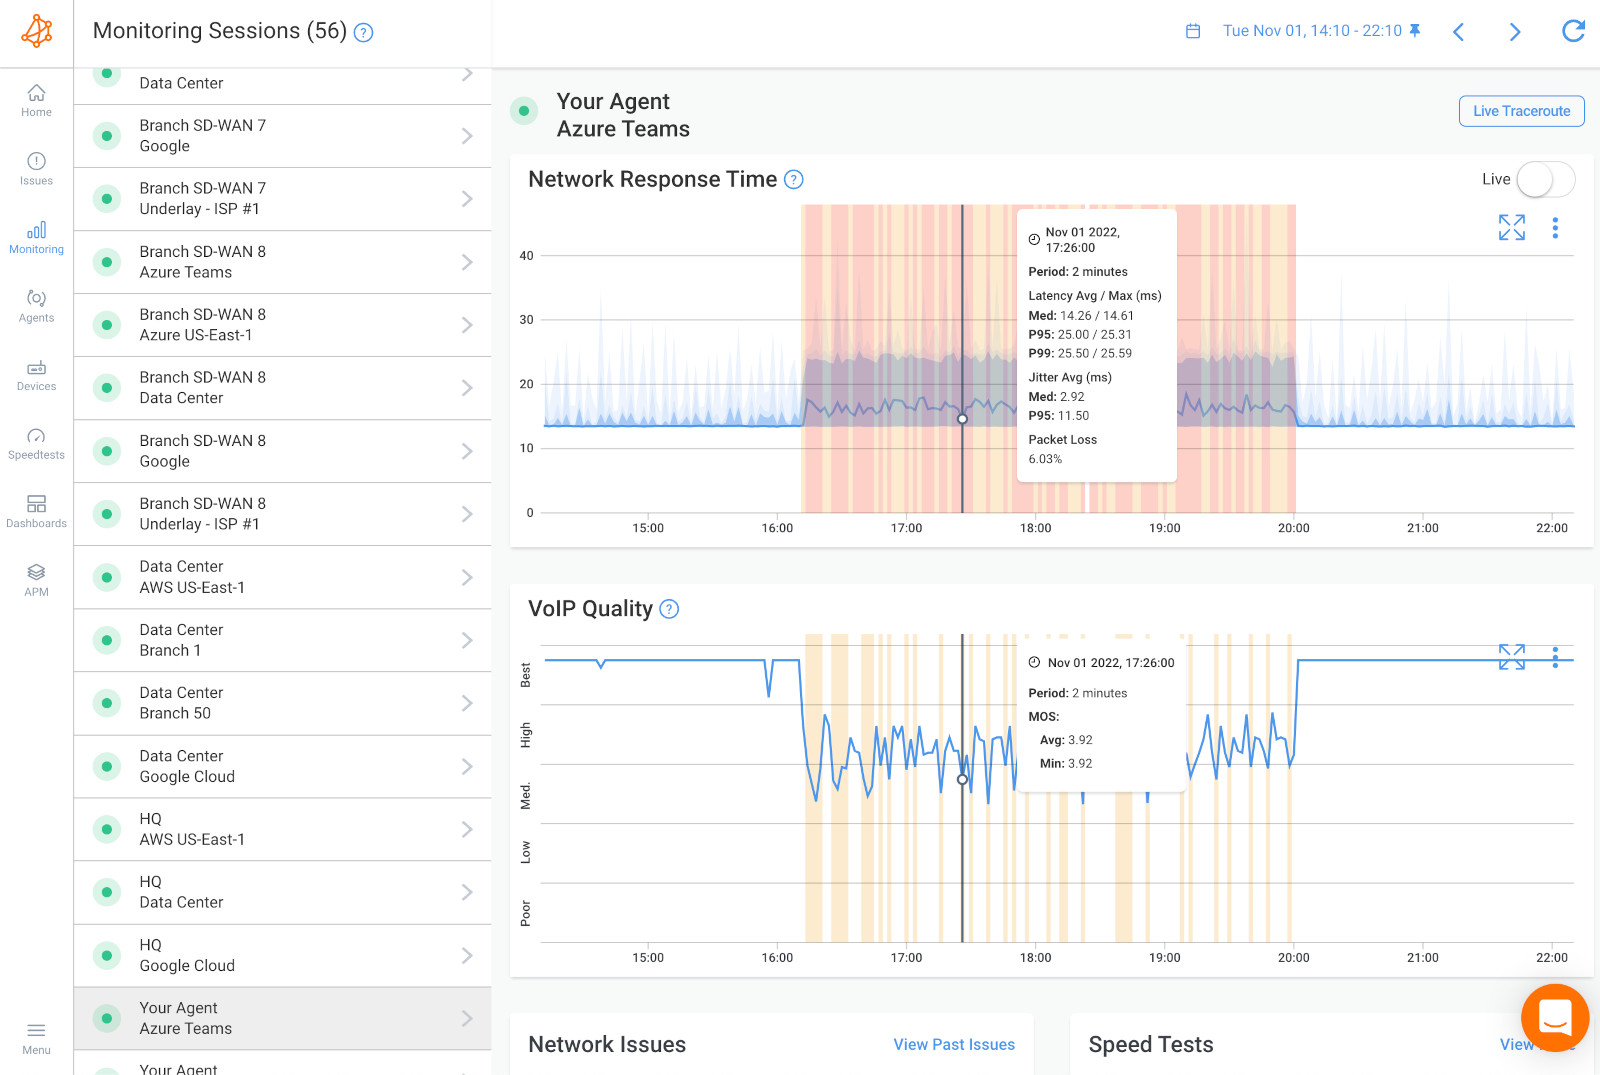
A latency spike happens when that normally stable latency suddenly jumps to an abnormally high level, often without any warning, and then drops back to normal just as fast. For example, if your network usually runs at 20 ms and suddenly jumps to 250 ms for 30 seconds, that’s a spike.
 Screenshot from Obkio's Network Monitoring Tool showing big latency spikes exactly every 5 minutes.
These spikes are not sustained like chronic high latency, but they’re just as disruptive, often more so, because of their unpredictability. They can:
- Knock people off Zoom calls mid-sentence
- Cause lag in interactive applications like VoIP or remote desktop tools
- Create inconsistent app behaviour that’s hard to replicate or diagnose
Think of high latency like always driving through traffic, you know what to expect and can plan around it. But latency spikes are like sudden roadblocks appearing at random, there’s no warning, and they throw everything off.
For IT pros, that randomness is what makes them tricky. It also makes them harder to detect with simple tools like ping or traceroute, which might miss the spike entirely if they aren’t running when the problem occurs.
Latency spikes don’t just create minor slowdowns; they break the flow of communication, disrupt critical workflows, and damage user trust in your network. For IT teams, the consequences of these momentary surges go far beyond technical annoyance, they hit productivity, user experience, and even business continuity.
Let’s break down where latency spikes cause the most pain:
VoIP calls are extremely sensitive to latency, especially when it comes in unpredictable bursts. While most systems can tolerate some degree of consistent VoIP latency, a sudden spike, even for a few seconds, can result in:
- Choppy audio or robotic-sounding voices
- Dropped words or delayed conversations
- Users talking over each other due to poor timing
For call centers, sales teams, or support staff relying on voice communication, these issues can lead to poor customer service and lost deals.
Video calls rely on real-time data transmission. A latency spike can cause:
- Frozen screens
- Audio/video desynchronization
- Dropped calls or reconnecting sessions
This is especially problematic during high-stakes meetings or remote team collaboration. Users may blame the conferencing platform (Zoom, Teams, Google Meet), but the real issue often lies within the WAN or LAN path itself.
Modern businesses rely heavily on cloud-based tools like CRMs, ERPs, file storage, collaboration apps, and more. Latency spikes can interrupt:
- Data syncs or form submissions
- File uploads/downloads
- Login sessions are timing out
This leads to frustrated users, increased support tickets, and unnecessary escalations. Worse, spikes can cause data corruption or duplicates if transactions fail mid-stream.
Are you experiencing video call issues every 5 minutes because of Mac Location Services? Learn how to fix wifi ping spikes & latency spikes on wifi.
Learn more

In hybrid work environments, employees using remote desktops or VPNs are particularly vulnerable to latency fluctuations. A spike may result in:
- Input lag on VDI sessions (typing delay, mouse stutter)
- Slow screen redraws
- Session disconnects
From the end-user's perspective, it feels like the system is broken even if the issue only lasted a few seconds.
These disruptions might seem minor in isolation, but they add up. Frequent latency spikes erode confidence in IT infrastructure, strain internal help desks, and reduce the efficiency of teams that depend on real-time digital workflows.
And here’s the kicker: because spikes are intermittent, users often report problems that IT teams can’t immediately verify, leading to time-consuming investigations without a clear resolution.
That’s why understanding, diagnosing, and proactively addressing latency spikes is crucial, not just for performance, but for maintaining trust and uptime across the organization.

To troubleshoot and fix latency spikes at the source, you need to know where they’re coming from. These unexpected spikes can come from within your internal LAN, across your WAN or internet connection, or even from a combination of both.

Let’s take a look at a breakdown of the most common culprits behind these unpredictable spikes and where they typically occur.
When too much data competes for limited bandwidth, the network gets congested, just like rush hour traffic. This can result in queuing delays, where packets are held up by buffers or dropped and retransmitted, causing sharp latency spikes.
Occurs in: LAN & WAN
- LAN Congestion Example: Backup jobs running during work hours on a local switch, choking bandwidth for VoIP phones.
- WAN Congestion Example: A branch office with limited bandwidth sending large files to the HQ over VPN.
🔧 Tip: Monitor bandwidth usage and identify peak usage times. Consider implementing QoS or scheduling large transfers during off-hours.
Aging hardware or incorrect network device settings can introduce delays. Faulty switches, misconfigured VLANs, or overloaded firewalls can delay packet forwarding, creating latency spikes that ripple across your LAN.
Occurs in: Primarily LAN
- Example: A misbehaving Layer 2 switch introduces inconsistent delay for all traffic passing through it.
🔧 Tip: Regularly audit firmware versions, CPU/memory loads, and device logs. Replace failing components before they degrade performance.
Quality of Service (QoS) is meant to prioritize critical traffic, but if configured incorrectly, it can have the opposite effect. If VoIP traffic is not prioritized, it may end up in low-priority queues, causing delays during periods of congestion.
On the other hand, if too many applications are marked as high priority, the network becomes overloaded with "critical" traffic, defeating the purpose of prioritization and resulting in queue congestion, packet delays, and ultimately, significant latency spikes for the services that actually need low-latency delivery.
Occurs in: LAN & WAN
- LAN Example: Internal traffic, like video streams being marked as high-priority over business apps.
- WAN Example: Improper DSCP tagging not being respected by the ISP, resulting in VoIP and business apps competing with bulk transfers.
🔧 Tip: Review your QoS policies and limit “priority” status to business-critical apps only.
Latency spikes can also stem from routing inefficiencies or changes across the Internet or your WAN provider’s backbone. Dynamic routing protocols (like BGP or OSPF) may shift paths due to congestion, maintenance, or flapping links.
Occurs in: Primarily WAN
- Example: Your packets suddenly take a longer path through an ISP’s congested data center instead of the optimal route.
🔧 Tip: Use traceroute or multi-point monitoring tools to detect path changes. SD-WAN solutions can provide more intelligent route control.
Loose cables, failing transceivers, or overheating ports can cause bursty and unpredictable latency. These issues may not cause total outages but can intermittently impact performance.
Occurs in: LAN & WAN
- LAN Example: Failing port on a top-of-rack switch drops packets randomly.
- WAN Example: A faulty fibre transceiver at a branch site introduces delay before failover kicks in.
🔧 Tip: Check hardware logs and SNMP alerts for CRC errors or temperature warnings. Replace flaky components proactively.
Wi-Fi is inherently more prone to latency fluctuations than wired connections. Interference from other devices, overlapping channels, and physical obstructions can cause sudden retransmissions and delays.
Occurs in: LAN (Wi-Fi networks)
Example: Conference room full of devices causing 2.4GHz interference, disrupting remote presentations.
🔧 Tip: Use 5 GHz or Wi-Fi 6 where possible, analyze channel usage, and avoid placing access points near microwaves or dense materials.
Uncover what causes high latency in your network and how you can troubleshoot. Learn to identify congestion, QoS issues and more causing network delay.
Learn more

Diagnosing latency spikes is like solving a mystery: the culprit isn’t always obvious, and the symptoms can be misleading. Since these spikes are often brief and irregular, your usual troubleshooting tools (like ping or traceroute) might not catch them in action.
To proactively and quickly identify what’s causing latency surges in your network, you’ll need to rely on continuous network performance monitoring to monitor latency levels and drill down once a latency spike occurs anywhere in your network.
The most reliable way to catch latency spikes is by using a dedicated network and latency monitoring solution that continuously collects data and provides visibility into your entire network path, from the LAN to the WAN, to cloud services.
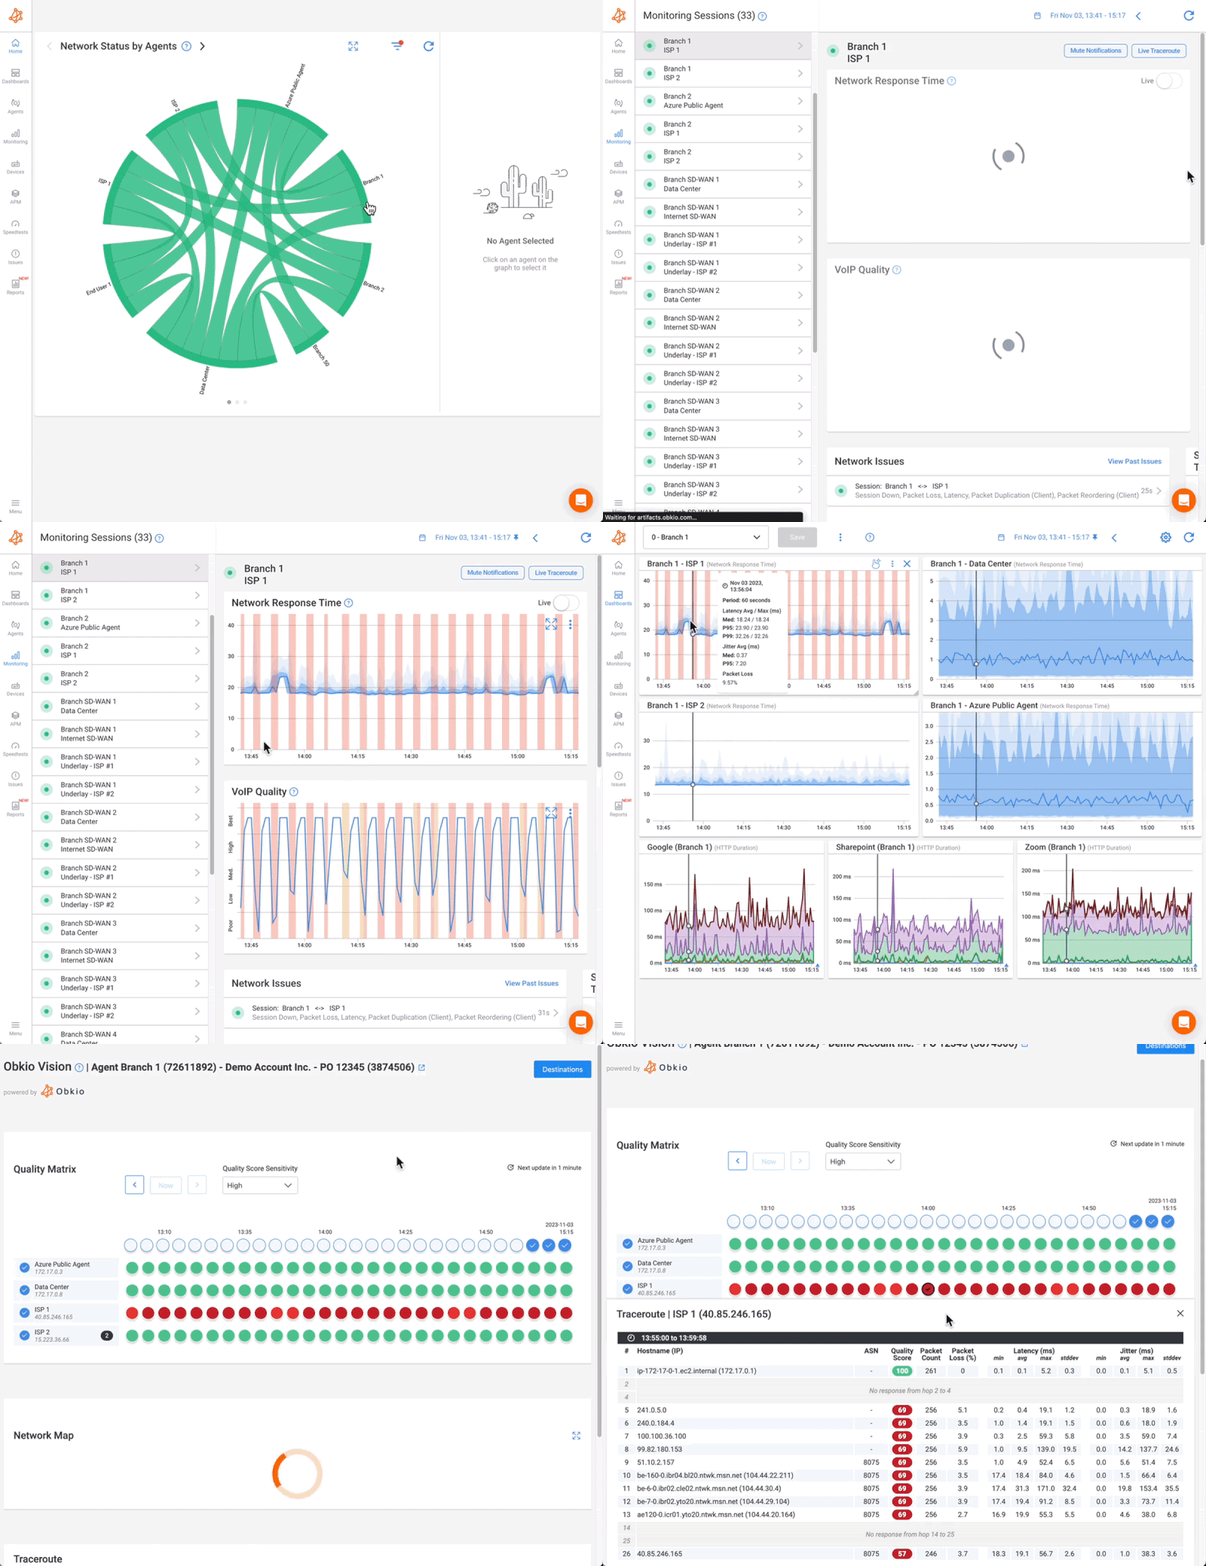
Obkio’s Network Latency Monitoring Tool is purpose-built for this. It continuously tests and measures the network performance between multiple Monitoring Agents (deployed in your local network, remote sites, or public clouds like AWS, Azure, Google Cloud).
Obkio continuously generates and measures synthetic traffic to measure metrics like latency and notify you as soon as spikes occur using real-time latency graphs, historical trends, and alerts.
Want to get started? Check out Obkio’s in-depth guide on how to measure latency.
The most effective way to measure and diagnose latency is with a synthetic network performance monitoring tool like Obkio. Unlike basic tools like speed test and ping that only provide average latency data or static snapshots, Obkio continuously simulates traffic across your network, giving you real-time and historical visibility into:
- Latency levels
- Packet loss
- Jitter
- Bandwidth utilization
This is critical for spotting short-lived but highly impactful latency spikes that traditional tools might miss.

Latency spikes don’t just happen in one place, they can originate from internal LAN traffic, ISP routing, cloud performance, or even overloaded endpoints. That’s why it’s essential to deploy monitoring agents across your entire infrastructure, including:
- Head offices
- Branch locations
- Remote users
- Cloud platforms (e.g., Microsoft Azure, AWS, Google Cloud)

Obkio uses lightweight agents to simulate and measure traffic every 500ms, ensuring you catch even intermittent latency spikes in real-time. This helps isolate where latency spikes are happening, whether it’s your internal network, a service provider, or the destination server. You can deploy:
- Local Agents in target locations (Windows, macOS, Linux supported)
- Public Monitoring Agents to simulate Internet paths and detect whether the problem is internal or provider-related
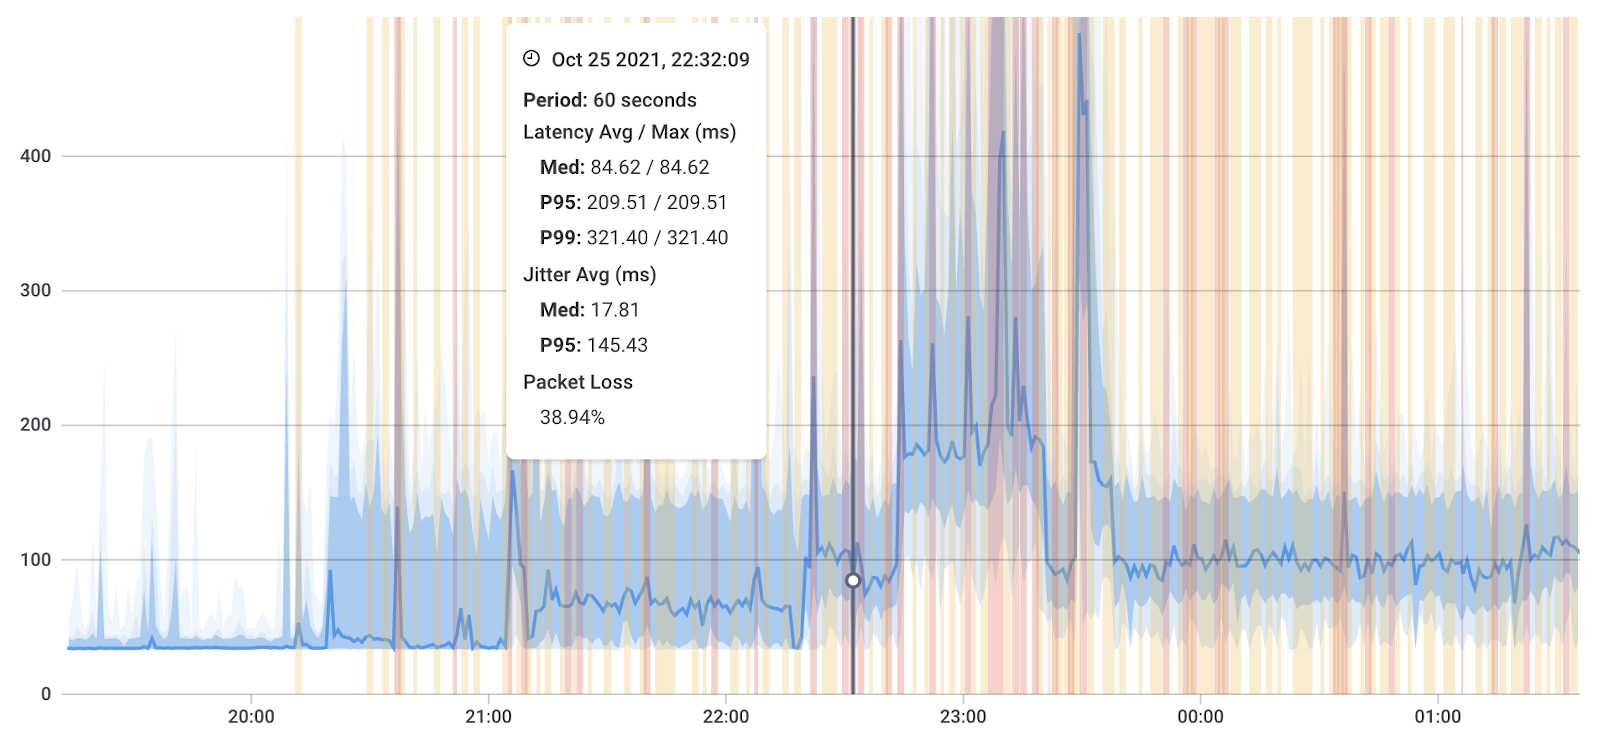
Once agents are deployed, Obkio begins collecting latency data continuously. You can view this data on the Network Response Time Graph, where updates are displayed every minute.
Key metrics to monitor:
- Latency (ms): Is it within expected thresholds?
- Jitter: Is the variation affecting real-time apps?
- Packet Loss: Are packets getting dropped during spikes?
Also look for:
- Patterns: Does the spike happen during backups? Zoom calls? 9 AM logins?
- Affected applications/users: Is it isolated or widespread?
- Obkio helps you compare against your baseline latency to see what’s “normal” and what’s not.
Latency is contextual. What’s “bad” for VoIP might be acceptable for file sharing. Use these general guidelines:

Latency consistently over 500 ms is typically considered critical for most environments.
So, a latency spike could be considered anything that pushes latency:
Over 100–150 ms for real-time apps like VoIP, Zoom, Teams
Over 200 ms for cloud applications or VPN users
Consistently higher than your usual baseline for any critical service
A latency spike is often defined by a sudden and significant increase from your normal latency. For example, if your baseline is 20 ms, and you suddenly see 80–100 ms, that’s a clear spike.
Short bursts (lasting seconds) can still cause call drops or app freezes
Sustained spikes (minutes or more) may indicate congestion or misconfigurations
Latency variability (high jitter) is also a form of performance degradation, even if average latency is acceptable
Discover what defines good latency in networking, why it matters & how to measure, troubleshoot and improve it for seamless performance across your network.
Learn more

Many tools show average latency, but this can hide real problems. Obkio uses data aggregation and percentile reporting to highlight the worst-case latency within any period. For example:
An average latency of 60 ms might seem fine until you discover that during one 4-hour block, it spiked to 800 ms for 10 minutes.
Obkio displays those outliers, so you're not blindsided by hidden performance degradations.

Static threshold alerts can be noisy or too broad. To identify latency spikes, set alerts based on both absolute thresholds and sudden deviations from normal performance. Obkio takes a smarter approach by:
- Alerting based on deviations from historical baselines
- Factoring in the specific latency profile for each location
- Notifying teams only when there's a meaningful change
Latency spikes aren’t always about hitting a fixed number, sometimes a sudden jump is abnormal even if it's not huge in absolute terms. Configure alerts for:
Sudden increases from baseline (e.g. a 3× increase in 1–2 minutes)
High jitter (i.e., variability in latency), which disrupts voice/video apps
Latency deviations above X% of average over a moving time window (e.g., > 50% above average over 5 minutes)
This reduces false positives and helps IT teams react to genuine issues faster.
Once you’ve confirmed a latency spike, the next step is to dig deeper and pinpoint the root cause using advanced diagnostics:
- Device Monitoring: Check for high CPU usage or bandwidth saturation on firewalls, routers, or other key devices. These can introduce local delays that look like network issues but are actually device-level bottlenecks.
- Visual Traceroutes (Obkio Vision): Map every hop between the source and destination to identify exactly where the latency is introduced. This helps you determine whether the issue lies within your internal network, your ISP, or somewhere in the middle.
- Session Comparison: Compare performance across multiple network paths — like Branch → HQ vs. Branch → Google Cloud — to understand if the spike is isolated to one path or affecting multiple routes. This can reveal whether the issue is local, regional, or provider-based.

Use these insights to:
- Determine if the issue is isolated or widespread
- Identify if the root cause lies with your ISP, a misbehaving router, or an overloaded firewall
If latency appears only on a single path, the issue is likely destination-specific. If it appears across multiple paths, suspect congestion or hardware limitations closer to the source.
Latency isn't a one-time fix. Even after resolving an issue, continuous monitoring ensures:
- You catch new spikes before they disrupt service
- Optimize routing and application performance over time
- Maintain SLA compliance and reduce support escalations

- 14-day free trial of all premium features
- Deploy in just 10 minutes
- Monitor performance in all key network locations
- Measure real-time network metrics
- Identify and troubleshoot live network problems

Start by gathering contextual clues. Do spikes:
- Happen during specific times (e.g., 9 AM logins, lunch breaks)?
- Align with scheduled backups, cloud syncs, or software updates?
- Affect certain users or locations more than others?
Correlating user complaints with timestamps can help you narrow down the pattern and determine whether the issue is tied to bandwidth demand or specific business processes.
Pro Tip: Create a log of reported issues. Even a basic spreadsheet tracking spike occurrences can reveal useful trends.
To recognize a spike, you first need to understand your network’s normal latency. Every environment has a baseline of what’s “healthy” for your office, data center, or cloud path.
With monitoring tools like Obkio, you can:
- Set custom thresholds for what constitutes a spike
- Visualize latency over time across different network paths
- Instantly see when performance deviates from the norm
This helps you separate real latency problems from background noise or minor fluctuations.
Latency spikes rarely happen in isolation. They often correlate with other performance metrics that tell a more complete story:
- Packet Loss: May indicate congestion, routing issues, or faulty hardware
- Jitter: High jitter values usually accompany spikes and disrupt real-time traffic like VoIP
- Throughput Drops: A sudden drop in throughput alongside a spike may point to network congestion or bandwidth exhaustion
By correlating these metrics, you’ll gain deeper insight into what’s happening and why.
Learn the difference between latency and jitter, their impact on network performance, and how to measure and reduce them with the best tools.
Learn more

It’s tempting to start the diagnosis from the network core but the best practice is to begin from the edge and work your way in.
Start with:
- The affected user’s endpoint
- Local Wi-Fi or switch
- LAN performance
- Then move to WAN or cloud path analysis
This approach ensures that local issues (like wireless interference or faulty cables) aren’t mistaken for larger infrastructure or ISP problems.
Once you’ve identified that latency spikes are affecting your network, the next step is to take targeted action to eliminate them at the root. The goal is not just to resolve the spike in the moment, but to strengthen your network against future disruptions.
Here’s a practical, step-by-step process to fix latency spikes and restore optimal performance across your LAN and WAN environments:
The most critical part of fixing any network issue is proper scoping. Latency spikes can be local (LAN), external (WAN), or isolated to a specific device, path, or application.
Start by answering:
- Are only certain users or sites experiencing spikes?
- Are the spikes occurring between your office and cloud platforms (e.g., Microsoft 365, AWS)?
- Are they happening within your local office network, such as between a workstation and a VoIP server?
Using monitoring tools like Obkio, you can:
- Pinpoint latency spikes to a specific location or path
- Compare different sessions (e.g., Office A → Cloud vs. Office A → Office B)
- Identify if the issue lies within your ISP, on your internal devices, or in the path to the cloud
✅ Fixing latency starts with knowing where it’s happening.
If latency spikes occur during peak usage hours, your traffic may be competing for limited resources. That’s where QoS (Quality of Service) comes in.
QoS allows you to:
- Prioritize time-sensitive traffic (VoIP, video conferencing, remote desktop)
- Deprioritize non-essential services (cloud backups, software updates, media streaming)
- Prevent "bandwidth hogs" from degrading real-time apps
Actionable QoS Tips:
- Define traffic classes and tag packets with DSCP or CoS markings
- Implement traffic shaping and queuing policies on routers, firewalls, and switches
- Coordinate with your ISP to honour QoS policies across the WAN (especially important for MPLS or SD-WAN environments)
A well-configured QoS policy ensures your most critical applications stay responsive, even during heavy load.
Sometimes the problem isn’t about configuration, it’s about network capacity. Even the best-managed network will spike under the pressure of oversubscription or excessive bandwidth consumption.
Here’s how to regain control:
- Identify bandwidth drains: Video streaming, file syncing apps (OneDrive, Dropbox), software updates
- Throttle or schedule non-essential tasks: Move backups to off-peak hours
- Review and upgrade WAN links if you're consistently exceeding bandwidth thresholds
- Monitor top talkers and applications with NetFlow, SNMP, or Obkio’s device monitoring to understand traffic patterns
Balancing what’s running on your network is often the fastest way to reduce latency spikes without new hardware.
Faulty or overworked hardware is a frequent but overlooked cause of latency. Devices like firewalls, switches, and routers may silently degrade over time, introducing unpredictable delay.
Common symptoms of hardware-related spikes:
- Spikes isolated to a single site or VLAN
- Unexplained jitter or packet loss
- High CPU usage on edge routers or firewalls
How to respond:
- Check device logs and SNMP traps for errors, high resource usage, or dropped packets
- Update firmware, especially for aging switches or access points
- Replace aging equipment with modern, multi-gigabit-capable devices
- Use dual WAN ports or load balancers to distribute traffic and avoid bottlenecks
If a device is consistently at 90%+ CPU or memory during business hours, it’s no longer "just working" it’s a ticking latency time bomb.
Fixing the issue once isn’t enough, you need to ensure it doesn’t come back. That’s where continuous, proactive monitoring becomes essential.
Set up:
- Real-time latency dashboards and alert thresholds
- Historical graphs to compare performance over time
- Multi-location agents to triangulate issues (e.g., office, data center, public cloud)
With a solution like Obkio:
- You can detect spikes within seconds of their occurrence
- Get alerted based on deviations from normal performance (not just static thresholds)
- Maintain a complete audit trail of every latency event, with actionable insights
Proactive monitoring turns your network team from firefighters into foresight-driven engineers.
Not all latency problems are persistent. Some appear suddenly, disrupt everything for a few seconds or milliseconds, and vanish before you can hit "trace route." These are intermittent latency spikes, and they’re among the most frustrating issues for IT teams to detect, diagnose, and resolve.

Intermittent latency spikes are unpredictable surges in latency that happen sporadically, without warning or clear patterns. Unlike consistent high latency or ongoing congestion, these spikes:
- Occur briefly, often lasting just seconds or even milliseconds
- Impact real-time applications significantly, even if they’re short-lived
- Frequently resolve themselves before diagnostics can begin
They're especially disruptive in environments that rely on low-latency performance, such as:
- Video conferencing (Zoom, Teams)
- VoIP calls
- Online collaboration tools
- Cloud-based workflows
- Gaming platforms (for personal users or B2C service providers)
Because of their brief nature, these spikes are:
- Hard to detect with basic tools like ping or traceroute, which only provide point-in-time snapshots
- Difficult to reproduce in lab environments or testing scenarios
- Tricky to attribute to a specific device, path, or process, without persistent monitoring in place
Here are the most common (and sneaky) culprits behind these elusive disruptions:
1. Network Congestion Bursts (LAN & WAN)
Sudden surges in traffic, like mass file uploads, automated backups, or simultaneous logins, can momentarily overload links or devices. Even if total bandwidth capacity seems sufficient, burst traffic can overwhelm interfaces for a few seconds and cause a sharp latency spike.
2. Wi-Fi Interference (LAN)
Wireless networks are more prone to transient issues. Nearby access points on the same channel, signal noise, or even microwave ovens can cause sporadic delays for specific users. These issues often fluctuate with environmental changes or user movement.
3. Intermittent Hardware Issues (LAN & WAN)
Failing ports, loose cables, overheated components, or unstable power supplies may degrade performance sporadically. These faults rarely appear in static diagnostics but can cause momentary latency as packets get queued, retransmitted, or dropped.
4. Routing Instability (WAN)
Dynamic route changes (e.g., BGP flapping) or ISP-level adjustments can cause traffic to temporarily reroute through suboptimal paths. These changes can occur without notice and may last just long enough to impact real-time communication.
5. Background Processes & Scheduled Tasks (User Devices or Servers)
Security scans, OS updates, or auto-sync processes (like Dropbox or OneDrive) running in the background can consume bandwidth or processing power, leading to short bursts of latency, especially if they occur during business hours or meetings.
Because these spikes are fleeting, traditional troubleshooting methods won’t cut it. You need tools and techniques designed for continuous visibility and contextual analysis.
Use persistent monitoring tools like Obkio that simulate traffic every 500ms and log every fluctuation over time. These tools can:
- Detect micro-spikes that static tools miss
- Trigger alerts based on deviations from your network's normal behaviour
- Provide latency graphs with second-by-second granularity

Match up latency events with:
- Scheduled software tasks or automated updates
- System logs from routers, switches, or firewalls
- User complaints and support tickets that mention specific times
This correlation helps you link spikes to real-world events and narrow down their origin.
Deploy monitoring agents in:
- Offices
- Data centers
- Public cloud regions (AWS, Azure, Google Cloud)
This helps you determine whether the spike is localized (e.g., Wi-Fi in Office A) or path-specific (e.g., only occurring when connecting to Azure).
By measuring from multiple angles, you can triangulate the problem and isolate whether it's:
- Internal (device, endpoint, or local network)
- Provider-related (ISP, routing path)
- External (cloud service region or geographic route)
Fixing a latency spike is reactive. Preventing them altogether is strategic. Fixing latency after it happens is fine, but let’s be honest, it’s way better if it doesn’t happen at all. Here are three ways to keep your network running smoothly and avoid those annoying slowdowns in the first place.
SD-WAN is one of the most effective ways to combat latency issues across your WAN. Unlike traditional static routing, SD-WAN uses software to dynamically choose the best-performing path for your traffic, based on real-time conditions.
How SD-WAN Helps Avoid Latency Spikes:
- Dynamic Path Selection: Automatically reroutes traffic away from congested or high-latency paths
- Application-Aware Routing: Recognizes and prioritizes traffic for business-critical apps (e.g., VoIP, video conferencing)
- Multi-link Resilience: Supports multiple ISPs or links and load balances traffic based on performance
- End-to-End Visibility: Many SD-WAN platforms include integrated monitoring tools for real-time network health checks
If your business relies on cloud applications, video meetings, or multi-site connectivity, SD-WAN can dramatically reduce the risk of WAN-based latency spikes.
Proactive monitoring isn’t a nice-to-have, it’s a must-have.
Latency spikes, especially intermittent ones, often go unnoticed until users complain. That’s too late. Continuous monitoring allows your team to:
- Detect anomalies in real time
- Track long-term performance trends
- Set custom thresholds and alerts to trigger early intervention
- Correlate performance issues with network events, upgrades, or deployments
With a solution like Obkio, you can continuously monitor all key segments, LAN, WAN, cloud, and remote users, and ensure:
You’re alerted the moment latency deviates from your baseline
You have historical data to support diagnostics and provider escalations
You can make data-driven decisions about upgrades and network changes
📌 Think of it as installing a security camera for your network—it never sleeps, and it always has receipts.
In this guide, learn how to troubleshoot and improve network latency with fun analogies, step-by-step instructions, and tips for both users and businesses.
Learn more

Networks designed without redundancy are one incident away from disruption. Whether it’s a failed router, a saturated link, or an unstable ISP route, without backup options, you're at the mercy of a single chokepoint.
How to Build Redundancy:
Multiple WAN Links: Use at least two Internet providers or paths to key services
Hardware Redundancy: Deploy dual firewalls, switches, and power sources for critical infrastructure
Load Balancing: Distribute traffic across links/devices to prevent overload
Failover Policies: Configure automatic switching in case of failure or degraded performance
Combined with intelligent routing (via SD-WAN) and persistent monitoring, redundancy ensures your network automatically recovers or reroutes traffic when latency begins to spike, often before users even notice.
✅ Redundancy isn’t just about uptime, it’s about consistent quality across your applications and services.
Preventing latency spikes isn’t about eliminating every millisecond of delay, it's about creating a network that can absorb disruption and maintain performance under pressure. When you invest in visibility, automation, and resilience, you’re not just fixing problems, you’re future-proofing your infrastructure.
Latency spikes aren’t just fleeting annoyances, they’re red flags in your network that can disrupt critical services, degrade user experience, and erode confidence in your IT infrastructure.
Whether it’s a choppy VoIP call, a frozen video meeting, or an unresponsive cloud application, these short-lived surges in latency can cause outsized damage if left unaddressed. And because they’re often unpredictable and hard to trace, latency spikes demand a proactive and strategic approach.
Don’t wait for latency to hurt productivity or user trust.
With the right tools, visibility, and processes in place, you can catch latency spikes before users notice, respond with precision, and build a network that performs reliably under any condition.
Because in today’s real-time, always-on world, network performance isn’t just technical. It’s mission-critical.

- 14-day free trial of all premium features
- Deploy in just 10 minutes
- Monitor performance in all key network locations
- Measure real-time network metrics
- Identify and troubleshoot live network problems


 Obkio Blog


