


Distributed Network Monitoring Tool for Complete Network Visibility
Monitor your entire network from every location. Get real-time visibility into your your headquarters, data centers, remote sites, and home offices.
4.96 Average Rating (169 Reviews)


What is a Distributed Network Monitoring Tool
& Why Your Network Needs One
A distributed network monitoring tool uses monitoring agents across all your network locations (offices, data centers, cloud environments, and remote endpoints) to provide complete visibility from every perspective. Unlike traditional centralized network monitoring, which only monitors from a single vantage point, distributed network monitoring measures performance from where your users and applications actually operate.
Modern networks are inherently distributed. Users work from home offices, branch locations, and while travelling. Applications run in multiple cloud regions. Critical services depend on connectivity across ISPs, WAN links, and internet paths you don't control.
Obkio’s Distributed Network Monitoring Tool solves this by placing lightweight agents at every location that matters. These agents continuously measure network performance and report to a centralized dashboard where your IT team gains unified visibility across your entire infrastructure.
Network performance varies dramatically depending on where you measure from. A connection that looks perfect from your data center might be experiencing severe packet loss from a remote office. Without Obkio’s Distributed Network Monitoring Tool measuring performance from actual user locations, you're operating blind to the real network experience your users face every day.
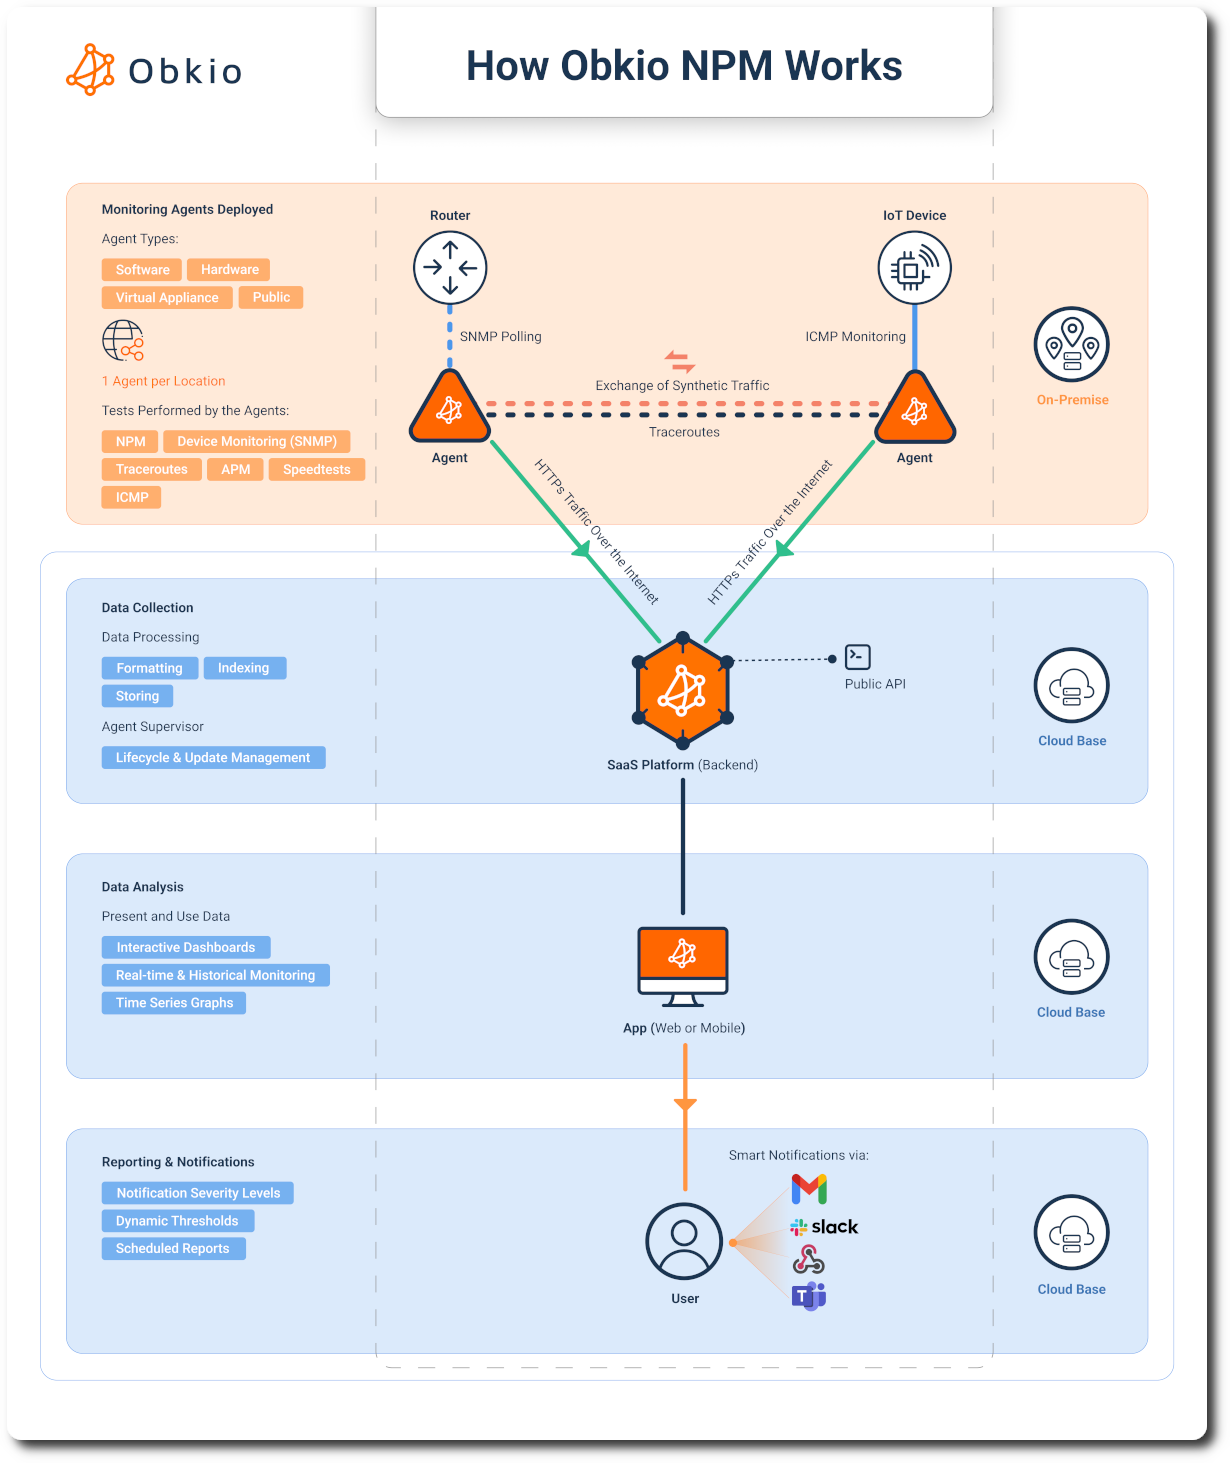
How Obkio’s Distributed Network Monitoring Tool Works
Obkio's distributed network monitoring tool provides visibility through a three-part architecture: deploy lightweight monitoring agents everywhere your network reaches, continuously monitor performance from every location, and access all data through a centralized dashboard.
Deploy Agents Everywhere Your Network Reaches
The lightweight Monitoring Agents installs on endpoints and servers running Windows, Mac, or Linux in minutes, using minimal resources. This makes them perfect for deployment on any device, including remote worker laptops.
- Software & Hardware Agents serve office locations and network operations centers, providing dedicated monitoring infrastructure or integrating into existing virtualized environments.
- Public Monitoring Agents strategically located across geographic regions and major internet exchanges enable monitoring of internet paths, cloud connectivity, and external service performance.
*Continuous Synthetic Monitoring from Every Location**
Once deployed, monitoring agents continuously exchange synthetic traffic to measure real-time network performance. Agents exchange small UDP packets at configurable intervals (every 500 milliseconds) to measure critical metrics: latency, jitter, packet loss, and MOS score. These metrics directly correlate to user experience.
Centralized Network Visibility & Management
All distributed monitoring agents report to a single, centralized dashboard. View real-time performance metrics from all agent locations simultaneously.
Get historical data from every monitoring point. When a user reports yesterday's problem, you pull up historical performance data from the agent at their location, showing exactly what network conditions existed at that time.
Alerting works across your entire distributed infrastructure through unified notification management. Define performance thresholds for different locations and connection types.
Key Features of Obkio's Distributed Network Monitoring Tool
Monitor everywhere your network reaches. Deploy lightweight agents across all locations for complete, real-time visibility in one dashboard.
Monitor Performance from Every Location
Deploy agents at headquarters, branch offices, remote worker locations, data centers, and cloud environments to gain complete visibility into how your network actually performs for distributed users. When remote workers experience connectivity issues, you immediately see performance data from the agent at their location.
Synthetic Monitoring For Real User Experience
Synthetic monitoring provides consistent, continuous performance measurement that reflects actual user experience without depending on user activity. Monitoring agents exchange small UDP packets simulating real application traffic so detect issues during off-hours, and alert on problems before users start their workday.
ICMP-Based Monitoring from Distributed Locations
Monitor any IP address using ICMP echo requests (ping). You often can't install traditional monitoring agents or configure SNMP access on devices at remote locations, in home networks, or in environments you don't fully control. Network Destinations work within these constraints by using the nearly universal ICMP protocol.
Centralized Dashboard for Distributed Visibility
Access real-time performance metrics from all locations from a centralized dashboard and compare locations to identify patterns and outliers. When headquarters, three branches, and eight remote workers show normal performance but one branch shows elevated latency, you've immediately narrowed the problem scope.
Network Device Monitoring Across Locations
Network device monitoring integrates SNMP-based infrastructure monitoring with synthetic performance monitoring, providing comprehensive visibility into both network infrastructure health and actual user experience. For network segments you fully control, SNMP device monitoring tracks detailed health metrics from routers, switches, and other infrastructure.
Traditional Centralized Monitoring vs. Obkio
Traditional monitoring tools were designed when networks were centralized, users worked in offices, and applications ran in your data center. These tools monitor from a single location and assume that perspective represents everyone's experience. That assumption breaks down completely in today's distributed environments.
You Can't Monitor What You Don't Control
Traditional monitoring can't access remote workers' home routers or measure ISP performance. 80% of ISPs block ICMP traffic inbound to residential connections, making it impossible to monitor these networks from centralized infrastructure.
Obkio was built differently. Our architecture uses distributed agents that work in networks you don't control—using synthetic monitoring and ICMP-based Network Destinations that measure performance even where you have no administrative access.
Blind Spots Everywhere
When remote workers experience connectivity problems, centralized monitoring shows everything is fine, because from your data center's perspective, it is. Centralized monitoring can't see problems with their ISP connection or paths between locations.
Obkio places agents at every location that matters: remote worker devices, branch offices, cloud environments, measuring performance from the user's actual perspective.
Reactive, Not Proactive
IT teams learn about network problems from user complaints, not monitoring alerts. Even when you confirm performance issues, you lack historical data for ISP escalations.
Obkio enables proactive management. Continuous synthetic monitoring captures performance data 24/7, alerting your IT team before users notice issues. When problems occur, you have historical performance graphs from the exact location.

Who Benefits from Distributed Network Monitoring
We'll Show You How it Works
Want to see how Obkio works? Get a live demo and let's talk through your needs.


Deploy Distributed Network Monitoring Across Your Network
Sign up for a free trial and follow the onboarding wizard for your initial setup. The wizard will guide you through deploying your first agents and creating monitoring sessions to get you up and running quickly.
Free trial benefits:
- No credit card required to start monitoring
- 14 days of full access to all distributed monitoring features
- Deploy unlimited agents across all your locations
- Test monitoring in your actual network environment
- Responsive support to help you get started


Plan & Install Distributed Monitoring Agents
Before deploying agents, map out your network topology to determine where monitoring agents are needed for complete visibility.
Identify all locations requiring monitoring coverage: corporate headquarters, branch offices, remote worker locations, and cloud environments. Determine which agent type fits each location:
What You'll See:
- Software Agents (Golang Agent V.2): For endpoints, servers, and remote worker devices
- Hardware Appliances: For office locations requiring dedicated monitoring infrastructure
- Virtual Appliances: For virtualized environments and cloud deployments
- Public Monitoring Agents: For internet path and cloud connectivity monitoring
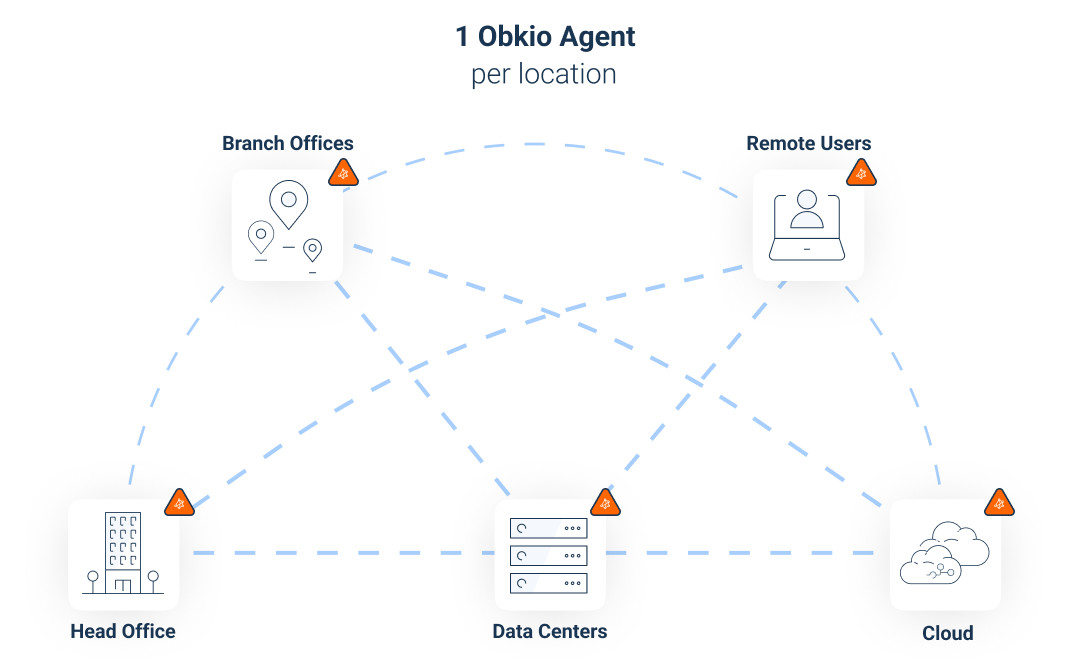
Step 2.5: Where to Deploy Agents for Distributed Visibility
Start with your most critical locations first, typically headquarters, main data center, and largest branch offices, then expand to additional sites.
- Corporate headquarters and main offices: Monitor your primary locations where critical infrastructure and applications are hosted
- Branch offices and satellite locations: Gain visibility into regional office connectivity and performance
- Remote worker home offices: Monitor network performance from where distributed employees actually work
- Data centers: Track performance at locations hosting your applications and services
- Cloud environments (AWS, Azure, GCP): Monitor connectivity to and from your cloud infrastructure
- Manufacturing plants and warehouses: Monitor operational technology environments
- Retail locations and field offices: Track performance at customer-facing sites
- Internet paths: Use Obkio's hosted Public Monitoring Agents to monitor external connectivity (no installation required)


Collect Performance Data Across Your Distributed Network
Create multiple sessions to monitor different network paths: office-to-office connections, remote workers to data center, on-premises to cloud environments, and internet path monitoring via Public Monitoring Agents.
- Network Performance Monitoring (NPM) tests: Configure synthetic traffic monitoring to measure end-to-end network performance continuously. These tests simulate real application traffic to measure the actual user experience across your distributed network paths.
- Monitor network devices with SNMP: Monitor routers, switches, and other infrastructure for interface utilization, error rates, device temperature, CPU and memory usage, and other operational metrics that indicate infrastructure health.
- Application Performance Monitoring (APM): Set up monitoring for critical business applications to measure application-level performance from distributed locations. Track response times, transaction success rates, and application availability from the user's perspective at each location, ensuring applications perform acceptably regardless of where users work.
- ICMP-based Network Destinations: Monitoring any IP address with continuous traceroute. Unlike basic ping monitoring that only tells you "up" or "down," Network Destinations shows you the complete network path with hop-by-hop diagnostics, monitored from your existing Obkio agents.
- Continuous Visual Traceroutes: Map network paths in real-time and identify routing changes between distributed locations. This is particularly valuable for troubleshooting WAN issues and understanding ISP routing decisions.
- Speed Tests: Assess your network's performance by measuring key metrics such as download speed, upload speed, and latency.


Create Your Centralized Dashboards for Distributed Sites
The power of distributed network monitoring comes from seeing all your locations in one place. Create custom dashboard views that match how your team works:
- Overview dashboard: View all locations simultaneously with key metrics displayed at a glance. See which locations are performing well (green), experiencing minor issues (yellow), or require immediate attention (red). Compare latency, packet loss, and bandwidth across all sites instantly, identifying whether issues affect one location or your entire network.
- Location-specific dashboards: Build dedicated dashboards for individual locations showing detailed performance metrics for that site: monitoring sessions, Network Destinations, Speed Test results, and historical trends. Perfect for troubleshooting location-specific issues.
- Regional views: Group locations by geography, business unit, or any logical organization—"West Coast Offices," "EMEA Remote Workers," or "Sales Team." This helps distributed IT teams focus on locations they support.
Add the metrics that matter most to your dashboards and compare metrics side-by-side across locations.


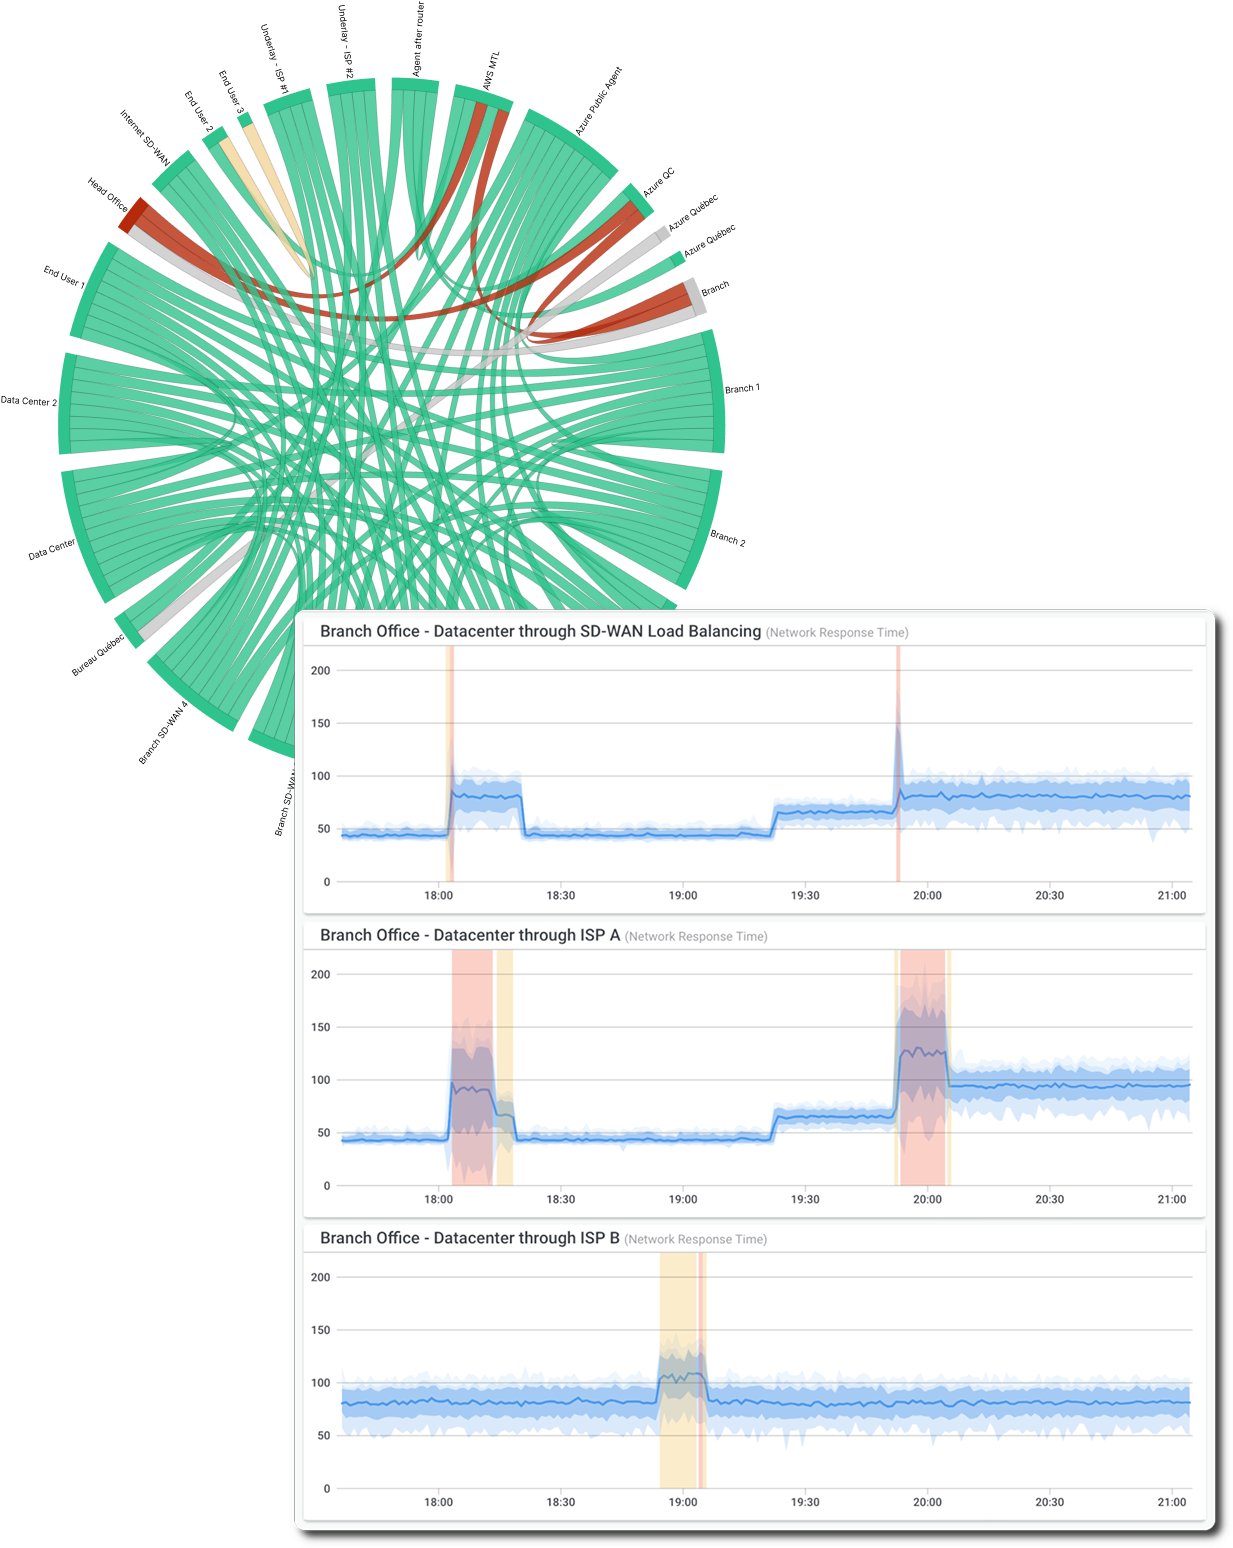
Compare Network Performance Between Distributed Sites
Use your centralized dashboard to compare network performance across all distributed locations, identifying patterns and establishing baselines.
Establish performance baselines:
Let monitoring run for at least 24-48 hours to gather baseline data. Review performance patterns for each monitored location:
- Normal latency ranges: What's typical for each location type?
- Expected jitter levels: Normal variation in latency measurements
- Typical packet loss: Normal background packet loss
- Bandwidth availability: Actual measured throughput from Speed Tests
Use dashboard comparison views to display multiple locations simultaneously. This reveals at a glance whether performance issues affect specific sites or represent network-wide problems. When headquarters, three branches, and eight remote workers show normal performance but one branch shows elevated latency, you've immediately narrowed the problem scope.
Compare baseline performance between locations to understand relative performance characteristics. Your Nashville office might show consistently higher latency than your Atlanta office due to geographic distance. That's normal and doesn't indicate a problem.


Identify & Troubleshoot Network Issues in Distributed Network Sites
Leverage distributed monitoring data to quickly identify where network issues originate and troubleshoot with objective evidence from actual user locations.
1. Get ahead of user complaints: Monitoring agents alert you when performance degrades; often before users even notice.
2. Instantly scope the problem: One glance at your centralized dashboard reveals everything. Multiple locations affected? It's your destination or application. Single location struggling? Zero in on that site's specific connectivity.
3. Pinpoint the exact failure point: Continuous Visual Traceroutes show you the complete network path with hop-by-hop diagnostics. See immediately which hop is the culprit—the user's home router at hop 2? ISP congestion at hop 5? A backbone provider issue at hop 8?
4. Back it up with historical proof: Pull up historical performance graphs showing exactly when issues started, how long they've persisted, and their specific characteristics..
5. Resolve with targeted action: Contact the right part (user, ISP, or your internal team) with concrete evidence: "Your network shows 15% packet loss at hop 6 (your ISP's router) starting at 7 PM daily for the past week. Here's the data." Problems get fixed faster when you have proof.


Expand Your Distributed Network Monitoring Coverage
With your initial distributed monitoring operational and providing value, systematically expand coverage to additional locations and refine your strategy.
Deploy agents to additional locations in phases:
- Additional remote workers: Select employees representing different geographic regions, ISPs, and work patterns
- Smaller branch offices: Extend coverage to secondary office locations
- Additional cloud environments: Expand monitoring to multiple cloud regions and DR sites
- Backup and DR sites: Monitor backup connectivity and failover paths
Distributed monitoring scales easily with Obkio. As you add new locations, simply deploy new agents and create monitoring sessions to maintain complete visibility. Make distributed monitoring a standard part of your infrastructure deployment process, when opening a new office or onboarding new remote workers, deploying monitoring agents becomes an automatic step.
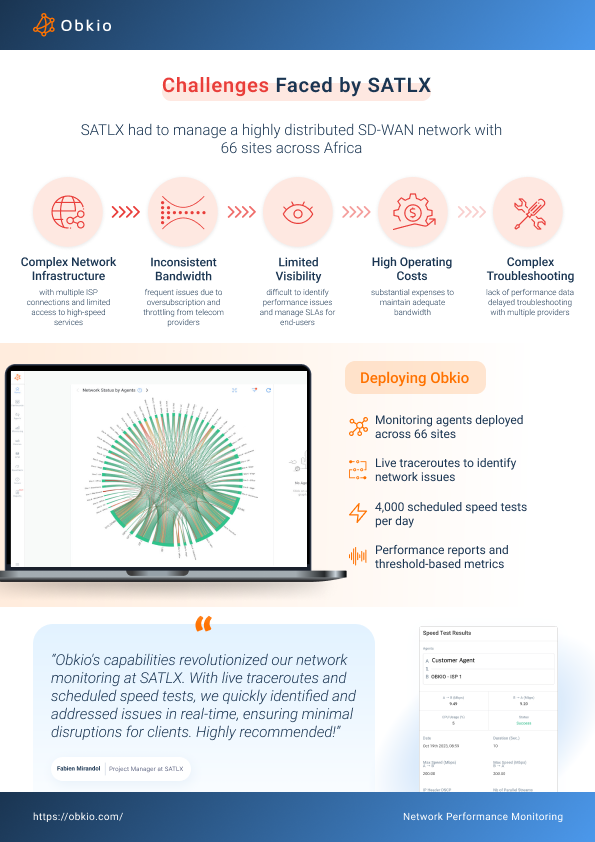
Case Study: Monitoring Distributed Client Networks
SATLX, an MSSP supporting multiple clients, needed visibility into distributed networks they didn't control: across multiple ISPs, remote sites, and home offices.
The Problem:
- No visibility into ISP performance or last-mile connectivity
- Reactive troubleshooting based on user complaints
- Hours wasted proving to ISPs that problems existed
The Solution: SATLX deployed Obkio's distributed monitoring agents at each client location, creating continuous visibility from every site.
Results:
- Proactive issue detection: Identified network problems before clients reported them
- 80% faster troubleshooting: Distributed monitoring data pinpointed exact problem locations
- ISP escalations that work: Historical performance graphs from affected locations gave ISPs the evidence they needed to act
- Client confidence: Demonstrated MSP value through data-driven network management

No Matter Your Network Issue
We've Got the Solution For You
Obkio's solution is designed to be the easiest Network Monitoring tool on the market, making it the ideal choice for businesses of all sizes, from IT professionals working from home to managing the complexities of large-scale corporate networks.
- 14-Day Proof Of Concept
- Single and home offices
- SMEs with less than 3 locations
- Mid to large multisite networks
- MSPs & large businesses
- Non-Profit Organizations
- Colleges and Universities
Check out our plans, all available with a free 14-day trial, no credit card required!
Have Any Questions?
Let's talk about your network's needs and show you around Obkio's app!
Other solutions
Network Monitoring, Troubleshooting & Diagnostics:
Expert Insights and How To's
Welcome to our blog, where we address the common challenge of identifying network issues and provide you with effective solutions. At times, network problems can be elusive, causing disruptions, performance bottlenecks, and frustration. But fret not, because we are here to help. Our team of experts has extensive experience in tackling network issues head-on, and we are excited to share our knowledge and insights with you.


Frequently Asked Questions
Obkio deploys agents at every location that matters, not just your data center. Agents measure end-to-end performance including ISP connections, Internet paths, and cloud connectivity that traditional tools can't access.
Software Agents (Golang Agent V.2) for endpoints and servers, Hardware and Virtual Appliances for office locations, and Public Monitoring Agents for Internet paths and cloud connectivity.
Yes. Agents use synthetic monitoring and ICMP-based Network Destinations from the remote location, measuring performance from the user's actual perspective without requiring administrative access.
Yes. The centralized dashboard displays performance from all locations simultaneously. Compare metrics across all sites in one view to immediately identify where problems exist.
Minutes. Install agents, create monitoring sessions, get real-time visibility within an hour. Expanding to additional locations is equally fast.
Yes. Monitor all client networks from one dashboard. Deploy agents at each client location to see whether issues are in customer networks, ISP connections, or MSP infrastructure.
No. Deploy as many agents as needed. Pricing scales with agents and sessions.
Start Your Free 14-Day Trial Now!
Get a free POC with Obkio's 14-day trial. Identify network problems & collect data to troubleshoot.
Start Now Book a Demo