Network Destinations
- What are Network Destinations
- When to use Network Destinations & How it works
- How to access Network Destinations
What you are going to learn:
Network Destinations is Obkio's ICMP monitoring solution that allows you to monitor any IP address or hostname using continuous traceroute, without requiring a destination agent.
Unlike basic ping monitoring that only reports "up" or "down" status, Network Destinations provides hop-by-hop path diagnostics showing latency, jitter, and packet loss at every point along the network path. This means you can identify exactly where issues occur, not just that they exist.
Network Destinations uses the same continuous traceroute engine as Obkio's Visual Traceroute tool, extended to monitor any endpoint from your existing Monitoring Agents. Tests run about a second, providing real-time visibility into network path health and performance.
Network Destinations is designed for endpoints where you cannot deploy Obkio’s destination Monitoring Agent but still need continuous path visibility and diagnostics.
Use agent-to-agent monitoring sessions when:
- You can deploy Monitoring Agents at both endpoints
- You need bidirectional performance data
- You require network metrics (latency, jitter, packet loss, QoS) that are not based on ICMP, but on UDP
- You need to run other types of tests, like speed tests.
Agent-to-agent sessions provide the richest visibility possible and should always be your first choice when both endpoints support agent deployment.
Use Network Destinations when:
- You cannot install a destination agent
- You need to monitor third-party services or external endpoints
- Vendor restrictions or security policies prevent agent installation
- You need simple reachability monitoring with full path diagnostics
Each Network Destination displays status indicators:
- Healthy (Green): Destination is reachable and performing within configured thresholds
- Warning (Yellow): Destination is reachable but experiencing low degraded performance based on threshold settings
- Error (Light red): Destination is reachable but experiencing high degraded performance based on threshold settings
- Critical (Bold red): Destination is unreachable or experiencing severe performance degradation
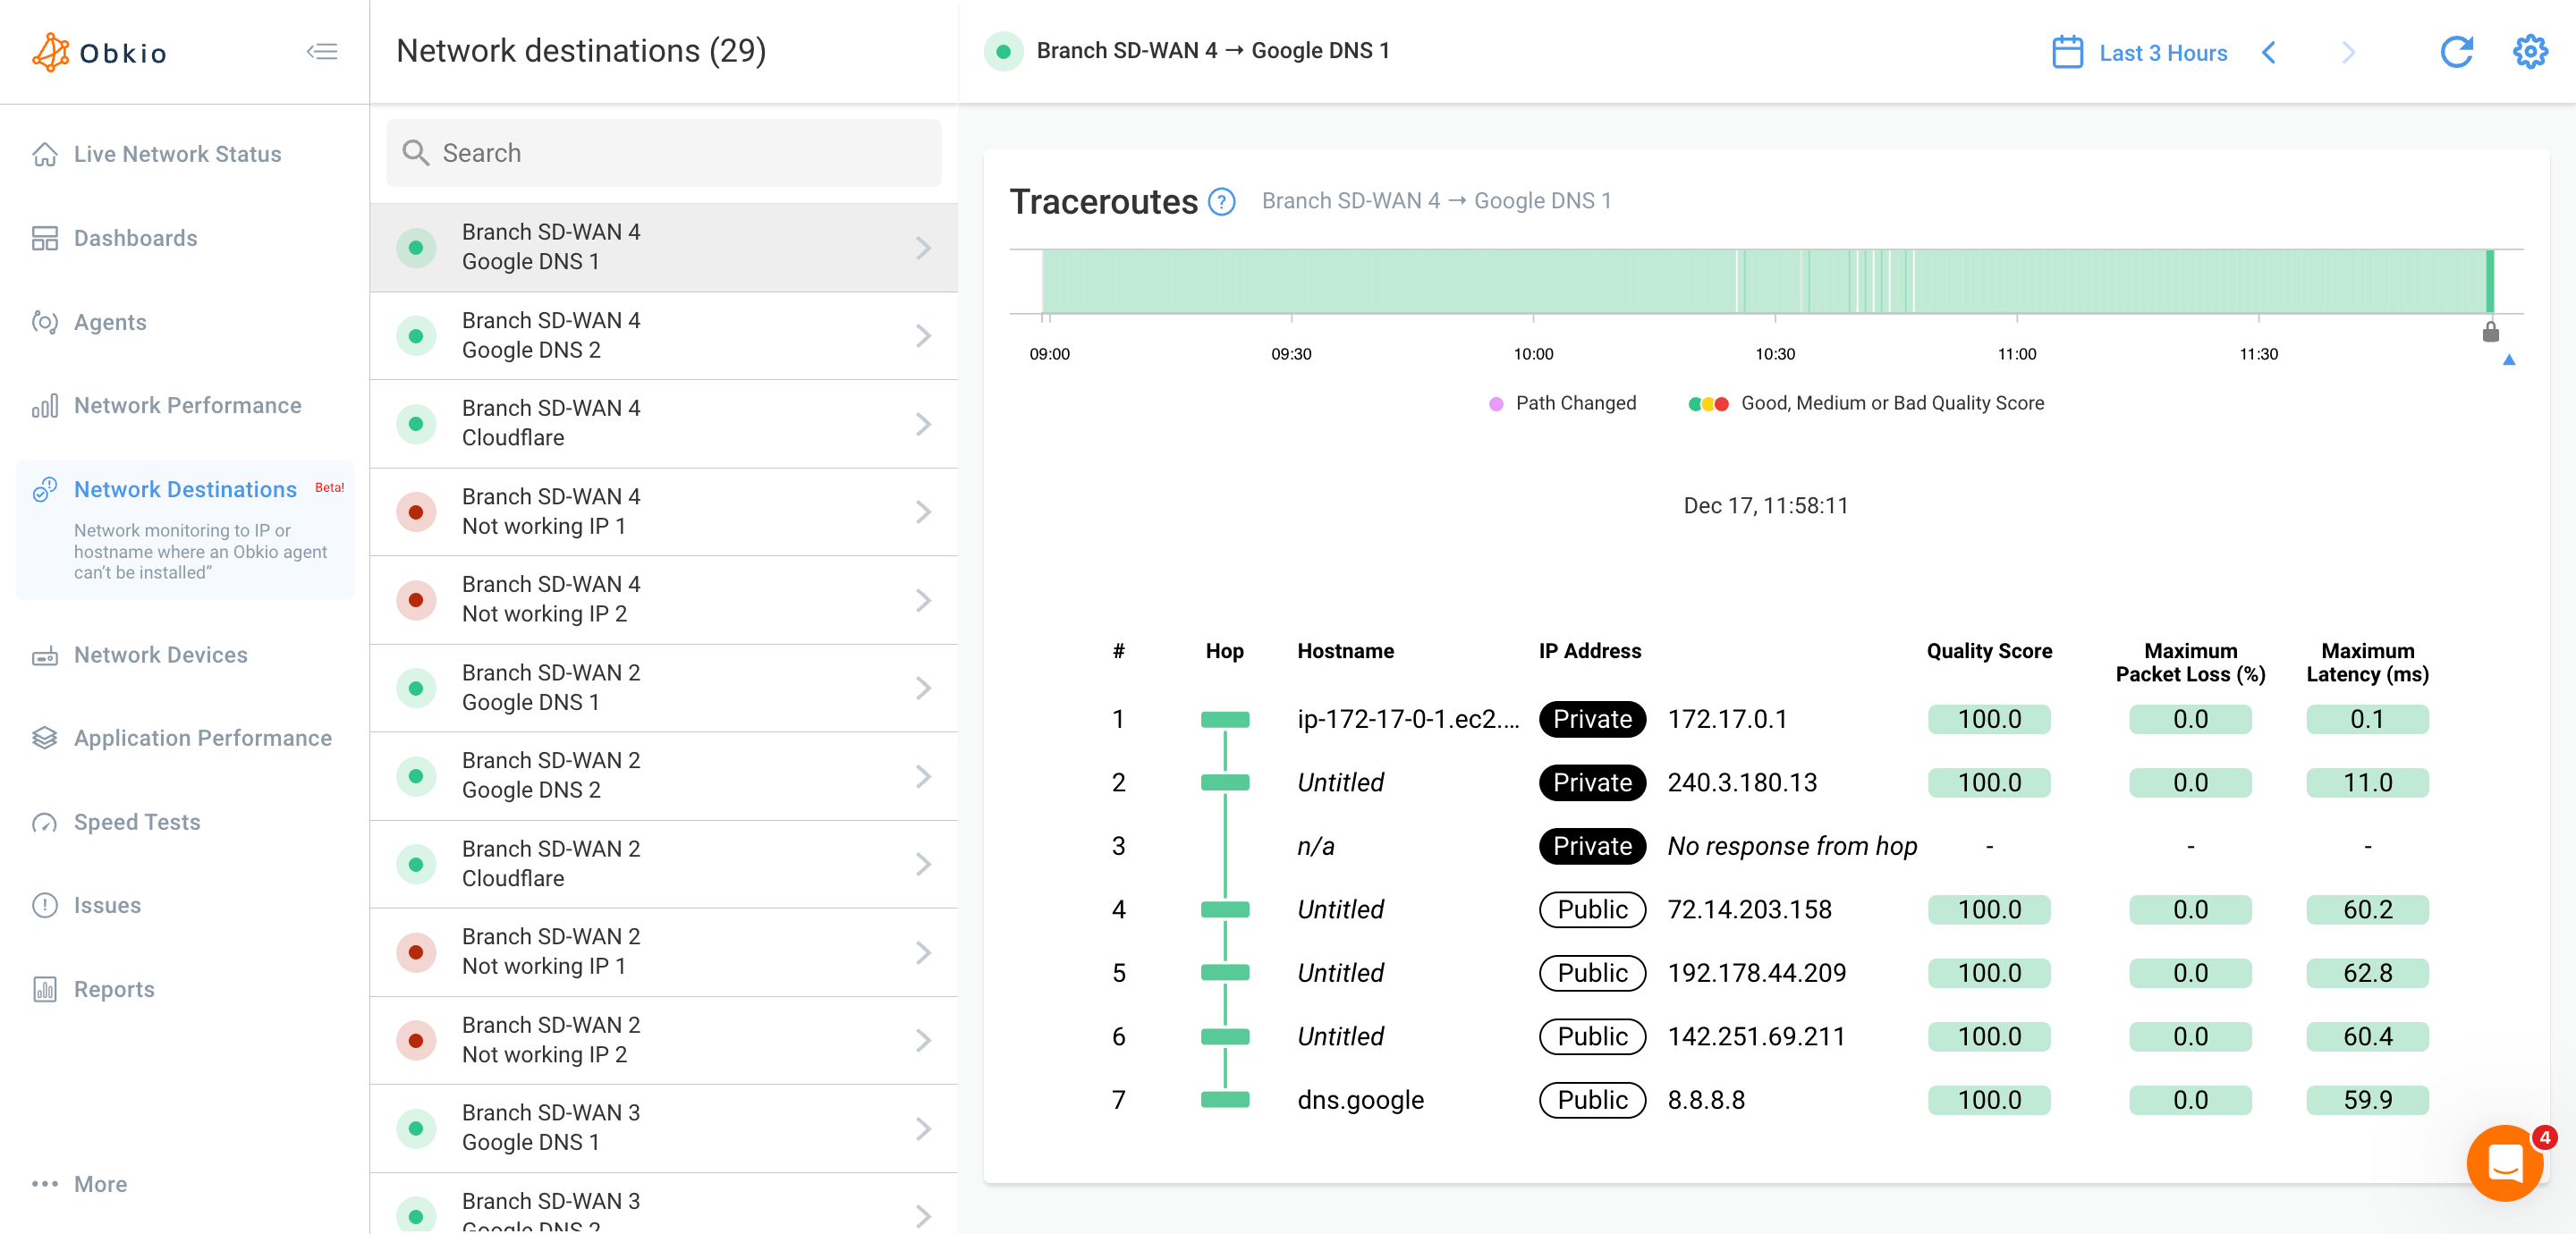
Click any destination from the list to view detailed performance data.

The traceroute view consists of two main sections:
- A horizontal timeline uses coloured segments to show the overall quality of the network path at each moment.
- Green indicates a good quality score, yellow indicates medium quality, light red indicates poor quality and bold red indicates the destination is unreachable.
- Purple markers denote path changes, meaning the route from the agent to the destination changed at that time.
- Selecting a point on the timeline updates the hop details below.

The amount of information displayed depends on the available space on your screen.
- Each row corresponds to a hop (router) along the route.
- For each hop, the large size table displays the
hop number,IP address/hostname,Quality Score (%),Packet Loss (%)andPacket Count,Latency (ms)andJitter (ms)- Minimum, Average and Maximum. - When you hover over a hop, a tooltip shows the
IP address, the reverseDNS hostname(when available) and theQuality Score. - Separated traceroute tables are shown when the path changes, by clicking on the
Show morebutton
Public/Private IP Labels
Each hop in the traceroute displays a label indicating whether it's a private or public IP address:
- Private IP: Hop is within your internal network
- Public IP: Hop is on the public Internet
This labelling helps you instantly identify where traffic transitions from your internal network to external networks
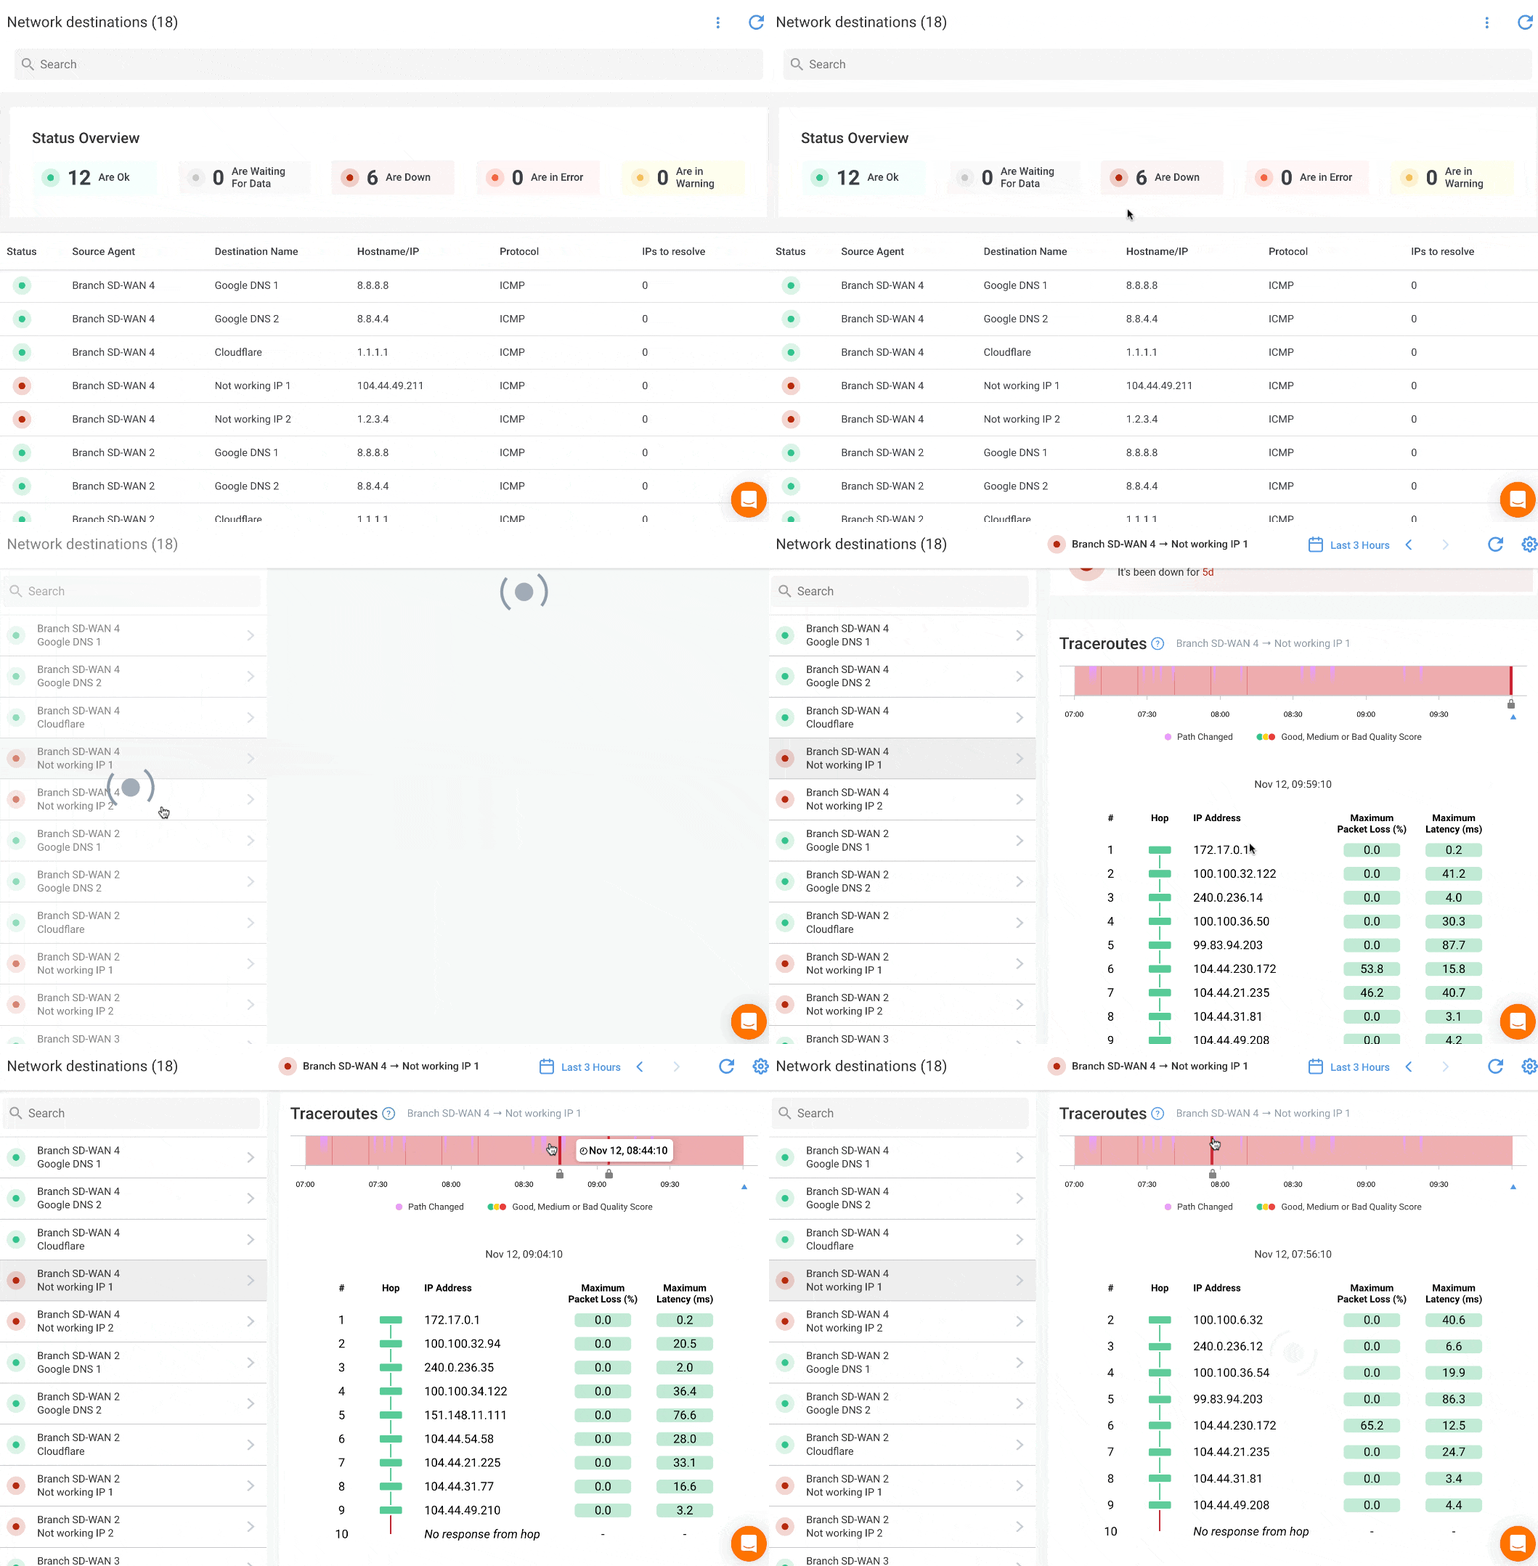
Navigate to the Network Destinations tab in Obkio’s app. This page displays all configured destinations with a status overview and filtering options.

The Network Destinations interface shows:
Status overviewat the top showing how many destinations are in each state (healthy, warning, critical)- Filter by status to quickly find destinations needing attention
- List view displaying all destinations with:
- Current status indicator
- Destination name
- Source agent running the tests
- Destination IP or hostname
Destination templates define how network destinations are monitored. You can create multiple templates with different monitoring parameters and reuse them across destinations.
To create a template:
- Click the 3-dot menu (⋮) in the top right corner
- Select
Edit Destination Template - Click on the “+” icon on the top right
- Configure monitoring parameters (see Template Settings below)
- Save the template
Destination monitoring tests are created immediately and will take a few minutes to get data.
To add a destination for monitoring:
- Click the 3-dot menu (⋮) in the top right corner
- Select
Edit Destination Host - Click on the “+” icon on the top right
- Enter the IP address or hostname to monitor
- Provide a descriptive name for the destination
- If entering a hostname, indicate the maximum number of IP addresses to resolve the hostname. Leave this information to 0 if using an IP.
- Click
Create
Note, you can also create a Destination from a Destination template
- Click the 3-dot menu (⋮) in the top right
- Select
Edit Destination Template - Click on the template you want to modify
- Update the monitoring parameters
- Save the template
Changes apply to all destinations using this template.
- Click the 3-dot menu (⋮) in the top right
- Select
Edit Destination Host - Click on the destination you want to modify
- Update the destination settings (name, IP/hostname, IP resolution limit, assigned template)
- Save changes
- Click the 3-dot menu (⋮) in the top right
- Select
Edit Destination Template - Click on the template you want to delete
- Click
Delete - Confirm deletion
- Click the 3-dot menu (⋮) in the top right
- Select
Edit Destination Host - Click on the destination you want to delete
- Click
Delete - Confirm deletion


