


Table of Contents
Table of Contents
As network admins, we know that routers are the lifeblood of any network. They’re the unsung heroes, routing data from your internal systems to external destinations like the Internet. When routers are performing at their best, everything flows smoothly. But when they’re overloaded, misconfigured, or simply not up to snuff, your network’s performance and security are at risk.
If you’ve ever dealt with a network slowdown, you probably know that it often comes down to a router issue. Whether it’s routing traffic inefficiently or just not handling the load, it’s critical to monitor your routers. By monitoring router performance, you ensure that routes are optimized, configurations are in check, and your network stays fast and reliable.
What is Router Monitoring? 
Routers are the backbone of your network, and keeping them running smoothly is key to ensuring everything else works as it should.

But how do you know if your router is doing its job? Enter router monitoring.
Router monitoring is the practice of continuously observing and analyzing the health and performance of your routers. It’s not just about knowing if your router is up and running (though that’s part of it). It’s about digging deeper into metrics like CPU usage, bandwidth utilization, packet loss, latency, and interface health.
Proactive monitoring gives you the visibility you need to detect router issues before they escalate. Think of it like having a dashboard for your router’s health, one that lets you know when something’s off, whether it’s a small issue or something that could bring down the whole network.
But here’s where it gets interesting. Router monitoring isn’t the same as general network monitoring. In contrast, general network monitoring looks at the whole network’s performance, router monitoring zooms in on those router-specific metrics (routing tables, CPU loads, interface errors, etc.). By focusing on these details, you can troubleshoot more effectively and keep your network running at its best.
Why Is Router Monitoring Important For Your Business?
If you’ve ever been on the receiving end of a network outage, you know how critical it is to keep things running smoothly. Routers, as the main traffic directors of your network, play a huge role in ensuring performance, stability, and security.
Here’s why monitoring them should be a top priority:
1. Ensures Network Performance and Stability
When a router is underperforming, it’s not just annoying; it can cause serious disruptions. From slow application response times to outright network downtime, these issues often start with the router. Router monitoring helps ensure that routing paths are optimized and prevents misconfigurations or overloads that could lead to bigger problems.
2. Enhances Network Security
Routers aren’t just managing traffic; they’re also a key security layer. If something goes wrong, it’s often a sign of a larger issue. Maybe your router is compromised, or there’s an attempted attack on your network. By continuously monitoring, you can spot these anomalies early, before they turn into something more damaging.
3. Improves User Experience Across the WAN
Is your VoIP call dropping? Or maybe users are experiencing lag when accessing critical cloud apps? These issues can often be traced back to bandwidth saturation or routing inefficiencies. Monitoring your router can help you identify and fix these performance issues, ensuring a smooth user experience for everyone, whether they’re in the office or working remotely.
4. Supports Smarter Capacity Planning
You don’t want to wait until you’re running out of bandwidth to think about upgrading your router or scaling your network. With continuous monitoring, you’ll have historical data that helps you forecast future growth and make smart decisions about when and how to scale.
5. Reduces Downtime and SLA Violations
Network outage can be costly, not just in lost productivity but also in penalties from SLA violations. By catching potential router issues before they lead to failures, you can ensure your network stays up and running, meeting performance expectations, and avoiding penalties.
6. Enables Configuration and Firmware Compliance
Routers are only as good as their configurations and firmware. Monitoring ensures that both are up to date and compliant with your security standards. If there are configuration errors or outdated firmware, you’ll be alerted, allowing you to address them before they cause issues.
7. Adapts to Hybrid and Remote Workloads
With more people working remotely, your network’s demands have shifted. Monitoring edge routers, especially in remote locations, ensures they can handle the increased load from VPNs and remote access traffic without compromising performance.
8. Optimizes WAN Spending and Resource Allocation
WAN links can be expensive, and over-subscribing or under-subscribing them can lead to wasted resources or bottlenecks. Monitoring helps you strike the right balance, so you get the most out of your WAN links, improving both performance and ROI.
Note for you, Network Administrator!
At the end of the day, all these benefits impact the business, but it all comes back to you, the network admin. If you don’t have the right monitoring tools in place, spotting router issues becomes a guessing game.
Too often, issues are missed, or you might end up blaming something else when the root cause is staring you right in the face. The truth is, when things go wrong, it’s always you who’s under the pressure to fix it. So, take router monitoring seriously.
What Router Metrics Should You Be Monitoring?
As network admins, it’s not enough to just know if your router is on or off. We need to dive deep into the performance data to catch problems before they escalate. So do so, let’s take a look at the router metrics that really matter when it comes to performance

1. The Role of CPU Usage in Router Monitoring
Why monitor this? The CPU is the engine that drives your router. When the CPU usage spikes too high, it means your router is struggling to keep up with the traffic. This can lead to delays in data processing, dropped packets, or even router crashes.
If you don’t monitor it, you could miss the early signs of CPU overload until the router stops functioning properly, leading to downtime or degraded performance across the network.
2. The Role of Memory Usage in Router Monitoring
Why monitor this? Memory is where the router stores its temporary data to route traffic. If your router runs low on memory, it can start dropping packets, losing routing information, or even rebooting unexpectedly. This means network disruptions, which are the last thing you want in a production environment.
Without monitoring, you might not realize there’s a memory issue until it causes a full-blown outage.
3. The Role of Bandwidth Utilization in Router Monitoring
Why monitor this? Bandwidth is your router’s “pipe.” If it's consistently maxed out, everything in your network suffers. Slowdowns, laggy VoIP calls, and video freezes are all signs of bandwidth congestion.
If you don’t monitor bandwidth utilization, it’s easy to miss when you’re approaching the limits of your network capacity. And by the time you realize, users will already be feeling the effects of a clogged-up pipe.
4. The Role of Packet Loss in Router Monitoring
Why monitor this? Packet loss is a direct signal that something’s wrong. It could be due to network congestion, faulty hardware, or even configuration issues.
If you don’t monitor for packet loss, you won’t catch these issues early, and they’ll start affecting real-time applications like voice or video. You’ll end up with dropped calls or laggy video feeds, which can make your whole network look unreliable.
5. The Role of Latency in Router Monitoring
Why monitor this? Latency is the delay in data travelling across the network, and it’s critical for performance, especially for apps like VoIP or video conferencing. If latency spikes, you’ll start hearing complaints about slow apps or unresponsive websites.
If you don’t keep an eye on it, these latency spikes could sneak up on you, causing users to get frustrated with poor performance before you even have a chance to address it.
6. The Role of Interface Errors in Router Monitoring
Why monitor this? Interface errors usually point to physical issues like bad cables, duplex mismatches, or a failing port. These errors can cause intermittent network problems or slowdowns, which, if left unchecked, can become a bigger problem.
Not monitoring this metric means you might not spot these errors until they start affecting users, leaving you scrambling to fix issues under pressure.
7. The Role of Routing Table Changes in Router Monitoring
Why monitor this? The routing table tells the router where to send traffic. If it’s changing frequently or unexpectedly, something’s off. Maybe you’ve got a misconfiguration or a routing loop, which can cause traffic to take longer paths or even become unreachable.
If you’re not monitoring these changes, you could miss the signs of network instability until it causes disruptions in service.
8. The Role of Device Availability/Uptime in Router Monitoring
Why monitor this? A router that’s down is a network that’s down. Simple as that. Keeping track of uptime ensures that you know when a router goes offline.
If you’re not monitoring availability, you might not realize a router is down until users can’t connect or services start failing. Quick detection means quicker resolution, and less downtime for the business.
9. The Role of Jitter in Router Monitoring
Why monitor this? Jitter is the variation in latency. A little bit of jitter is normal, but too much can cause issues with VoIP calls or video conferencing. Imagine trying to have a conversation with audio cutting in and out. That’s jitter at work. If you don’t keep an eye on jitter, users will start complaining about bad call quality or laggy video, and you won’t know where to look to fix it.
These are the primary metrics you should be watching closely. If any of these start to move out of acceptable ranges, that’s your cue to dig deeper and figure out what’s going wrong.

Uncover the secrets of measuring CPU usage in networking. Navigate high seas of performance with insights. Optimize with Obkio's Monitoring tool.
Learn moreHow to Choose Tools for Router Monitoring (And Not Regret It Later)
Choosing the right router monitoring tools can make all the difference between a smooth-running network and constant firefighting. With so many options out there, it’s easy to get caught up in flashy features that sound great on paper but end up being a headache to implement and manage.
Here are a few things to consider before looking at router monitoring software to avoid regrets down the line:
- Look for Tools with Flexibility and Scalability
You’re not just monitoring one router in your data center anymore; your network is likely to grow over time, especially with branch offices, remote locations, and cloud integrations. You need a tool that can scale with you. Choose a monitoring solution that allows you to easily add more devices, support multiple locations, and provide both real-time and historical data analysis. This way, you’re not constantly switching tools or reconfiguring everything as your network grows.
- Don’t Overlook Simplicity and User-Friendliness
You don’t want to waste time figuring out a tool that’s so complex that it makes troubleshooting harder. Go for a solution that provides clear, actionable data with minimal setup. Look for a dashboard that presents the important metrics upfront (CPU, bandwidth, latency) and makes it easy to drill down into more granular details when needed.
- Prioritize SNMP Compatibility
If you want to be able to monitor all your routers without breaking the bank or buying expensive proprietary tools, SNMP is your friend. It’s widely supported by most routers and provides a wealth of performance data, including CPU usage, memory, bandwidth, and more. That said, make sure the monitoring tool you choose fully supports SNMP and has the ability to work with all your router models (or at least the most critical ones).
If a tool can’t handle SNMP, it’s likely to limit your ability to monitor at scale or won’t be able to pull in key performance metrics.

Discover the power of SNMP Polling for robust network monitoring. Learn best practices & leverage SNMP monitoring tools like Obkio’s Network Monitoring tool.
Learn more- Don’t Forget about Alerts and Thresholds
You don’t want to wait until things go south to realize something’s wrong. Make sure the tool you pick has customizable alerting features that notify you the moment things go out of whack, whether it’s high CPU usage, packet loss, or bandwidth utilization hitting its limit. Set thresholds for each metric so that you get notified before a problem becomes critical.
Also, choose a tool that allows you to set up alerts across different levels of severity, so you’re not drowning in notifications, but you’re still aware of the important issues that need attention.
Here’s a breakdown of the actual tools:
1. Network Performance Monitoring (NPM) Solutions (with SNMP)
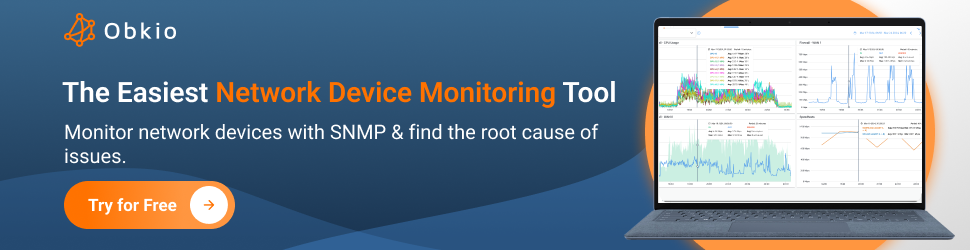
When it comes to router monitoring, you can’t go wrong with a Network Performance Monitoring solution. These tools are designed to monitor the health and performance of network devices, including routers, and can pull in key metrics like CPU usage, bandwidth utilization, and interface errors. SNMP (Simple Network Management Protocol) is often the backbone of these systems, allowing you to query your router for data on demand.
Obkio’s Network Performance Monitoring Tool makes network and device monitoring easier than ever. Deploy in minutes and get real-time insights into your router’s performance. You’ll be able to track multiple routers, set up custom alerts, and dive deep into performance metrics without spending hours trying to configure complex systems.


2. Flow Analysis Tools (e.g., NetFlow, sFlow)
Flow analysis tools like NetFlow and sFlow are fantastic for understanding traffic patterns and bottlenecks in your network. These tools allow you to see who is using your bandwidth, what applications are consuming the most resources, and where the traffic is coming from. This helps you pinpoint if the router is under stress due to a traffic surge, or if specific applications or users are the culprits.
Flow data doesn’t give you as detailed a view as SNMP monitoring, but it’s a great complementary tool for identifying trends over time.
3. Command-Line Utilities (e.g., Ping, Traceroute, Telnet)
Command-line utilities like ping, traceroute, and telnet are essential for quickly diagnosing connectivity issues. If you’re troubleshooting a slow network or trying to figure out if the router is the source of the problem, these tools can give you a fast, basic view of what's going on.
For instance, ping helps you test if the router is reachable, while traceroute shows you the path packets are taking through the network. Telnet allows you to access your router’s command line to check configurations or troubleshoot routing issues directly.
Choosing the right monitoring tools is about finding a balance between functionality, ease of use, and scalability. It’s easy to be swayed by the shiny features of a tool, but if it doesn’t meet your practical needs or is a pain to use, it’ll only cause more problems down the line. Spend the time upfront to pick the right tool, and you’ll save yourself a lot of stress later on.
How to Set Up Router Monitoring: Step-by-Step
As network admins, we know that setting up router monitoring properly from the start can save us countless headaches down the line. Here’s a step-by-step guide to help you deploy an effective router monitoring solution with minimal fuss.
Step 1: Deploy Your Network and Router Monitoring Tool
First things first, you need the right monitoring tool in place to track your router’s performance. Here’s how to start:
- Start with a Free Trial: Most monitoring tools, like Obkio, offer free trials. This lets you test the tool before committing. Get it running in your environment and check if it fits your needs.

Install Obkio Monitoring Agents: Now, deploy monitoring agents in strategic network locations, think of your head office, branch sites, or any data centers where your routers are located. These agents will measure network performance and help identify whether performance degradation originates from the router itself or elsewhere in the network.
Segment Monitoring by Location or Router Type: If you’ve got multiple routers in different parts of the network, segment your monitoring. For example, you can track routers at specific sites or based on router type (e.g., enterprise routers versus branch routers).
Use Local and Public Monitoring Agents: For a more comprehensive view, use Local Agents (whether hardware or software) to monitor on-site routers, and Public Monitoring Agents for external performance comparisons, like through AWS or Azure. This way, you can compare internal performance against external benchmarks.
- 14-day free trial of all premium features
- Deploy in just 10 minutes
- Monitor performance in all key network locations
- Measure real-time network metrics
- Identify and troubleshoot live network problems

Step 2: Enable SNMP on Routers
For your router to communicate performance data back to your monitoring tool, you’ll need to enable SNMP (Simple Network Management Protocol) on your routers.
- Enable SNMP on your routers: Go into the router’s configuration and make sure SNMP is turned on. This allows your monitoring tool to collect critical metrics like CPU usage, memory usage, bandwidth, and interface errors.
- Use SNMPv3 when possible: If your router supports SNMPv3, use it! It provides secure authentication and encryption, ensuring that your data is safe while being monitored.
Supported Routers
Obkio supports a wide range of routers for SNMP monitoring. These include well-known models like:
Cisco Routers (ISR, ASR, Catalyst)
Juniper Networks (MX, SRX)
Fortinet FortiGate Routers
MikroTik, Ubiquiti, Peplink, and more...
If your router supports SNMP, chances are it’ll work with Obkio. The tool supports standard MIBs and can even accommodate custom OIDs for advanced setups.
Step 3: Configure SNMP Device Monitoring in Obkio
Now that SNMP is enabled, let’s add your router to the monitoring tool:
- Add Your Router as an SNMP Device: In Obkio’s dashboard, add your router as a new SNMP device. Enter the router’s IP address and the SNMP credentials you set up in Step 2.

- Select Metrics to Track: Choose which metrics you want to track. This could be WAN links, CPU, memory, or uplinks. The more granular you get, the better your monitoring insights will be.
- Start Polling: Once configured, Obkio will start polling your router at set intervals to collect real-time and historical data. This is the heart of your monitoring setup.

Step 4: Monitor Key Router Metrics
Now comes the real-time monitoring phase. Obkio's network and device monitoring tool will continuously monitor your router performance by collecting key metrics like:
- Interface Bandwidth and Utilization: Track how much bandwidth is being used on your router’s interfaces. High utilization could signal congestion, while low utilization could indicate underutilization of resources.
- Packet Loss and Latency: These two metrics are critical for identifying performance issues, especially if you’re running real-time services like VoIP or video. Packet loss will directly impact those services, while latency will cause delays.
- CPU and Memory Usage: Monitor the router’s CPU and memory usage. Overloaded resources can cause delays, instability, and packet loss.

- Interface Errors and Status: Errors on your router interfaces, like CRC errors or discards, point to potential hardware issues or misconfigurations.
- Device Availability/Uptime: If the router goes down, so does your network. Track uptime to catch any downtime before it impacts users.
These metrics are at the core of understanding router performance, because they'll help you understand if your router is working at is should be, or if there are potential performance issues. even the slightest variation in some of these metrics could suggest that something is wrong.

Step 5: Set Up Thresholds and Alerts for Router Issues
You don’t want to wait until things break, set up alerts to notify you when key metrics hit thresholds that could indicate a problem.
Configure thresholds for critical metrics like CPU, memory, and bandwidth usage. For instance, if your router’s CPU hits 90%, that’s a clear sign that something’s wrong and you need to take action.
Set network device alerts so that you’re notified in real-time when these thresholds are crossed. That way, you’ll be the first to know if something is off and can start troubleshooting right away.
Step 6: Use Historical Data to Troubleshoot Router Issues
Sometimes the problem isn’t immediate; it’s intermittent. This is where historical data comes in handy.
- Diagnose intermittent issues: If a router problem happens occasionally, historical reporting helps you dig into the past and see if any patterns emerge. You can see how performance has changed over time and pinpoint when things started to go wrong.
- Usage patterns and capacity planning: Looking at historical data also helps with capacity planning. Are you close to maxing out bandwidth or CPU capacity? Historical trends will give you the insight you need to plan upgrades.
- Validate ISP or MPLS SLAs: Use historical data to check if your router is meeting your SLAs with your ISP or MPLS provider. If there’s a performance dip, you can back it up with real data to show them where they’re falling short.

Step 7: Correlate Router Monitoring with Network Performance Monitoring
Router monitoring isn’t just about watching the router in isolation; it’s part of a bigger picture. Correlate your router monitoring with end-to-end network performance metrics to get a true view of what's happening in your network.
Combine SNMP data with overall network performance: If you detect high latency in your router metrics, but also see latency spikes in your WAN or cloud services, it could be a routing issue, not just the router itself. Correlating the data helps you pinpoint exactly where the problem is.
For example, let’s say high latency detected by agents + CPU spike on the router = likely a local routing issue. This gives you a much clearer picture and speeds up troubleshooting.

Unlock the secrets to network device monitoring! From routers to switches, discover insights to monitor core network devices with tools, tips & techniques.
Learn moreWhat Are Common Router Issues You May Uncover
We’ve all been there, dealing with a router issue that’s causing all sorts of problems across the network. Sometimes, these issues are easy to spot; other times, they hide under the surface and only become apparent when things start to slow down or break. Below are some of the most common router issues you may uncover while monitoring and the impact they can have on your network.
Common Router Issues #1. High CPU or Memory Utilization
What’s Happening: Routers rely on their CPU and memory to process traffic, handle routing tables, and manage network protocols. When these resources are maxed out, the router becomes overwhelmed.
What It Means for Your Network: An overloaded router can’t process data as efficiently, leading to delays, packet drops, or even crashes. You'll notice latency issues, dropped connections, or a complete network outage in extreme cases.
Why You Should Monitor: Monitoring CPU and memory utilization helps catch these issues early, before they affect user experience or cause an actual crash. It also helps you determine if your router needs an upgrade or if the workload needs to be distributed differently.

Common Router Issues #2. Interface Congestion or Saturation
What’s Happening: Every router has a finite amount of bandwidth available on its interfaces. When an interface, such as a WAN uplink, reaches its maximum capacity, it becomes congested.
What It Means for Your Network: This saturation impacts the performance of critical applications like VoIP, cloud services, and video conferencing. You’ll see degraded throughput and higher latency.
Why You Should Monitor: Monitoring interface utilization will let you know if a router is maxing out its available bandwidth, helping you identify congestion before it disrupts business-critical operations. It also helps you with capacity planning, so you can avoid hitting these limits in the future.
Common Router Issues #3. Packet Loss and Latency Spikes
What’s Happening: Packet loss happens when packets of data are dropped somewhere between the sender and receiver, while latency spikes are delays in transmission time. These issues can be caused by overloaded interfaces, faulty physical connections, or inefficient routing.
What It Means for Your Network: Packet loss and latency can destroy the performance of real-time applications like VoIP and video conferencing. If packets get lost or take too long to arrive, users will experience poor call quality, video freezes, or even disconnections.
Why You Should Monitor: You need to track both packet loss and latency to ensure your network is operating smoothly. Real-time monitoring helps you pinpoint where and when packet loss happens, allowing you to address the root cause before it impacts users.

Common Router Issues #4. Interface Errors and Discards
What’s Happening: Interface errors, like CRC errors, input/output drops, or collisions, typically indicate physical issues with the router’s interfaces, often due to cable issues, faulty ports, or misconfigured settings.
What It Means for Your Network: These errors usually lead to poor performance, lost packets, or connectivity issues. The longer these errors go unaddressed, the more unstable your network becomes.
Why You Should Monitor: Monitoring these errors in real-time lets you identify and resolve issues with cables, ports, or interface settings before they turn into full-blown outages. Ignoring interface errors can lead to long-term instability and unpredictable behaviour.
Common Router Issues #5. Flapping Interfaces or Routes
What’s Happening: Network Flapping occurs when an interface or routing path goes up and down intermittently. This could be caused by hardware issues, misconfigurations, or faulty connections.
What It Means for Your Network: Unstable interfaces or constantly changing routes disrupt network traffic, causing delays, outages, or inconsistent connectivity. This makes it difficult for users to access services or apps reliably.
Why You Should Monitor: Monitoring for flapping helps you identify and resolve the underlying issues, whether it’s a physical cable, a misconfigured interface, or a routing problem, before it results in full network instability.
Common Router Issues #6. Misconfigured QoS or Traffic Shaping
What’s Happening: Quality of Service (QoS) and traffic shaping are used to prioritize traffic and ensure that critical applications (like VoIP or video) get the bandwidth they need. Misconfigurations can lead to non-prioritized traffic starving important applications of bandwidth.
What It Means for Your Network: Misconfigured QoS can introduce jitter or cause delays in time-sensitive applications, while traffic shaping issues could lead to slower performance for essential services.
Why You Should Monitor: By monitoring QoS and traffic shaping, you ensure that your critical applications are getting the priority they need. You’ll also be able to spot misconfigurations early, preventing network slowdowns and improving overall user experience.

Learn how to monitor QoS performance on your private network, including MPLS, SD-WAN, or VPN, using Obkio's DSCP features.
Learn moreCommon Router Issues #7. Routing Loops or Black Holes
What’s Happening: Routing loops occur when traffic gets stuck in a never-ending cycle between routers, while black holes happen when routing tables point to unreachable destinations, effectively dropping traffic.
What It Means for Your Network: These issues can make services completely unreachable or cause traffic to bounce endlessly around the network, leading to congestion and network failure.
Why You Should Monitor: Monitoring routing tables can help you identify if routes are misconfigured, creating loops or black holes. By catching these errors early, you can prevent outages and ensure efficient traffic routing across your network.
Common Router Issues #8. Overloaded NAT or VPN Sessions
What’s Happening: When a router is handling too many NAT translations or VPN sessions, it can run out of resources and start dropping packets or terminating connections.
What It Means for Your Network: Overloaded NAT or VPN sessions can cause users to experience intermittent connectivity, slow performance, or even loss of remote access.
Why You Should Monitor: Monitoring these sessions helps you identify when your router is reaching its limits, allowing you to either scale your resources or distribute the load more effectively.
Common Router Issues #9. Firmware Bugs or Stability Issues
What’s Happening: Firmware bugs can cause all sorts of problems, from unpredictable behaviour and memory leaks to security vulnerabilities and performance degradation.
What It Means for Your Network: If your router’s firmware is unstable or outdated, you may experience random drops, crashes, or inconsistent performance.
Why You Should Monitor: Monitoring your router’s health and performance can help you spot signs of firmware instability. Ensuring that firmware is up-to-date and stable helps maintain optimal router performance and minimizes unexpected issues.
Common Router Issues #10. Lack of Redundancy or Failover
What’s Happening: Single-homed routers without redundancy or failover capabilities are a major point of failure. When one router goes down, everything goes down.
What It Means for Your Network: Lack of failover introduces a risk of downtime during maintenance or outages. Users may experience a complete loss of network access if the primary router fails.
Why You Should Monitor: Monitoring for failover readiness and redundancy ensures your backup systems are working properly. It helps ensure that if one router fails, another takes over without any disruption to network services.
By proactively monitoring these common issues, you can keep your routers running smoothly and avoid costly outages or network slowdowns. The key is catching the signs early so you can address the root cause before it spirals into a bigger problem.

Learn how to effectively monitor firewall performance, identify common issues, troubleshoot, and choose the right toolset.
Learn more3 Common Challenges With Router Monitoring and How to Overcome Them
Monitoring routers is essential, but it’s not always smooth sailing. As with any aspect of a network, there are a few challenges that can come up when you’re actively monitoring your routers.
1. Interpreting Raw Router Data Without Context
Routers generate tons of data like CPU usage, bandwidth, errors, packets lost, and so on. On the surface, these numbers can be helpful, but without context, they can be overwhelming and even misleading. For example, high CPU usage on its own doesn’t necessarily mean there’s a problem, often, it could just be that your router is processing a lot of traffic at the moment.
Why It’s a Problem?
Raw data is often hard to interpret. Without context, you might miss the real issue or, worse, mistake a normal fluctuation for a critical failure. This can lead to unnecessary troubleshooting efforts and wasted time, not to mention the risk of missing the real root cause of an issue.
How to Overcome It?
- Use baseline data: When you first set up monitoring, gather data during normal operation. This helps you understand what “normal” looks like for your routers and provides a reference point for when something deviates.
- Correlate with other network data: Look at the bigger picture. If you see high CPU usage, check for other metrics like bandwidth usage or packet loss. This will give you context to understand whether the router is under strain or if the issue is elsewhere in the network.
- Set thresholds and alerts: Instead of manually sifting through raw data, set up performance thresholds for key metrics. This way, the system can alert you when things go outside expected ranges, and you don’t have to manually interpret every little fluctuation.
2. Managing Alerts from Multiple Routers
If you’re managing multiple routers across a large network, you can easily get buried under a mountain of alerts. One router might trigger an alert for high CPU usage, another for interface errors, and yet another for latency spikes. With too many alerts coming in from different devices, it can quickly become hard to prioritize which ones matter most and which ones can wait.
Why It’s a Problem?
Too many alerts can lead to alert fatigue, where you start ignoring them or, worse, miss critical issues. If you can’t properly filter and manage alerts, you might end up focusing on minor issues while bigger, more pressing problems slip through the cracks.
How to Overcome It?
- Set up alert filtering and prioritization: Not all alerts are created equal. Configure your monitoring tool to prioritize high-severity alerts (e.g., router down, interface failure) over lower-severity ones (e.g., bandwidth nearing capacity). This way, you can focus on the issues that really matter.
- Use alerting thresholds: Set thresholds that make sense for each router and its role in the network. For example, a core router might have a lower CPU usage threshold than a branch router, because the core router handles more traffic.
- Consolidate alerts with dashboards: Use a centralized monitoring dashboard that lets you group and sort alerts by severity, location, or router type. This helps you quickly assess which issues need attention and which can be addressed later.
3. Ensuring Secure Access to Router Data
Routers are critical devices in your network, and their performance data is sensitive. If your monitoring tool has access to router data but isn’t secured properly, you could be leaving yourself open to unauthorized access or even security breaches. Routers may also have weak security settings, especially if SNMPv1 or SNMPv2 is enabled, which lack encryption and proper authentication.
Why It’s a Problem?
If unauthorized parties gain access to your router’s performance data, they could potentially exploit vulnerabilities or launch attacks. Additionally, insecure monitoring setups could allow attackers to tamper with router configurations, disrupt traffic, or even gain full control of your network.
How to Overcome It?
- Use SNMPv3: SNMPv3 provides encryption and better authentication methods compared to SNMPv1/v2. Always use SNMPv3 whenever possible to ensure that your data is transmitted securely.
- Implement strong authentication and access controls: Limit who can access your monitoring tool and router data. Use role-based access control (RBAC) and ensure that only authorized users can configure alerts, review sensitive data, or change settings.
- Secure communication channels: Always encrypt communication between your monitoring tool and your routers, especially when transmitting sensitive data over the network. This reduces the risk of data interception and tampering.
- Monitor access logs: Regularly review access logs to track who’s accessing the monitoring system and when. This can help you spot any unusual activity or unauthorized access attempts early on.
By recognizing and addressing these challenges, you can streamline your router monitoring setup, reduce the chances of missed alerts, and ensure that you have a secure, efficient monitoring process in place. It’s all about striking the right balance between getting the data you need and not overwhelming your routers or your team with unnecessary noise.
The Challenges of Managing WAN Links Through Router Monitoring
Monitoring WAN links via router monitoring can be incredibly valuable, but it’s not without its own set of challenges. From visibility issues to handling massive data volumes, there’s no shortage of obstacles you’ll face. Here’s a breakdown of the common challenges and how to overcome them to make your WAN monitoring efforts more effective.
1. Limited Visibility Across Distributed Sites
As more businesses adopt remote work and hybrid environments, WANs have become more distributed. You could have routers in branch offices, remote data centers, or even cloud-based instances spread across different geographic locations. Monitoring tools often struggle to provide a clear, end-to-end view of these dispersed systems.
Without centralized visibility, you could miss performance issues that affect remote or hybrid locations. If your tool doesn’t provide the ability to monitor both on-premise and cloud-based routers, it becomes difficult to pinpoint where the problem lies, especially when users from different locations are complaining about slow performance.
How to Overcome It:
- Deploy monitoring agents in key locations (headquarters, branch offices, data centers, and cloud providers like AWS or Azure) to get a better picture of performance across all sites.
- Use public monitoring agents to simulate traffic to/from remote sites to understand how performance differs from different geographic locations.
- Centralized dashboards: Leverage a monitoring tool with centralized visibility that can aggregate data from distributed locations into a single, easily digestible view.
2. High Volume of Data and Alerts
Routers constantly churn out telemetry data like interface utilization, error counts, packet loss, and more. This flood of data can quickly become overwhelming, especially when you’re monitoring multiple routers across a large WAN. As routers generate more data, the number of alerts increases, leading to alert fatigue and missed important signals.
When monitoring tools are not properly tuned, you risk drowning in a sea of data and alerts that may or may not be important. Without proper filters and thresholds in place, your team could miss crucial alerts in the noise.
How to Overcome It:
- Set up alert filtering and prioritization: Make sure your alerts are organized by severity so that the most critical issueslike a router going down or interface errors, get flagged immediately, while less pressing issues are logged for later investigation.
- Use threshold-based monitoring: Establish clear performance thresholds for each router. For example, if CPU usage exceeds 80%, an alert is triggered, but only if that threshold is breached. This helps prevent the system from spamming you with alerts for minor fluctuations.
- Leverage historical data: Instead of relying solely on real-time alerts, use historical data analysis to identify long-term trends and potential issues before they snowball.
3. Inconsistent Support Across Router Vendors
Different router vendors use different technologies and expose metrics in various formats, making it challenging to set up consistent monitoring across a multi-vendor environment. One vendor might provide extensive SNMP data, while another might require custom OIDs, leaving you with inconsistent monitoring visibility.
Inconsistent support across vendors can make centralized monitoring a headache. If your tool doesn’t support certain router brands or metrics, you risk incomplete visibility into your WAN performance, making it harder to troubleshoot issues across the network.
How to Overcome It:
- Choose a monitoring tool that supports multiple vendors: Select a router monitoring tool like Obkio that has broad SNMP support and is capable of collecting data from routers from different vendors (Cisco, Juniper, MikroTik, Ubiquiti, etc.).
- Standardize your Router monitoring strategy: When possible, standardize on a set of routers or devices to reduce the variability in metrics. If that's not possible, ensure your tool can handle multiple data formats and provide a centralized view.
- Custom MIBs and OIDs: Ensure that your monitoring tool can support custom MIBs and OIDs for more flexibility with less common routers or specific configurations.
4. Difficulty Identifying Root Causes of Issues
WAN performance issues often look similar at first glance, for example, high latency, jitter, or packet loss can be signs of a wide variety of issues, from misconfigured routers to overloaded links. Without a proper diagnosis, identifying the true root cause can be tricky.
It’s easy to mistake symptoms for the actual problem. For example, high latency could be caused by network congestion, a faulty link, or even routing issues. If you can’t properly correlate data from multiple sources, you may end up fixing the wrong issue or applying a band-aid solution that doesn’t address the root cause.
How to Overcome It:
- Correlate data from multiple metrics: Combine SNMP data with network performance metrics like flow data and end-to-end monitoring. For example, correlating high CPU usage on the router with high latency or packet loss might point to a local routing issue rather than a WAN congestion problem.
- Look at trends over time: Long-term historical data can reveal patterns that point to underlying issues, such as a slow degradation in router performance due to a hardware issue or firmware bug.
5. Polling Overhead on Devices
Frequent polling of routers for metrics can put additional strain on the router, especially in large, distributed environments where there are multiple routers to monitor. Too much polling can overwhelm both the monitoring tool and the router, potentially causing performance issues.
Frequent polling can drain router resources, especially CPU and memory, which are already under load from processing traffic. If misconfigured, this overhead can degrade router performance and lead to slowdowns or crashes.
How to Overcome It:
- Adjust polling frequency: Reduce the polling frequency for routers that aren’t critical or have low traffic. For high-priority routers or core routers, you might want more frequent polling, but for branch or edge routers, longer intervals may be sufficient.
- Switch to SNMP traps: Instead of polling frequently, use SNMP traps to receive data only when it changes. This reduces overhead by limiting the number of requests and allowing the router to send information only when certain thresholds are reached.

Learn when SNMP device monitoring is essential, where it falls short & how combining it with Network Performance Monitoring provides full network visibility.
Learn more6. Managing QoS and Bandwidth Policies
Routers often manage QoS (Quality of Service) and bandwidth policies to prioritize critical applications. However, it’s hard to monitor these metrics and ensure they align with real-time traffic shaping or QoS configurations.
If QoS isn’t enforced consistently, or if there’s a mismatch between router settings and real-time performance, applications that require low latency (like VoIP) could be starved of bandwidth, leading to poor performance or dropped calls.
How to Overcome It:
- Monitor QoS metrics directly: Ensure your monitoring tool provides visibility into QoS statistics, such as class-based traffic prioritization or bandwidth allocation for specific applications.
- Correlate QoS data with router metrics: Use tools that allow you to correlate real-time traffic with the router’s QoS settings. This helps ensure that bandwidth policies are enforced as expected across the WAN.
7. Security and Compliance Risks
If your monitoring setup isn’t secure, you could be exposing sensitive data, like routing information or performance metrics, to unauthorized access. Using older, less secure SNMP versions (like SNMPv1 or SNMPv2) or weak credentials increases the risk of an attack.
Exposing sensitive router data can lead to unauthorized access, network manipulation, or data breaches. Misconfigured monitoring setups can also make your network more vulnerable to attack.
How to Overcome It:
- Use SNMPv3: Always use SNMPv3 with encryption and authentication to secure communications between your routers and monitoring tools.
- Enforce strong access controls: Restrict access to your monitoring tools, router configurations, and SNMP data. Use role-based access control (RBAC) to ensure only authorized personnel can view or modify sensitive data.
- Regularly audit and update security settings: Keep monitoring systems and routers up to date with the latest security patches and conduct regular security audits to ensure your monitoring setup remains secure.
These challenges may seem daunting, but with the right tools and strategies in place, managing WAN links through router monitoring becomes more manageable. The key is to optimize your monitoring setup, reduce overhead, and ensure that you have the full visibility and context needed to make informed decisions.
Router Monitoring for Dual-WAN Setups
Dual-WAN (or multi-WAN) configurations have become a popular way to increase network reliability, boost performance, and ensure fault tolerance. A Dual-WAN network is a network setup that uses two separate Internet connections, typically from different ISPs, connected to the same router or firewall.
In a dual-WAN network, routers manage two Internet connections to improve reliability, performance, and uptime. They:
- Load balance traffic across both links to optimize bandwidth.
- Automatically failover to a backup WAN if the primary link goes down.
- Apply routing policies to prioritize apps or users per link.
- Monitor WAN health to make real-time routing decisions.

By using two WAN links, and multiple routers, businesses can distribute traffic across multiple paths, preventing a single point of failure. However, even with dual-WAN setups, network and router monitoring is crucial.
Without proper monitoring, issues like failover failures, asymmetric routing, or ISP degradation can go undetected, rendering the entire point of redundancy useless.
Why Dual-WAN Monitoring is Essential
In a dual-WAN environment, the router plays an even more critical role than usual. Here’s why monitoring is so important:
- Balancing Traffic: In a dual-WAN setup, your router is responsible for distributing bandwidth-heavy or priority traffic across the two WAN links. Without monitoring, you can’t ensure that this distribution is happening as planned, and you might end up overloading one link while the other is underutilized.
- Ensuring Failover: One of the biggest advantages of dual-WAN is automatic failover. If one link fails, the router should seamlessly switch traffic to the backup link. However, failover doesn’t always work as expected—if it’s not monitored, you might not even realize a failover happened or that it failed altogether.
- Enforcing Policies: Routers in a dual-WAN environment often manage Quality of Service (QoS), firewall rules, and route-based decisions for each WAN link. Without proper monitoring, you can’t be sure if these policies are working as intended and that your critical applications are getting the bandwidth they need.
Monitoring these capabilities in real-time ensures that your dual-WAN setup is performing as expected and that there are no hidden issues that could compromise your network's reliability.
What to Monitor in Dual-WAN Networks
To make sure your dual-WAN setup is working correctly, you need to keep a close eye on several key metrics and events. Here’s what you should monitor:
1. Link-Specific Latency and Packet Loss
Each WAN link should be monitored separately to identify performance degradation. Track latency and packet loss for each WAN interface, as these can indicate failing links or poor ISP performance.
If one link starts showing high latency or packet loss, it might be time to shift traffic to the other link, or even replace the faulty ISP. Keeping track of these metrics helps you spot issues before they significantly impact your users.
2. Failover Events and Uptime
Monitor failover events and uptime for each WAN interface. When a failure occurs, your router should automatically switch traffic to the backup WAN link.
If failover doesn’t occur when it should, users may experience downtime, or network traffic could be disrupted. Keeping logs of failover events and interface uptime helps you identify when failover works as intended—and when it doesn't.
3. Bandwidth Utilization per WAN Link
Monitor how traffic is being distributed across the two WAN links. Check bandwidth utilization for each interface and ensure that load balancing policies are being enforced as expected.
If one WAN link is consistently overused while the other is barely touched, it could mean that your load balancing policies are misconfigured. By keeping tabs on bandwidth utilization, you can ensure traffic is being distributed efficiently and prevent one link from becoming a bottleneck.
4. Routing Path Changes
Monitor when and why routing paths change. This is especially important in policy-based routing or dynamic routing setups, where traffic might be directed through specific WAN links based on certain criteria.
If routing paths change unexpectedly, it could signal an issue with your routing configuration or an unreliable WAN link. Monitoring these changes helps ensure that your traffic is being routed according to your policies and that there aren’t any unwanted disruptions.
5. QoS and Traffic Shaping Across Links
Monitor your QoS and traffic shaping policies to ensure they’re being enforced consistently across both WAN links. Pay attention to which applications are being prioritized and if the bandwidth allocation is functioning as expected.
If QoS or traffic shaping is not enforced properly, critical applications like VoIP or video conferencing may suffer from performance issues. For example, if VoIP traffic is incorrectly deprioritized when failover occurs, it could cause jitter or dropped calls. Monitoring these settings ensures that your policies work as intended across all links.

Master the art of Dual-WAN networks: Learn to monitor, troubleshoot, and optimize for peak performance. Elevate your network with Network Monitoring tools.
Learn moreHow to Make Sure Your Dual-WAN Monitoring Works
Proper monitoring of dual-WAN links involves more than just tracking basic metrics like bandwidth usage. You need to have a comprehensive view of both WAN links to ensure that failover happens correctly, traffic is balanced, and policies are enforced properly.
- Set Up Thresholds and Alerts: Define thresholds for bandwidth, latency, and packet loss so you’re immediately alerted when something’s wrong. For example, you might set an alert if one WAN link’s packet loss exceeds 2%, or if failover doesn’t occur within 30 seconds of a link failure.
- Integrate End-to-End Monitoring: Use tools that integrate end-to-end monitoring across both WAN links. This ensures that you can track user experience from the moment traffic leaves your office to when it reaches its destination, providing full visibility into how your WAN links are performing under load.
- Leverage Historical Data: Keep historical data logs of bandwidth utilization, failover events, and QoS settings to help you troubleshoot past issues and predict future performance bottlenecks. This also helps with capacity planning, especially when planning for additional load or link upgrades.
Using Obkio to Monitor Dual-WAN Routers
When it comes to monitoring dual-WAN setups, you need a solution that gives you full visibility into both WAN links, tracks failover behaviour, and provides detailed metrics that help you troubleshoot issues quickly. That’s where Obkio’s Network Performance Monitoring (NPM) and SNMP monitoring tools come in.
Let’s look at how Obkio can make managing your dual-WAN routers easier and more effective.
1. Continuously Test Each WAN Link Separately
Obkio’s monitoring agents are designed to continuously test the performance of each WAN link, ensuring you get a clear picture of how each link is performing.
Deploy Monitoring Agents in Different Locations or Public Clouds: With Obkio, you can set up monitoring agents in strategic locations—whether that’s within your on-premise network or across public clouds like AWS or Azure. These agents test each WAN link separately, giving you real-time performance data for both primary and backup WAN links.
This setup allows you to monitor the performance of your WAN links independently, so you can catch issues with one link without interference from the other. For example, if one link starts showing high latency or packet loss, you’ll know it’s time to investigate without worrying about how it might affect the other link.

2. Visualize Link Failover Behaviour
A key benefit of dual-WAN is automatic failover. But without proper monitoring, you may never know when a failover occurs or whether it happens as smoothly as it should.
Visualize Failover Events: Obkio allows you to visualize failover behaviour in real-time. If one WAN link fails or becomes unstable, Obkio will alert you immediately and track whether the failover happens as expected.
With Obkio, you won’t have to wait for users to complain about slow performance or downtime. You’ll know instantly if failover worked properly or if something went wrong, allowing you to take action before users are impacted.
3. Collect SNMP Metrics per Interface
When monitoring dual-WAN routers, it’s crucial to get detailed performance data for each WAN interface. Obkio’s SNMP monitoring provides granular insights into both primary and backup WAN links.
SNMP Metrics Collected: Obkio collects key SNMP metrics such as throughput, errors, and interface status for both primary and backup WAN links. This data includes things like bandwidth utilization, packet loss, and interface errors.
By collecting these metrics for each WAN interface, you can easily spot performance degradation or failures on one link while the other link continues to perform well. You’ll have all the data you need to troubleshoot issues quickly and efficiently, without having to dig through logs or manually check the router’s interface.

4. Provide Historical Data for Troubleshooting
Sometimes the problem isn’t immediately obvious, and you need to look back at past performance to figure out what happened. Obkio makes this easy by providing historical data that helps you troubleshoot past outages or performance degradation.
Historical Data Access: Obkio stores performance data over time, so you can easily review historical metrics for each WAN link. This data can help you identify trends or pinpoint when a performance issue began.
Having access to historical data helps you diagnose issues that might have occurred intermittently or over a long period of time. For instance, if an ISP starts degrading over time, historical data allows you to spot the trend and address the issue before it becomes a major problem.
Pro Tip: Use Obkio’s Public Monitoring Agents to Simulate User Traffic
One of the best ways to validate failover and ensure that your dual-WAN setup is working properly is by simulating real-world user traffic.
Public Monitoring Agents: Obkio’s Public Monitoring Agents allow you to simulate user traffic over each WAN path. By testing your WAN links with traffic from external agents (e.g., AWS or Azure), you can see exactly how each WAN link performs under real-world conditions.
This gives you a true-to-life validation of your WAN failover and performance. You’ll be able to see exactly how the traffic behaves when switching between WAN links and whether QoS or traffic shaping policies are working as expected.

Learn how to monitor SD-WAN networks with Network Monitoring to get complete visibility over your SD-WAN service and identify SD-WAN issues.
Learn moreCommon Dual-WAN Issues That Network and Router Monitoring Helps Prevent
Dual-WAN setups are designed to increase network reliability and redundancy, but without proper monitoring, these configurations can introduce new challenges. Monitoring helps ensure that everything is running smoothly, and it plays a critical role in preventing some of the most common issues that can undermine the benefits of having dual-WAN links. Here are some of the key issues monitoring can help prevent:
1. Unnoticed Primary WAN Failure Causing Degraded Service
In a dual-WAN setup, one link typically serves as the primary connection, while the other is the backup. If the primary WAN link fails, traffic should automatically switch to the backup link. However, without real-time monitoring, a primary WAN failure can go unnoticed until users start reporting degraded performance.
If the primary link fails but no one notices, users may experience a degraded experience. While the backup link may be in use, it might not have the same capacity, resulting in slower speeds, increased latency, or even service outages.
How Monitoring Helps:
- Real-time alerts: With Obkio’s monitoring tools, you can get immediate notifications when the primary WAN link goes down or starts performing poorly.
- Failover verification: Monitoring ensures that failover occurs as expected and alerts you if the traffic isn’t switching over to the backup link as it should.
- Why It’s Important: This proactive monitoring ensures that any failure on the primary link is quickly detected, allowing you to address it before it affects users or services.
2. Poor Load Balancing Leaving One Link Idle While the Other Is Saturated
In a dual-WAN configuration, one of the main goals is to balance traffic between both links, optimizing performance and preventing overload on any single connection. However, improper load balancing can leave one link idle while the other gets saturated with traffic, leading to inefficiencies and possible network slowdowns.
When load balancing isn’t properly managed, you may find that one WAN link is underutilized, while the other is overloaded. This can result in poor overall network performance, even though you technically have the capacity to handle more traffic across both links.
How Monitoring Helps:
- Monitor bandwidth utilization: With Obkio’s tools, you can track bandwidth utilization per WAN link to ensure traffic is being distributed evenly.
- Identify inefficiencies: By analyzing the load distribution, you can spot when traffic is not being properly balanced and take steps to adjust the load balancing configuration.
- Why It’s Important: Monitoring helps ensure that both links are being utilized effectively, maximizing your available bandwidth and preventing network congestion.

3. Failover Policies Triggering Too Slowly, or Not at All
A key feature of dual-WAN is automatic failover. When the primary WAN link fails, traffic should immediately switch to the backup link. However, if the failover policies are too slow or misconfigured, traffic may continue trying to route through the downed link, causing service disruptions.
Slow or malfunctioning failover can lead to downtime or service degradation, especially for applications that require low latency or consistent uptime (e.g., VoIP or video conferencing). Users might experience interruptions before the failover is triggered or not notice that the backup link has been engaged at all.
How Monitoring Helps:
- Track failover events: Obkio allows you to visualize failover behaviour and receive alerts if the failover takes too long or doesn’t happen at all.
- Real-time alerts: You’ll be notified instantly if failover doesn’t trigger as expected, giving you the chance to address the problem before users notice.
- Why It’s Important: Monitoring failover in real-time ensures that your failover policies are functioning correctly and that traffic is seamlessly rerouted to the backup WAN link when necessary.
4. Routing Loops or Asymmetric Routing Due to Misconfiguration
Routing loops occur when data packets continuously circulate between routers without reaching their destination, often due to a misconfiguration in routing tables. Asymmetric routing, where traffic takes different paths to and from the destination, can also occur if routing policies aren’t set up correctly.
Both routing loops and asymmetric routing can cause network instability, increased latency, and packet loss. Misconfigured routing in a dual-WAN setup could lead to traffic taking unnecessary detours, reducing performance or making services unreachable.
How Monitoring Helps:
- Monitor routing paths: With Obkio’s monitoring tools, you can track routing changes in real time and identify if routes are behaving as expected.
- Detect irregular routing behaviour: Monitoring routing tables helps you spot inconsistencies or loops, allowing you to troubleshoot routing issues quickly and correct misconfigurations.
- Why It’s Important: Proactively monitoring routing behaviour helps you identify and fix routing issues before they affect network performance, ensuring a more reliable dual-WAN setup.
Final Thoughts for Network Admins on Router Monitoring
After covering the key concepts of router monitoring, including the importance of SNMP, monitoring key metrics, and understanding the challenges specific to dual-WAN setups, here’s my final piece of advice:
Don't wait for problems to hit you when they’re at their worst.
Proactive monitoring is your first line of defence. By keeping an eye on performance metrics like CPU usage, memory, bandwidth utilization, and latency, you can spot potential issues long before they affect users or services. Monitoring allows you to make adjustments to load balancing, verify failover processes, and identify hardware or configuration problems before they escalate.
Set yourself up for success with the right monitoring tools. Invest the time upfront to configure your monitoring system, set clear thresholds, and ensure that you have comprehensive visibility into your network’s performance. Whether it’s tracking SNMP metrics or using public monitoring agents for real-world validation, the more data you have, the easier it will be to identify and fix issues before they impact the network.
As network admins, it’s your job to keep the network running, so let monitoring be the tool that makes it all possible.

Explore our Device Monitoring Tool!
- 14-day free trial of all premium features
- Deploy in just 10 minutes
- Monitor performance in all key network locations
- Measure real-time network metrics
- Identify and troubleshoot live network problems

