


Table of Contents
Table of Contents
Let's talk about the unsung heroes of the digital world – network administrators. For network administrators, ensuring that a network remains robust, resilient, and responsive is not just a priority – it's a mission-critical task. The ability to identify potential bottlenecks, optimize performance, and proactively address vulnerabilities is a skill that sets apart seasoned professionals from the rest.
In this article, we delve deep into the realm of network stability testing and unravel the intricacies of performing effective network stability tests.
To efficiently troubleshoot and resolve network failures, savvy network admins quickly test the network's stability to pinpoint the source of the issue. However, only the best network admins would proactively conduct a network stability test before any failure occurs to assess connection strength, identify errors, and spot potential weak points, preemptively addressing issues before they lead to a system crash.
So, get ready to navigate the intricacies of network stability testing, uncover the best practices, and empower yourself with the insights needed to maintain a robust and resilient digital infrastructure.
Down to Basics: What is Network Stability? 
The term network stability encapsulates the reliability and dependability of a computer network. It's the backbone that supports the seamless flow of data, ensuring that your organization's operations run like a well-oiled machine.
Network stability refers to a network's ability to maintain consistent, reliable performance under varying operational conditions. A stable network delivers predictable data transmission with minimal disruptions, handling normal traffic loads and unexpected spikes without significant performance degradation.
This reliability ensures that users experience uninterrupted connectivity, applications respond quickly, and business operations continue smoothly regardless of network demands.
I. What Does Network Stability Look Like In A Network? 4 Network Stability Metrics
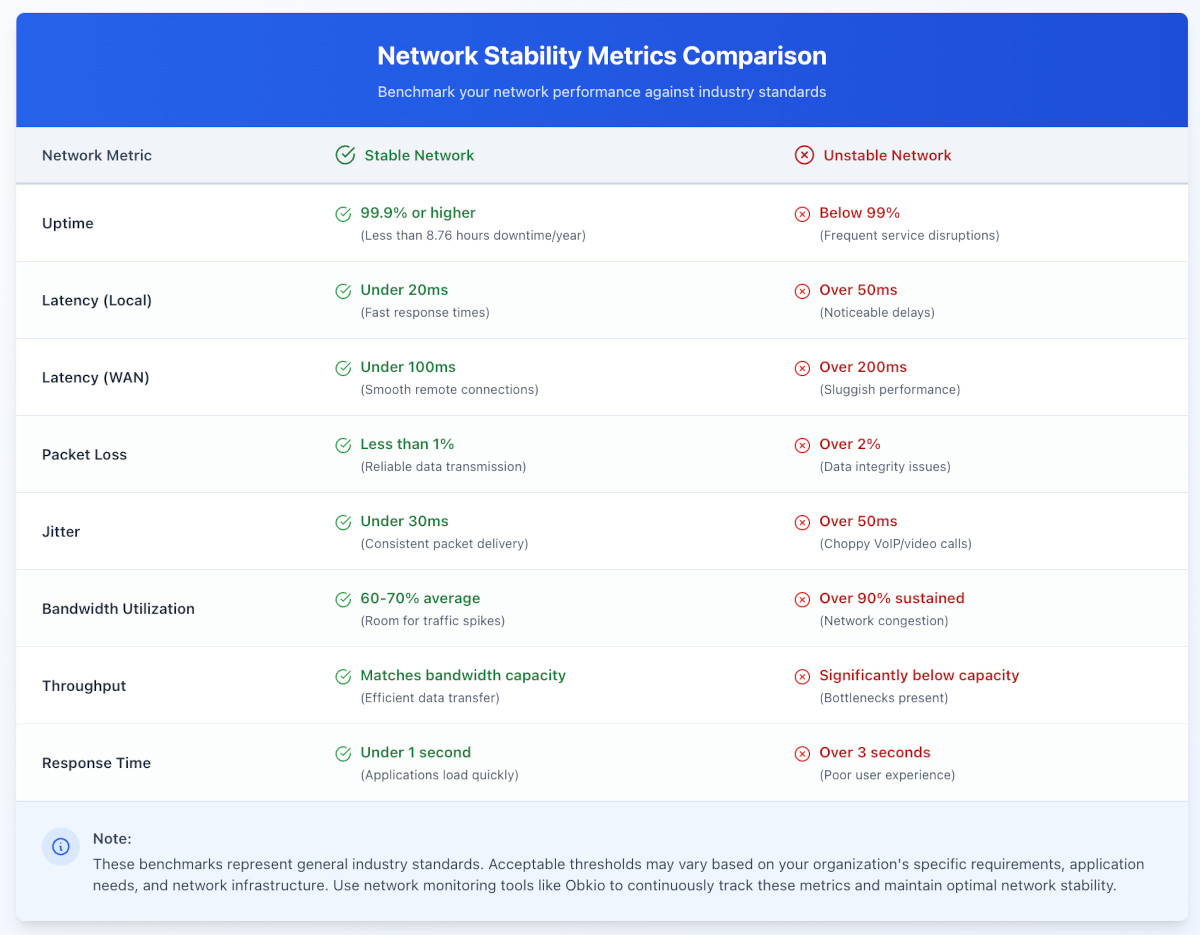
A stable network maintains consistent, reliable performance under varying conditions. If you're a Network administrator, and it's your job to ensure this, you can identify stability through four measurable characteristics: minimal downtime, low latency, adaptive traffic handling, and sustained performance levels.
Understanding these indicators helps you assess whether your network infrastructure can support business operations reliably
1. . Minimal Downtime and Maximum Availability:
A stable network experiences minimal downtime, meaning that the period during which the network is unavailable or inaccessible is kept to a minimum. This characteristic is crucial for businesses and organizations where continuous access to resources and services is essential for smooth operations. Industry-standard network uptime targets 99.9% or higher, meaning less than 8.76 hours of downtime annually.
2. Low Latency for Real-Time Performance:
Latency refers to the delay or lag in the transmission of data between devices on a network. In a stable network, good latency is kept low, ensuring that data travels quickly and efficiently between source and destination.
Low latency is particularly important for real-time applications, such as video conferencing, online gaming, and other time-sensitive tasks. Stable networks typically maintain latency below 20ms for local connections and under 100ms for WAN connections.
3. Adaptive Traffic Management
A stable network is capable of handling fluctuations in network traffic without experiencing significant performance degradation. Whether it's a sudden spike in user activity, increased data transfers, or peak usage periods, the network can adapt and efficiently distribute resources to ensure a consistent user experience.
During peak hours or unexpected traffic spike (such as company-wide video conferences or large file transfers) stable networks adjust resource allocation dynamically.
4. Consistent Performance Under Load
Even under high loads or demanding conditions, a stable network maintains its performance levels without a noticeable decline in speed or responsiveness. This resilience is achieved through effective network design, robust hardware, and, importantly, proactive network management practices.
This means maintaining throughput rates, avoiding packet loss above 1%, and keeping jitter below 30ms even during high-demand periods
These four characteristics work together to create network stability. Monitoring tools help network administrators track these metrics continuously, identifying stability issues before they impact users.

II. Why Network Stability Testing Matters for Network Admins
Now, let's talk about why network stability testing is your secret weapon as a network admin. Think of it as your proactive measure to prevent disasters before they strike. Network stability tests allow you to identify potential weaknesses, vulnerabilities, or bottlenecks in your network infrastructure before they escalate into major issues.
For network administrators, knowledge is power. By regularly subjecting your network to stability tests, you gain insights into its performance under various conditions. This knowledge empowers you to make informed decisions about upgrades, optimizations, or changes to ensure your network remains robust and resilient.
In a nutshell, network stability testing is your superhero cape. It equips you with the tools and information needed to keep your network in top-notch shape, ready to handle whatever challenges the digital world throws at it. It's not just about fixing problems; it's about staying ahead of them, ensuring your network is a reliable ally in the success of your organization.
What Are Network Stability Tests?
Ever wondered why some networks seem to handle everything the digital world throws at them without breaking a sweat? That's the magic of network stability tests.
Network stability tests are systematic evaluations conducted to gauge the reliability, resilience, and overall performance of a computer network. These tests simulate various scenarios and conditions to assess how well the network can handle different levels of stress, traffic, and potential challenges.
The primary goal is to identify weaknesses, potential points of failure, and performance bottlenecks before they impact real-world operations.
Network stability tests can take various forms, including stress testing, load testing, and performance testing. Stress testing involves pushing the network to its limits to evaluate its breaking points, load testing assesses how the network performs under specific levels of demand, and performance testing focuses on overall system responsiveness and efficiency.
Take Control of Your Network Stability with Obkio
Ready to supercharge your network stability? Look no further than Obkio's Network Performance Monitoring tool.
Obkio is a simple Network Monitoring and Troubleshooting SaaS solution designed to monitor end-to-end network performance from the end-user perspective. It uses distributed Monitoring Agents and synthetic traffic to monitor key network metrics like jitter, packet loss, latency, VoIP Quality (using MOS Score), network speed, QoS and more.

Why Choose Obkio:
- Real-Time Insights: Get instant visibility into your network's performance with real-time data and analytics. No more guessing games; just facts.
- Performance Testing: Obkio uses distributed Monitoring Agents and synthetic traffic to monitor key network metrics like jitter, packet loss, latency, VoIP Quality (using MOS Score), network speed, QoS and more and continuously test network performance.
- Proactive Issue Resolution: Identify potential bottlenecks before they become showstoppers. Obkio empowers you to fix issues before they impact your users.
- User-Friendly Interface: Navigate through your network's intricacies with ease. Our intuitive interface puts the power of network stability testing at your fingertips.
How to Get Started:

- Sign Up for Obkio: Head to Obkio’s website and sign up for a free trial. It's quick, easy, and the first step toward a more stable network.
- Install Agents: Deploy Obkio agents across your network to start gathering valuable data. Don't worry; it's a breeze with our user-friendly setup.
- Monitor and Optimize: Watch as Obkio works its magic, providing real-time data and actionable insights. Optimize your network with confidence.
Say goodbye to network uncertainties and hello to stability like never before. Your network deserves the Obkio advantage. Take the reins and master your network's destiny today!


10 Types of Network Stability Tests Every Admin Should Know
Network administrators use different testing methodologies to evaluate specific aspects of network performance and resilience. Each test type serves a distinct purpose in identifying potential weaknesses before they impact operations.
Here are the essential network stability tests you should know:
1. Stress Testing
Stress testing pushes your network to its breaking point by simulating extreme conditions—sudden traffic spikes, massive data transfers, or unexpected usage surges. This reveals maximum capacity limits and identifies where the network fails under pressure.
2. Load Testing
Load testing evaluates performance under specific demand levels. By gradually increasing data volume or connected devices, you determine network capacity thresholds and identify when performance begins degrading under sustained loads.
3. Performance Testing
Network performance testing measures overall responsiveness, speed, and efficiency across different applications and services. This comprehensive assessment ensures your network delivers consistent user experiences regardless of application type.
Learn how to perform network testing using Network Monitoring tools to test network performance, and identify network bugs and issues.

Learn how to perform network testing using Network Monitoring tools to test network performance, and identify network bugs and issues.
Learn more4. Latency Testing
Latency testing measures data transmission delays between network devices. Measuring latency ensures real-time applications like video conferencing and online gaming maintain acceptable response times, typically under 20ms for local networks.
5. Bandwidth Testing
Bandwidth testing evaluates how efficiently your network utilizes available capacity. Proper bandwidth distribution prevents congestion and ensures all connected devices and applications receive adequate resources during peak usage.
6. Error Handling Testing
This testing method examines how your network identifies and recovers from disruptions. By introducing simulated errors and failures, you verify the network's resilience and ensure localized issues don't cascade into system-wide outages.
7. Security Testing
Security testing probes for vulnerabilities and potential breach points. Simulated security incidents reveal weaknesses in authentication, encryption, and access controls, helping you strengthen defenses before real threats emerge.
8. Scalability Testing
Scalability tests verify your network can accommodate growth without performance loss. By gradually adding devices or increasing traffic volume, you identify scaling limitations and plan capacity upgrades proactively.
9. Redundancy and Failover Testing
This validates backup systems and failover mechanisms work as designed. Intentional failure scenarios test how quickly the network recovers and redirects traffic through alternative paths, minimizing downtime.
10. Quality of Service (QoS) Testing
QoS testing ensures critical applications receive priority treatment during network congestion. This confirms voice, video, and mission-critical services maintain performance levels even when bandwidth is constrained.

Building a Comprehensive Testing Strategy
Effective network stability requires combining multiple test types. Start with performance and latency testing to establish baselines, then use stress and load testing to identify limits. Regular security, failover, and QoS testing ensure ongoing resilience as your network evolves.
How to Prepare for A Network Stability Test: 5 Essential Steps
Accurate network stability testing requires thorough preparation. Rushing into tests without proper groundwork produces unreliable results and risks disrupting operations. Follow this systematic preparation checklist to ensure your stability assessment delivers actionable insights.
Step 1: Document Your Current Network Environment
Begin by conducting a comprehensive network assessment to establish your testing baseline. Understanding your network's architecture, topology, and data flow patterns is essential for designing relevant test scenarios.
Key elements to document:
- Network topology and architecture diagrams
- All connected devices (servers, switches, routers, endpoints)
- Geographic distribution of network sites and users
- Critical applications and their bandwidth requirements
- Current performance baselines (latency, throughput, packet loss)
- Existing bottlenecks or known issues
A thorough network assessment creates the foundation for targeted stability testing that reflects real-world conditions. Use our Network Assessment Template to streamline this documentation process.

Step 2: Select the Right Network Testing Tools
Your testing results are only as reliable as the tools you use. Choose network monitoring and testing solutions that align with your specific stability assessment goals and can scale with your network's growth.
Connectivity Testing Tools: Ping and Traceroute provide basic connectivity verification and path analysis. These fundamental tools identify packet loss, measure latency, and map network routes, making them essential for initial troubleshooting.
Network Performance Monitoring (NPM) Solutions: Comprehensive NPM platforms continuously monitor network performance, delivering real-time insights into bandwidth utilization, latency trends, and device health across your entire infrastructure.
Load and Stress Testing Tools: Specialized load testing applications simulate high user traffic volumes, helping you identify performance bottlenecks and validate capacity limits before they impact production.
Automated Continuous Testing
Obkio's Network Performance Monitoring solution automates network stability testing through continuous synthetic traffic and real-time metric collection. The platform measures critical indicators including latency, jitter, packet loss, and throughput, providing immediate visibility into stability issues.

Tool selection criteria:
- ✓ Meets current testing requirements
- ✓ Scales for future network growth
- ✓ Provides historical data and trend analysis
- ✓ Offers automated alerting capabilities
- ✓ Integrates with existing monitoring infrastructure
Step 3: Create Comprehensive Configuration Backups
Network stability tests can stress systems and potentially trigger unexpected behavior. Protect your infrastructure by implementing robust backup procedures before initiating any testing.
Critical backup requirements:
Configuration Files: Back up all device configurations including routers, switches, firewalls, and load balancers. Store these backups in a secure, off-network location with version control.
Network Documentation: Save current network diagrams, IP addressing schemes, VLAN configurations, and routing tables. This documentation accelerates recovery if testing requires rolling back changes.
Baseline Performance Data: Capture pre-test performance metrics to establish comparison benchmarks. This baseline data helps you measure the impact of any configuration changes made during or after testing.
Recovery Procedures: Document step-by-step rollback procedures for each testing phase. Clear recovery instructions minimize downtime if tests reveal issues requiring immediate remediation.
Step 4: Schedule Testing During Maintenance Windows
Timing significantly impacts test accuracy and risk management. Plan stability tests during approved maintenance windows when network disruptions cause minimal business impact.
Scheduling best practices:
- Coordinate with stakeholders and communicate testing schedules
- Avoid peak business hours and critical operational periods
- Allow sufficient time for both testing and potential remediation
- Schedule follow-up windows for addressing identified issues
- Plan for extended testing if initial results require deeper investigation
Step 5: Establish Success Criteria and Measurement Baselines
Define what success looks like before beginning tests. Clear metrics and acceptance criteria ensure objective evaluation of your network's stability.
Define testing objectives:
- Specific metrics to measure (latency thresholds, packet loss limits, throughput targets)
- Acceptable performance ranges under various load conditions
- Pass/fail criteria for each test type
- Documentation requirements for test results
- Escalation procedures for critical issues discovered during testing
Proper preparation transforms network stability testing from a risky operation into a valuable assessment that strengthens your infrastructure. With thorough groundwork, you gain the key insights while minimizing disruption risk and ensuring rapid recovery from any unexpected issues.

How to Choose Your Network Stability Testing Strategy: Performance, Stress, or Load?
When it comes to assessing network stability, selecting the right testing strategy is key. Each strategy addresses specific aspects of network performance, allowing businesses to tailor their testing approach to their unique needs.
Let's delve into the three main testing strategies:

1. Network Performance Testing: A Smooth & Snappy Way to Test Network Stability
Network Performance Testing evaluates how well the network performs under normal and expected conditions. This type of testing aims to ensure that the network delivers a consistently smooth and responsive experience for users.
Network Performance Testing Scenarios:
- Assess the response time of critical applications.
- Measure the efficiency of data transfers within the network.
- Evaluate the overall user experience under standard operating conditions.
Performance testing provides insights into the network baseline capabilities of the network, helping businesses maintain optimal functionality and user satisfaction during routine operations.

Network Performance Testing Metrics:
In a network performance test, network admins use Network Performance Monitoring tools to evaluate various aspects to ensure that the network operates efficiently, reliably, and meets the requirements of users and applications. Here are key elements that are commonly tested in a network performance test:
- Bandwidth: Measure the actual data transfer rate to determine the available bandwidth. Assess the network's capacity for handling data traffic and identify potential limitations.
- Latency: Evaluate the delay between the initiation of a data transfer and the actual delivery. Ensure low latency for real-time applications, such as video conferencing and online gaming.
- Packet Loss: Monitor the percentage of data packets lost during transmission. Identify areas of packet loss and network instability and potential issues affecting the quality of data transmission.
- Jitter: Measure the variation in latency over time. Identify jitter and assess the consistency of data packet delivery, particularly important for real-time applications.
- Throughput: Evaluate throughput, the actual amount of data transferred over the network in a given period. Determine the network's capacity for handling data loads and understand its efficiency in delivering data.
- Connection Reliability: Assess the reliability of network connections by monitoring for drops or interruptions. Ensure consistent and reliable connectivity to prevent service disruptions.
- Response Time: Measure the time it takes for a system or application to respond to a request. Evaluate the responsiveness of critical applications and services.
- Application Performance: Use APM to evaluate the performance of specific applications, services, or protocols. Ensure that critical applications perform optimally and meet user expectations.
- Security Performance: Assess the performance of security protocols and measures. Verify that security measures do not significantly impact network performance and identify potential vulnerabilities.
- Quality of Service (QoS): Validate that the network prioritizes and maintains service levels for critical applications. Ensure that essential applications receive the necessary bandwidth and resources.
By testing these aspects, administrators gain a holistic view of the network's performance, enabling them to identify and address potential issues, optimize resources, and ensure a seamless experience for users and applications.
Network Performance Testing with Network Performance Monitoring Tools
When it comes to comprehensive network performance testing, leveraging a specialized Network Performance Monitoring (NPM) tool like Obkio can elevate your testing capabilities.
Network performance testing with Obkio goes beyond traditional assessments, offering a suite of features designed to align with your specific testing needs. Whether you're evaluating critical applications, monitoring real-time metrics, or ensuring user satisfaction, Obkio's NPM tool provides the tools you need for a comprehensive and effective network performance testing strategy.
2. Stress Testing: Pushing the Limits to Test Network Stability
Network Stress Testing determines the breaking points and limitations of the network by subjecting it to extreme conditions. Stress testing helps identify potential weaknesses, vulnerabilities, and points of failure under heavy loads.
Network Stress Testing Scenarios:
- Simulate sudden spikes in user activity or data transfers.
- Push the network to its capacity limits to assess its resilience.
- Identify critical failure points and how the network recovers under stress.
Stress testing is invaluable for understanding the thresholds of a network, enabling administrators to fortify weak points and ensure the network can handle unexpected surges in demand without collapsing.
Network Stress Testing Metrics:
In a network stress test, the goal is to evaluate the network's resilience and performance under extreme conditions. Stress testing involves subjecting the network to levels of demand and traffic that exceed normal operational parameters.
- Maximum Capacity: Push the network to its maximum network capacity by generating high volumes of data traffic. Determine the breaking point of the network and understand its limits under extreme load.
- Sudden Traffic Spikes: Simulate sudden and significant spikes in user activity or data transfers. Assess how well the network can handle rapid increases in demand, mimicking scenarios such as viral content or sudden service popularity.
- Data Transfer Rates: Evaluate the efficiency of data transfers at maximum network capacity. Identify potential bottlenecks in data transfer rates and ensure optimal performance even under extreme conditions.
- Resource Utilization: Monitor the utilization of network resources, including bandwidth, CPU usage, and memory. Identify resource constraints and ensure that the network can efficiently allocate resources during high-demand scenarios.
- Packet Loss and Latency: Introduce high levels of packet loss and increased latency. Evaluate how the network handles adverse conditions, such as degraded packet delivery and increased communication delays.
- Failover and Redundancy: Trigger failures and test the effectiveness of failover mechanisms and redundancy measures. Ensure that the network can recover quickly from failures, redirect traffic through alternative paths, and maintain operations without significant network downtime.
- Impact on Critical Applications: Assess the impact of stress conditions on critical applications and services. Identify potential vulnerabilities in application performance and ensure that essential services remain responsive under stress.
- Load Distribution: Evaluate how well the network distributes and balances the load under extreme conditions. Ensure that resources are allocated efficiently, preventing congestion and bottlenecks in specific areas of the network.
3. Load Testing: How to Test Network Stability When Everyone Shows Up
Network Load Testing assesses how well the network performs under specific levels of demand or traffic. Load testing helps businesses understand the network's capacity to handle varying loads and ensures it remains responsive during peak usage periods.
Network Load Testing Scenarios:
- Gradually increase the volume of data transfers or connected devices.
- Evaluate the network's ability to distribute resources efficiently.
- Measure the impact of increased traffic on overall performance.
Load testing allows businesses to proactively address potential congestion issues, optimize resource allocation, and guarantee a seamless user experience, even during periods of heightened activity.
Network Load Testing Metrics:
In a network load test, the objective is to assess how well the network performs under specific levels of demand or traffic. Here are key elements commonly tested in a network load test:
- Gradual Traffic Increase: Gradually increase the volume of data traffic or connected devices. Evaluate the network's ability to handle incremental increases in load and identify the point at which performance starts to degrade.
- Steady-State Traffic: Apply a consistent and sustained level of data traffic over a prolonged period. Assess the network's stability and performance under continuous load, simulating real-world scenarios of sustained high demand.
- Resource Allocation: Monitor the allocation of resources such as bandwidth, CPU, and memory during increased traffic. Ensure that the network efficiently distributes resources to prevent congestion and bottlenecks.
- Application Performance: Evaluate the performance of specific applications or services under increased load. Identify any degradation in application performance and ensure that critical services remain responsive.
- Response Time: Measure the response time of critical network services and applications. Determine whether response times remain within acceptable limits as the network load increases.
- Bandwidth Utilization: Examine how effectively the network utilizes available bandwidth during increased traffic. Ensure equitable distribution of bandwidth to prevent overutilization in specific areas of the network.
- Connection Handling: Evaluate the network's ability to handle an increased number of simultaneous connections. Identify the maximum number of concurrent connections the network can support without degrading performance.
- Fault Tolerance: Introduce simulated faults or failures during increased load. Evaluate the network's fault tolerance and its ability to recover from failures without significant impact on performance.

Explore the world of network administration with insights on network load testing, network load balancing, and the role of NPM. Optimize your network today!
Learn moreHow to Execute a Network Stability Test: 7-Step Implementation Guide
Network stability testing transforms from theory to practice through systematic execution. This step-by-step implementation guide walks you through deploying monitoring agents, configuring test parameters, and interpreting results to identify performance issues before they impact users.
Step 1: Define Clear Testing Objectives and Success Criteria
Establish specific, measurable objectives before initiating any stability test. Vague goals produce ambiguous results, while precise objectives enable actionable insights.
Key questions to answer:
- What specific problem are you investigating? (User complaints, capacity planning, new deployment validation)
- Which network segments require testing? (WAN links, data center connections, cloud pathways, remote sites)
- What metrics define success? (Latency thresholds, acceptable packet loss percentages, minimum throughput rates)
- Which applications are most critical? (VoIP systems, video conferencing, ERP applications, cloud services)
- What baseline performance do you expect? (Reference historical data or SLA requirements)
Example objectives:
- "Validate that WAN latency between headquarters and remote offices remains below 50ms during business hours"
- "Ensure packet loss stays under 0.5% on critical application paths during peak traffic periods"
- "Verify the network can sustain 500 simultaneous video conference connections without degradation"
Document your objectives clearly—they'll guide test configuration and help you recognize when results indicate problems requiring immediate attention.
Step 2: Select and Configure Network Stability Testing Testing Tools
Choose network monitoring and testing tools aligned with your specific objectives. The right tools provide the visibility and control needed for effective stability assessment.
Essential tool capabilities:
- Real-time monitoring: Immediate visibility into network performance as tests run
- Historical data collection: Trend analysis to identify patterns and recurring issues
- Multi-location deployment: Distributed monitoring for comprehensive network coverage
- Synthetic traffic generation: Consistent, controllable test traffic that simulates real usage
- Automated alerting: Notifications when metrics exceed thresholds
- Detailed reporting : Clear visualization of results for stakeholder communication

Network Performance Monitoring (NPM) tools like Obkio deliver continuous stability testing through automated synthetic traffic and real-time analytics. The platform monitors critical metrics including latency, jitter, packet loss, throughput, and VoIP quality (MOS scores), providing comprehensive visibility into network stability.
Step 3: Configure Network Stability Test Parameters and Monitoring Settings
Customize test parameters to reflect your specific objectives and network characteristics. Proper configuration ensures tests produce relevant, actionable data.
Test Frequency
- Continuous monitoring: Measures every 500ms to 1 minute for real-time visibility
- Scheduled tests: Hourly, daily, or weekly for capacity validation
- Event-triggered tests: Activated by specific conditions or scheduled events
Traffic Patterns
- Application-specific: Configure tests mimicking VoIP, video, or data transfer patterns
- Bandwidth allocation: Set test traffic volume (typically 0.25-2 Mbps to avoid impact)
- Protocol selection: UDP for latency/jitter, TCP for throughput testing
Threshold Configuration
- Latency alerts: Trigger when delay exceeds acceptable limits (e.g., >100ms for WAN)
- Packet loss thresholds: Alert on loss exceeding 1%
- Jitter limits: Notify when variation surpasses 30ms
- Bandwidth utilization: Warn when capacity exceeds 70-80%
Test Duration
- Baseline establishment: Run tests for minimum 7 days to capture weekly patterns
- Issue investigation: 24-48 hours focused monitoring during problem periods
- Capacity validation: 1-4 hours of sustained load testing
- Stress testing: Progressive load increase over 2-6 hours
Configure alerts to notify administrators immediately when metrics fall outside acceptable ranges, enabling proactive response before users experience impact.
Step 4: Deploy Monitoring Agents Strategically
Install monitoring agents at strategic network locations to capture comprehensive performance data. Proper agent placement ensures you identify issues wherever they occur in your infrastructure. Following Obkio's Onboarding Wizard during your free trial will help you with this.

Branch Office/Remote Sites: Deploy agents at each remote location to monitor WAN connections, identify last-mile issues, and validate ISP service levels.
Data Centers: Position agents in each data center to monitor server connectivity, inter-datacenter links, and application response times.
Cloud Environments: Install agents in AWS, Azure, Google Cloud, or other cloud platforms to measure cloud connectivity performance and validate hybrid infrastructure.
Key Network Junctions: Place agents at major network convergence points, load balancers, and firewall boundaries to identify bottlenecks in critical pathways.
User-Dense Locations: Deploy agents in areas with high user concentrations to ensure adequate performance where demand is greatest.
Obkio's Monitoring Agents function as distributed sensors that continuously exchange synthetic traffic between locations. These lightweight software agents measure bidirectional performance across your entire network infrastructure—from headquarters to remote offices, data centers to cloud platforms.
Step 5: Initiate Network Stability Testing and Validate Data Collection
Launch your stability tests according to configured parameters and verify that monitoring systems collect data correctly. Early validation prevents wasting time on tests that produce unreliable results.
Pre-test validation checklist:
- [ ] Confirm all monitoring agents report online status
- [ ] Verify synthetic traffic flows between all agent pairs
- [ ] Check that baseline metrics appear in monitoring dashboard
- [ ] Validate alert configurations trigger test notifications
- [ ] Ensure historical data logging functions properly
Test execution considerations:
- Timing: Schedule tests during representative periods—avoid holidays, maintenance windows, or atypical usage patterns when establishing baselines. For issue investigation, time tests to coincide with problem occurrence windows.
- Communication: Notify stakeholders about testing schedules, especially for load or stress tests that might impact production. Coordinate with security teams to whitelist synthetic traffic and prevent false positive security alerts.
- Monitoring During Tests: Obkio's real-time monitoring provides immediate visibility as tests run. Watch for unexpected behavior, verify metrics fall within expected ranges, and remain available to respond if tests trigger alerts indicating serious issues.
Step 6: Monitor Real-Time Results and Identify Anomalies
Actively observe network performance as tests progress. Real-time monitoring enables immediate problem identification and allows you to adjust test parameters if initial results reveal unexpected behaviors.
What to watch for during testing:
Performance Degradation Patterns
- Gradual degradation suggesting capacity saturation or resource exhaustion
- Sudden spikes indicating intermittent issues or specific event triggers
- Cyclical patterns revealing time-based problems (daily peaks, weekly cycles)
- Progressive decline pointing to configuration drift or failing hardware
Threshold Violations Monitor alert notifications indicating metrics exceeding acceptable limits:
- Latency spikes above defined thresholds
- Packet loss percentages impacting application quality
- Jitter variations disrupting real-time communications
- Throughput drops below minimum acceptable rates
Correlation Analysis Look for relationships between metrics that reveal root causes:
- High bandwidth utilization coinciding with latency increases
- Packet loss patterns matching specific time periods or applications
- Jitter spikes during high-traffic scenarios
- Performance issues isolated to specific network segments
Geographic or Path-Specific Issues Identify whether problems affect:
- Specific remote sites (suggesting ISP or last-mile issues)
- Particular network paths (indicating routing or equipment problems)
- Certain application types (revealing QoS configuration issues)
- Cloud or data center connections (pointing to WAN or provider problems)
Real-time monitoring transforms testing from passive data collection into active problem-solving, enabling immediate response to issues as they emerge.
Step 7: Record, Analyze, and Document Network Stability Test Results
Comprehensive result analysis transforms raw performance data into actionable insights. Systematic documentation ensures you can reference findings, track improvements, and justify infrastructure investments.
Data analysis framework:
Quantitative Analysis
- Calculate average, minimum, maximum, and 95th percentile values for each metric
- Identify outliers and investigate what caused exceptional readings
- Compare results against baselines, SLAs, and industry benchmarks
- Measure performance changes over time to identify trends
Qualitative Assessment
- Document user experience during test periods (complaints, support tickets)
- Note correlation between measured metrics and perceived performance
- Identify which issues impact users most significantly
- Assess whether network meets business requirements despite technical imperfections
Pattern Recognition Obkio's historical data and trend analysis reveal patterns over time:
- Peak usage periods requiring capacity adjustments
- Recurring issues suggesting systematic problems
- Seasonal variations affecting performance
- Progressive degradation indicating failing equipment
Root Cause Identification Move beyond symptoms to underlying causes:
- High latency caused by inadequate bandwidth vs. routing inefficiencies
- Packet loss from failing hardware vs. ISP network problems
- Jitter resulting from network congestion vs. QoS misconfiguration
- Throughput limitations from bandwidth constraints vs. application bottlenecks

How to Determine Good vs. Bad Network Stability
Assessing network stability requires looking beyond individual metrics to understand how your network actually performs for users and business operations. Use this practical framework to evaluate your network's health.
Good Network Stability: Key Indicators
A stable network operates smoothly with consistent, reliable performance. Users work productively without thinking about connectivity, and IT teams spend time on improvements rather than firefighting.
Technical benchmarks:
- Latency: LAN <20ms, WAN <100ms
- Packet loss: Consistently <0.5%
- Jitter: <30ms average
- Bandwidth utilization: 40-70% normal, peaks <80%
- Uptime: 99.9%+ (less than 8.76 hours downtime/year)
- MOS scores: 4.0+ for VoIP
User experience:
- Applications load quickly and respond immediately
- Video calls proceed without quality issues
- Few network-related helpdesk tickets
- Remote access feels comparable to office experience
Bad Network Stability: Warning Signs
Poor stability creates friction throughout your organization, with users developing workarounds and IT teams constantly addressing issues.
Technical red flags:
- Latency frequently >100ms on LAN/regional WAN
- Packet loss consistently >1%, frequent extended events
- Jitter regularly >40ms, MOS scores <3.8
- Bandwidth utilization sustained >85%
- Uptime <99.5% (43+ hours downtime/year)
User experience:
- Frequent "slow network" complaints
- Video calls require cameras disabled
- File transfers fail, require multiple retries
- High volume of network-related support tickets
Establishing Your Baseline
To determine if YOUR network is stable, establish a baseline specific to your environment:
- Define requirements: Identify critical applications and set specific performance targets
- Measure performance: Deploy continuous monitoring like Obkio and collect 7+ days of data
- Compare results: Evaluate against benchmarks and your specific requirements
- Score and act: Use the framework above to identify your stability tier
Critical Warning Signs
Conduct immediate assessment if experiencing:
- 3+ network outages within a month
- Uptime drops below 99% for sustained periods
- Increasing user complaints about performance
- Business operations disrupted by connectivity
- Emergency network spending exceeding budget
Good network stability means your network reliably supports business operations without users constantly thinking about connectivity. Bad stability means the network becomes an obstacle consuming time, money, and patience. You can't improve what you don't measure—deploy comprehensive monitoring to maintain visibility and catch issues before they impact users.
What Are Network Stability Metrics & How to Interpret Them
Network stability tests generate vast amounts of performance data, but raw numbers alone don't tell the complete story. Interpreting metrics correctlym understanding what values mean, why they matter, and how they interact, transforms data into actionable insights that drive network improvements.
This section explains how to read, understand, and act on the key metrics that define network stability.
Latency: Measuring Network Responsiveness
Latency measures the time delay between sending a data packet and receiving a response, measured in milliseconds (ms).
Why it matters: Latency directly impacts user experience, especially for real-time applications. High latency makes video calls choppy, delays VoIP conversations, and frustrates users interacting with cloud applications.
How to interpret the numbers:
| Latency Range | Network Segment | Assessment | Impact |
|---|---|---|---|
| 0-20ms | Local/LAN | Excellent | Imperceptible to users |
| 20-50ms | Regional WAN | Good | Acceptable for most applications |
| 50-100ms | Long-distance WAN | Acceptable | Noticeable in real-time apps |
| 100-200ms | Intercontinental | Poor | Significant delays in interactions |
| 200ms+ | Any segment | Critical | Severely impacts user experience |
What different patterns mean:
- Consistent low latency: Network operating normally with adequate capacity
- Gradual latency increase: Growing congestion or approaching capacity limits
- Sudden latency spikes: Network congestion, routing changes, or equipment issues
- Time-based patterns: Latency increases during business hours suggest insufficient bandwidth
- Path-specific latency: High latency on specific routes indicates ISP or routing problems
Action triggers:
- Latency consistently above 100ms on WAN links → Investigate ISP performance or consider bandwidth upgrades
- Sudden latency spikes → Check for network congestion, misconfigurations, or failing equipment
- Gradual latency increases over time → Plan capacity upgrades before user impact

Learn how to measure latency with Obkio’s Network & Latency Monitoring tool. Check for latency in your network & analyze latency measurements.
Learn morePacket Loss: Detecting Data Transmission Failures
Packet Loss is the percentage of data packets that fail to reach their destination during transmission.
Why it matters: Even small amounts of packet loss degrade application performance significantly. Lost packets must be retransmitted, causing delays and reducing effective throughput. For real-time applications like VoIP and video, packet loss creates gaps, distortion, and poor quality.
How to interpret the numbers:
| Packet Loss | Assessment | Impact | Typical Cause |
|---|---|---|---|
| 0-0.5% | Excellent | Minimal impact | Normal network operations |
| 0.5-1% | Good | Noticeable in VoIP/video | Minor congestion or interference |
| 1-2% | Poor | Significant quality degradation | Network congestion or errors |
| 2-5% | Critical | Unusable for real-time apps | Serious network issues |
| 5%+ | Severe | Applications may fail entirely | Equipment failure or severe congestion |
What different patterns mean:
- Zero packet loss: Ideal network conditions with adequate capacity
- Consistent low packet loss (<1%): Minor congestion or interference, monitor for trends
- Intermittent packet loss bursts: Network congestion during traffic peaks or routing instability
- Steady packet loss: Overutilized links, failing equipment, or ISP issues
- Bidirectional vs. unidirectional loss - Unidirectional loss often indicates ISP or routing problems on specific paths
Action triggers:
- Any packet loss above 1% → Investigate immediately, especially for VoIP/video environments
- Packet loss during specific times → Bandwidth insufficient for peak demand
- Packet loss on specific network segments → Check equipment health and link utilization

Jitter: Measuring Timing Consistency
Jitter measures the variation in packet arrival times, measured in milliseconds. Jitter represents the inconsistency of latency over time.
Why it matters: Even with acceptable average latency, high jitter disrupts real-time communications. Voice and video applications require consistent packet timing—irregular delivery causes choppy audio, frozen video frames, and poor call quality.
How to interpret the numbers:
| Jitter Range | Assessment | Impact on VoIP/Video |
|---|---|---|
| 0-10ms | Excellent | Crystal clear quality |
| 10-30ms | Good | Acceptable quality |
| 30-50ms | Poor | Noticeable degradation |
| 50ms+ | Critical | Unusable for real-time apps |
What different patterns mean:
- Low consistent jitter: Stable network with predictable performance
- High jitter with normal latency: Network congestion or prioritization issues (QoS problems)
- Jitter spikes during peak hours: Insufficient bandwidth causing buffering inconsistencies
- Path-specific jitter: Routing issues or congested network segments
Action triggers:
- Jitter above 30ms → Implement or optimize QoS policies to prioritize real-time traffic
- High jitter with low bandwidth utilization → Check for misconfigurations or routing inefficiencies
- Jitter affecting VoIP quality → Use MOS scores to quantify call quality impact

Learn what network jitter is, how it affects VoIP & video calls, and proven methods to measure and reduce jitter in your network
Learn moreBandwidth Utilization: Measuring Capacity Consumption
Bandwith is the percentage of available bandwidth currently being used for data transmission.
Why it matters: Bandwidth utilization reveals whether your network has sufficient capacity for current demands and room for growth. High sustained utilization leads to congestion, increased latency, and packet loss.
How to interpret the numbers:
| Utilization | Assessment | Recommendation |
|---|---|---|
| 0-40% | Underutilized | Adequate capacity, monitor trends |
| 40-70% | Normal | Healthy usage with headroom |
| 70-85% | Warning | Plan capacity upgrades soon |
| 85-95% | Critical | Immediate capacity increase needed |
| 95-100% | Severe | Network congestion occurring now |
What different patterns mean:
- Consistent low utilization: Over-provisioned capacity or underutilized network
- Utilization peaks during business hours: Normal usage patterns, ensure peaks stay below 70-80%
- Sustained high utilization: Insufficient bandwidth causing performance degradation
- Sudden utilization spikes: Backup jobs, file transfers, or unusual traffic patterns
- Unbalanced utilization: Some links congested while others idle suggests routing or load balancing issues
Action triggers:
- Sustained utilization above 70% → Plan bandwidth upgrades before reaching critical levels
- Regular peaks above 85% → Immediate capacity increase or traffic optimization required
- High utilization with performance complaints → Congestion is impacting users

How to measure bandwidth, identify issues & optimize network performance. Use Obkio's Network Performance Monitoring tool for easy bandwidth monitoring.
Learn moreThroughput: Measuring Actual Data Delivery
Network Throughput is the actual amount of data successfully transferred over the network in a given time period, typically measured in Mbps or Gbps.
Why it matters: Throughput represents real-world performance versus theoretical bandwidth capacity. The difference between available bandwidth and achieved throughput reveals network inefficiencies, protocol overhead, and congestion impacts.
How to interpret the numbers:
Throughput Efficiency Ratio = (Actual Throughput / Available Bandwidth) × 100
| Efficiency Ratio | Assessment | Likely Causes |
|---|---|---|
| 85-100% | Excellent | Optimal network performance |
| 70-85% | Good | Normal protocol overhead |
| 50-70% | Poor | Congestion or inefficiencies |
| Below 50% | Critical | Significant performance issues |
What different patterns mean:
- Throughput matches bandwidth: Efficient network operation with minimal overhead
- Throughput significantly below bandwidth: Congestion, errors requiring retransmission, or protocol inefficiencies
- Throughput drops during high utilization: Network congestion reducing effective capacity
- Inconsistent throughput: Variable network conditions affecting data transfer efficiency
Action triggers:
- Throughput below 70% of bandwidth → Investigate congestion, errors, or misconfigurations
- Throughput varies significantly → Check for intermittent issues or traffic prioritization problems

Unravel the secrets of network throughput: from bytes to blazing speed. Learn, measure, and optimize with Obkio's Network Performance Monitoring.
Learn moreResponse Time: Measuring Application Performance
Response Time is the time between sending a request to an application or service and receiving a response, measured in seconds or milliseconds.
Why it matters: Response time directly correlates with user satisfaction. Slow response times frustrate users, reduce productivity, and can indicate network or application performance issues.
How to interpret the numbers:
| Response Time | User Perception | Impact |
|---|---|---|
| 0-1 second | Immediate | Seamless experience |
| 1-3 seconds | Acceptable | Noticeable but tolerable |
| 3-5 seconds | Slow | User frustration begins |
| 5-10 seconds | Very slow | Significant productivity impact |
| 10+ seconds | Unacceptable | Users abandon tasks |
What different patterns mean:
- Consistent fast response: Application and network performing optimally
- Gradual response time increase: Growing load on application or network
- Response time spikes: Network congestion or application resource constraints
- Time-of-day patterns: Peak usage affecting performance
Action triggers:
- Response time above 3 seconds → Investigate network latency and application performance
- Response time increasing over time → Plan capacity or optimization upgrades
VoIP Quality (MOS Score): Quantifying Call Quality
Mean Opinion Score (MOS) rates voice call quality on a scale of 1-5, calculated based on latency, jitter, and packet loss measurements.
Why it matters: MOS scores provide objective measurements of subjective call quality, helping you validate whether your network supports acceptable voice communications.
How to interpret the numbers:
| MOS Score | Quality Rating | User Experience |
|---|---|---|
| 4.3-5.0 | Excellent | Landline-quality calls |
| 4.0-4.3 | Good | Minor imperfections, acceptable |
| 3.6-4.0 | Fair | Noticeable issues, usable |
| 3.0-3.6 | Poor | Significant quality problems |
| 1.0-3.0 | Bad | Unusable for communications |
What different patterns mean:
- MOS consistently above 4.0: Network supports high-quality VoIP
- MOS drops during peak hours: Insufficient bandwidth or QoS prioritization
- MOS below 3.6: Network unsuitable for VoIP without improvements
Action triggers:
- MOS below 4.0 → Implement QoS policies and verify adequate bandwidth
- Declining MOS scores → Investigate increasing network congestion

Conclusion: Maintaining Network Stability Through Continuous Testing
Network stability doesn't happen by accident—it requires systematic testing, comprehensive monitoring, and proactive management. By understanding key metrics, establishing baselines, and regularly assessing performance against industry benchmarks, you ensure your network consistently supports business operations and user productivity.
The difference between stable and unstable networks often comes down to visibility. You can't fix what you don't measure. Deploy continuous network monitoring tools like Obkio to track stability metrics 24/7, identify issues before they impact users, and maintain the reliable infrastructure your business depends on.
