Table of Contents
Table of Contents
Your users are complaining about slow application performance. Your monitoring dashboard shows all devices are green, routers operational, switches functioning, and bandwidth utilization is normal. Yet something is clearly wrong. The problem isn't your equipment; it's the path between your users and their destinations.
This is where network path monitoring comes in.
While traditional network monitoring tells you if your devices are working, network path monitoring reveals what's happening to your data as it travels through the network, hop by hop, router by router, from source to destination.
Network administrators and IT professionals face an increasingly complex challenge: ensuring reliable connectivity across distributed networks, cloud services, remote workforces, and third-party infrastructure you don't control. When performance issues arise, you need visibility into the entire network path, not just the endpoints.
In this article, we'll explore everything you need to know about network path monitoring: what it is, why it matters, how it differs from traditional monitoring approaches, and most importantly, how to implement it effectively in your environment. Whether you're troubleshooting intermittent WAN issues, managing multi-site connectivity, or ensuring optimal performance for critical applications, understanding network path monitoring is essential.
A network path is the complete route that data packets take as they travel from a source to a destination across a network. Think of it like a highway system: just as your GPS maps out a route from your home to your destination through various roads and intersections, a network path defines the series of network devices and connections that data must traverse to reach its endpoint.
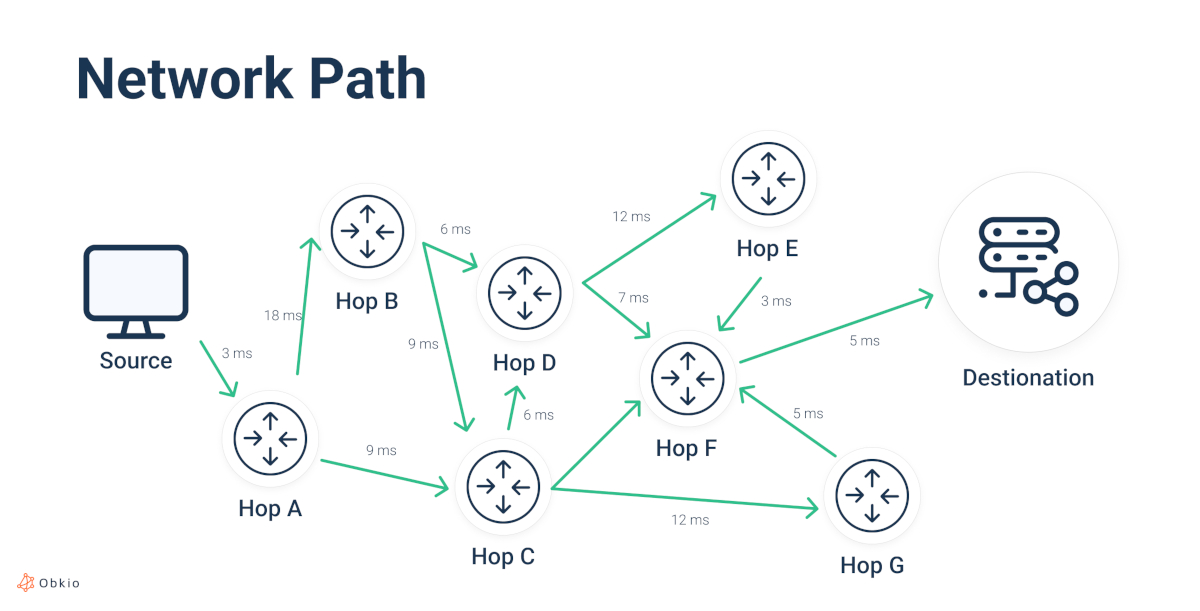
When you send an email, load a website, or access a cloud application, your data doesn't travel directly to its destination. Instead, it makes multiple "hops" through various network devices (routers, switches, and other networking equipment), each one forwarding the data closer to its final destination. This journey, from the first hop to the last, constitutes the network path.
Data doesn't move through networks as a single, continuous stream. Instead, it's broken down into smaller units called packets. Each packet contains a portion of your data along with addressing information that tells network devices where it needs to go.
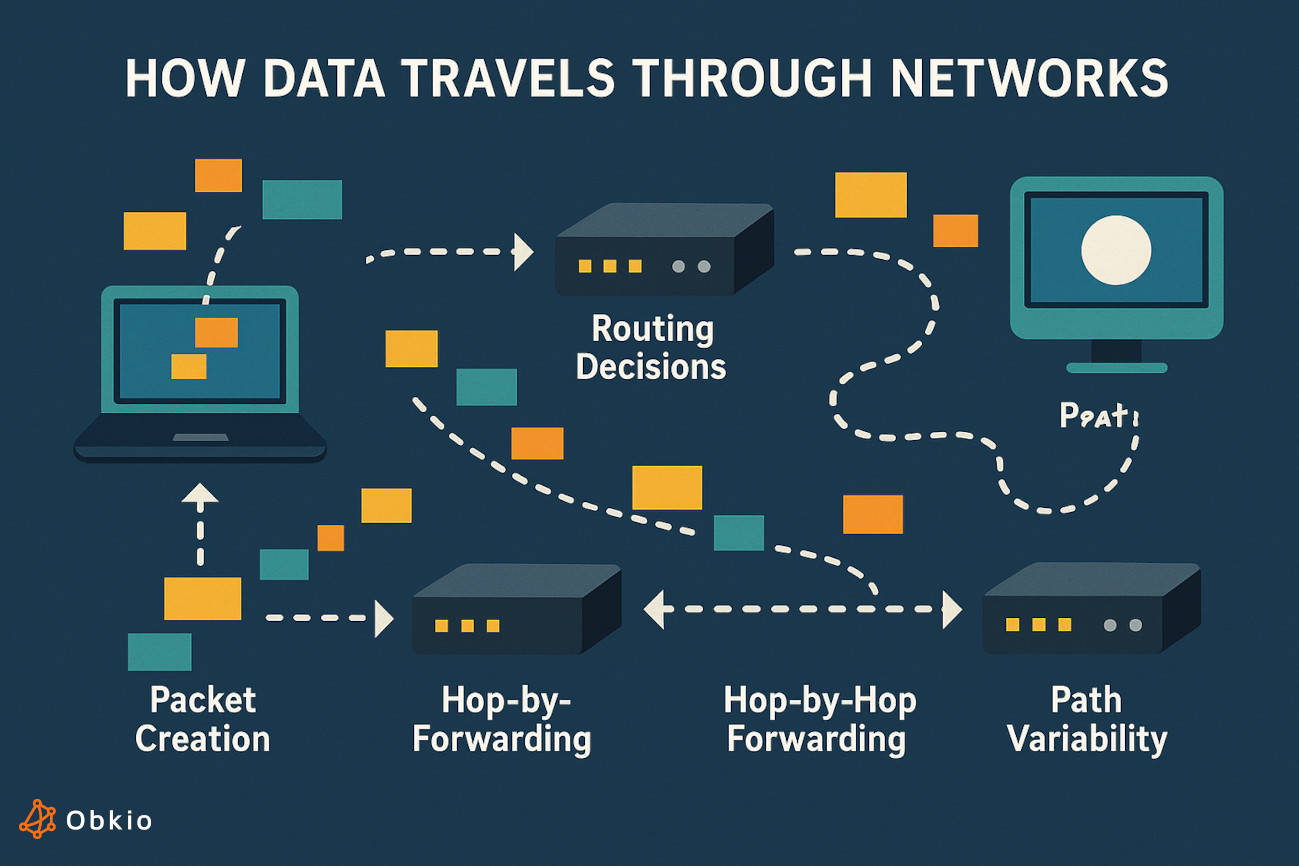
Here's what happens when data travels through a network:
1. Packet Creation: Your device (the source) breaks data into packets and adds destination information, including the IP address of where the data needs to go.
2. Routing Decisions: Each router or switch along the path examines the packet's destination address and decides which direction to send it next. These decisions are based on routing tables, essentially maps that network devices maintain to determine the best path forward.
3. Hop-by-Hop Forwarding: The packet moves from one network device to another, with each device making its own forwarding decision. This continues until the packet reaches its destination.
4. Path Variability: Not all packets necessarily take the same route. Network devices constantly adjust routing based on factors like network congestion, link failures, or routing protocol updates. This means packets sent moments apart might follow different paths.
Understanding the components that make up a network path helps you identify where problems can happen. Here are the key elements you need to look out for
1. Routers: These are the primary decision-makers in network paths. Routers connect different networks and determine the best path for data to reach its destination. When you monitor a network path, you're often tracking the routers your data passes through.
2. Switches: Operating primarily within local networks, switches forward data between devices on the same network segment. While they're less visible in internet-bound traffic paths, they're critical components in LAN environments.
3. Network Nodes: This broader term encompasses any device that can receive, create, or forward data along a path, including routers, switches, firewalls, load balancers, and even servers that route traffic
4. Hops: A "hop" refers to each stage in the journey where data passes from one network device to another. The number of hops in a path affects latency and provides troubleshooting clues about where your data is travelling.
5. Links: The physical or logical connections between network devices. These can be fibre optic cables, copper wires, wireless connections, or virtual links in software-defined networks.
Network paths aren't predetermined or static; they're dynamically calculated based on routing protocols and current network conditions. Several factors influence how paths are determined:
- Routing Protocols: Protocols like BGP (Border Gateway Protocol), OSPF (Open Shortest Path First), and EIGRP (Enhanced Interior Gateway Routing Protocol) enable routers to share information and calculate optimal paths. These protocols consider factors like hop count, bandwidth, and link cost.
- Routing Tables: Every router maintains a routing table that lists known networks and the best next hop to reach them. These tables are constantly updated as network conditions change.
- Metrics and Costs: Routers use various metrics to evaluate path quality, including distance (hop count), bandwidth, delay, reliability, and administrative preferences. The "best" path is the one with the lowest total cost according to these metrics.
- Load Balancing: When multiple equal-cost paths exist, routers may distribute traffic across them to optimize network utilization.
- Policy-Based Routing: Network administrators can configure policies that override default routing decisions for specific traffic types, sources, or destinations.
Discover how to monitor network performance effectively with key steps & best practices. Optimize your network with Obkio's NPM tool for seamless operations.
Learn more

Different network scenarios create different types of paths, each with unique characteristics and monitoring requirements:
1. Local Area Network (LAN) Paths:
Within your office network, a path from your workstation to a local file server might traverse just one or two hops, through a switch and perhaps a router. LAN paths are typically fast and predictable, but can still experience issues from switch port problems or local congestion.
2. Wide Area Network (WAN) Paths:
Connecting branch offices to headquarters often involves multiple hops through your organization's private WAN infrastructure. WAN paths cross longer distances and may traverse carrier networks, making them more complex to monitor and troubleshoot.
3. Internet Paths:
When accessing websites or cloud services, your data travels through your ISP's network, across internet backbone providers, and through the destination's ISP. A typical Internet path might include 10-20 hops, crossing multiple autonomous systems (independently operated networks). Each hop represents a potential point of degradation.
4. Cloud Application Paths:
Accessing applications like Microsoft 365, Salesforce, or AWS services creates paths that combine your local network, ISP connections, and the cloud provider's infrastructure. These hybrid paths are increasingly critical to monitor as organizations depend more heavily on cloud services.
5. VPN Paths:
Virtual Private Networks create encrypted tunnels through existing network paths. While the underlying path may traverse the public internet, the VPN creates a logical path that appears as a direct connection between endpoints.

Network path monitoring is the continuous observation and analysis of the routes data takes through a network, measuring performance metrics at each hop to identify issues, optimize routing, and ensure reliable end-to-end connectivity.
Unlike traditional monitoring that focuses on individual device health, network path monitoring provides visibility into the journey itself. It answers critical questions like:
- Which route is my data taking?
- How is performance at each hop along the way?
- Where exactly is the bottleneck occurring?
- Is my ISP delivering the performance they promised?
Think of it as the difference between checking if your car's engine is running versus tracking your actual progress on a road trip. Your engine might be fine, but if you're stuck in traffic or taking a detour through back roads, you're not reaching your destination efficiently. Network path monitoring gives you that real-time visibility into your data's journey.
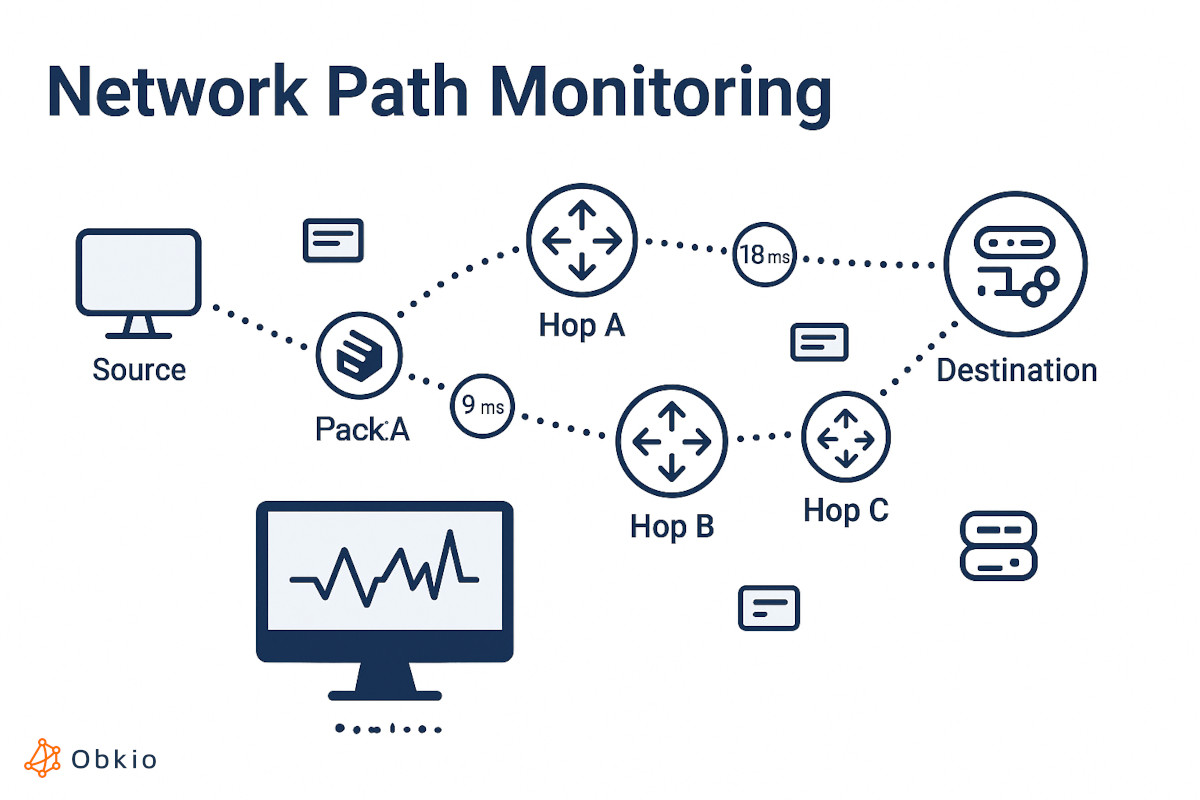
Effective network path monitoring measures several critical elements that together paint a complete picture of path health and performance:
Every network path consists of a series of hops, the individual network devices that forward your data toward its destination. Network path monitoring identifies each hop along the route, revealing:
- Hop count: The total number of devices your data traverses
- Device identification: IP addresses and sometimes hostnames of intermediate devices
- Ownership: Whether hops belong to your network, your ISP, or third-party networks
- Path changes: When routing shifts and traffic takes a different route
Understanding your network's hop topology helps you identify where problems originate. Is the issue in your local network, your ISP's infrastructure, or somewhere on the internet backbone? Hop-by-hop visibility provides the answer.
Performance metrics at each hop reveal how the path is affecting your data:
Latency (Delay): The time it takes for data to travel from one hop to the next. Network path monitoring measures round-trip time (RTT) to each hop, helping you identify where delays are accumulating. A sudden latency spike at a specific hop point directly to where congestion or performance issues exist.
Packet Loss: When data packets fail to reach their destination or are dropped along the way. Path monitoring reveals not just that packet loss is occurring, but precisely where packets are being dropped. This is crucial because packet loss at different locations has different causes and different solutions.
Jitter: Variation in latency over time. Consistent latency is preferable to erratic performance. High jitter causes problems for real-time applications like VoIP and video conferencing. Monitoring jitter along the path helps you identify unstable network segments.
By measuring these metrics at every hop, you can distinguish between problems in your control (your local network), your service provider's infrastructure, and issues with destination networks or internet routing.
Modern networks often implement redundant paths for resilience. If the primary path fails or degrades, traffic should automatically switch to backup routes. Network path monitoring helps you:
- Verify redundancy: Confirm that alternative paths actually exist and function correctly
- Monitor failover behaviour: Detect when traffic shifts to backup routes and whether the transition is seamless
- Compare path performance: Evaluate whether your primary path is truly optimal or if alternative routes offer better performance
- Identify single points of failure: Discover network segments where no redundancy exists, creating risk
Without path monitoring, you might not realize your redundancy isn't working until a critical failure occurs.
An important distinction in network path monitoring is the difference between continuous monitoring and point-in-time analysis:
Point-in-Time Tools (like running a traceroute command) provide a snapshot of the current path and performance. This is useful for immediate troubleshooting but misses intermittent issues that occur at different times of day or under varying load conditions.
Continuous Path Monitoring observes network paths over time, collecting historical data that reveals patterns and trends. This approach detects:
- Intermittent problems: Issues that come and go, which point-in-time checks might miss
- Performance degradation trends: Gradual deterioration that predicts future failures
- Time-based patterns: Congestion during business hours, routing changes at night, weekend performance differences
- Before-and-after comparisons: The impact of network changes, upgrades, or configuration modifications
Continuous monitoring transforms path analysis from reactive troubleshooting into proactive network management. You can identify and address issues before they impact users, establish performance baselines, and track the effectiveness of optimizations.
This is where solutions like Obkio become essential. Obkio is a Network monitoring, Troubleshooting and Observability platform specifically designed for distributed networks and environments where infrastructure extends beyond your direct control.
By deploying lightweight monitoring agents at strategic locations throughout your network, Obkio continuously monitors network paths 24/7, capturing the complete picture of performance, not just snapshots.

For organizations struggling with intermittent issues, multi-site connectivity, or cloud application performance, this continuous visibility is the difference between guessing and knowing. Rather than requiring network administrators to manually run traceroutes when problems occur, Obkio's monitoring agents continuously test network paths, every few minutes, around the clock. This persistent monitoring captures those frustrating intermittent issues that disappear by the time you investigate.
- 14-day free trial of all premium features
- Deploy in just 10 minutes
- Monitor performance in all key network locations
- Measure real-time network metrics
- Identify and troubleshoot live network problems

Traditional network monitoring was designed for simpler times when most of your infrastructure resided in data centers you controlled. Monitoring your routers, switches, and servers gave you nearly complete visibility because you owned the entire path.
Today's reality is dramatically different. Your users access applications hosted in AWS, Azure, or Google Cloud. They work from home offices, coffee shops, and hotel rooms. They rely on SaaS applications whose infrastructure you'll never see. Critical business applications traverse networks operated by ISPs, cloud providers, and MSPs.
This creates a fundamental visibility gap: traditional device monitoring shows you that your equipment is healthy, but tells you nothing about what's happening to your data once it leaves your network. Network path monitoring fills this gap by extending your visibility across the entire journey, regardless of who owns the infrastructure.
Network path issues have direct, measurable business consequences:
Lost Productivity: When applications slow down or become unreachable, employees can't work effectively. A VoIP call that drops repeatedly wastes time and damages professional relationships. A sluggish CRM system reduces sales productivity.
Poor User Experience: Whether your users are employees, customers, or partners, network performance directly affects their experience. Slow website loading times increase bounce rates and reduce conversions. Laggy video conferences frustrate participants and reduce collaboration effectiveness. In the age of digital-first business, network performance is business performance.
Finger-Pointing and Delayed Resolution: Without path visibility, troubleshooting becomes an exercise in educated guessing. Your team blames the ISP. The ISP blames the cloud provider. The cloud provider points back to your network. Meanwhile, the issue persists, users suffer, and resolution time extends from hours to days. Network path monitoring provides objective data that eliminates speculation and accelerates problem resolution.
SLA Violations and Service Credits: If you're paying for premium network services with performance guarantees, you need path monitoring to verify you're receiving what you purchased. Without proof of where performance degradation occurs, you can't hold service providers accountable or claim service credits for SLA violations.
Hidden Capacity Issues: Sometimes performance problems aren't failures, they're growth pains. Network path monitoring reveals when specific path segments are approaching network capacity, enabling proactive upgrades before problems become critical.
Network issues rarely announce themselves clearly. A user complains about slow application performance, but is it the local network, the ISP, a congested peering point, or the cloud provider? Without visibility into the complete path, IT teams waste hours troubleshooting in the dark, testing each potential point of failure one by one.
Network path monitoring cuts through this uncertainty by revealing exactly where problems occur along the data's journey. Here are the specific, recurring challenges that network teams can solve with path monitoring:
Your ISP's network is a black box, unless you monitor the path. Path monitoring reveals when latency spikes or packet loss occurs within your provider's infrastructure, giving you the evidence needed to open effective support tickets and demand resolution. It also helps you evaluate whether your ISP is delivering the performance level you're paying for.
Learn how to use network monitoring tools to identify ISP issues and work with your ISP to troubleshoot. Don't let ISP problems slow you down!
Learn more

Internet routing doesn't always take the most direct path. Sometimes, your traffic from New York to Washington DC routes through Chicago due to peering arrangements or routing policies. Network path monitoring identifies these inefficiencies, enabling you to work with providers to optimize routing or implement policy-based routing to prefer better paths.
The most frustrating network issues are those that come and go. Users report problems, but by the time you investigate, everything appears normal. Continuous network path monitoring captures these intermittent network issues, revealing patterns like peak-hour congestion, routing flaps, or time-based performance variations that point-in-time tools miss.
When Microsoft 365 is slow, is it Microsoft's fault, your ISP's fault, or a problem in your network? Path monitoring shows you exactly where performance degrades along the path to Microsoft's infrastructure, enabling targeted troubleshooting and informed conversations with the responsible party.
Organizations with multiple offices rely on reliable site-to-site connectivity. When branch offices report slow access to headquarters resources, network path monitoring reveals whether the issue is in the branch network, the WAN connection, your carrier's MPLS network, or the headquarters network.
With distributed teams working from home, corporate VPNs and cloud services have become critical infrastructure. Path monitoring helps you distinguish between problems in the remote worker's home network, their ISP, your VPN infrastructure, or the applications they're accessing.
Network administrators often ask: "Isn't this just network monitoring?" The short answer is no. Network path monitoring and traditional network monitoring serve different but complementary purposes. Understanding this distinction is crucial for building comprehensive network visibility.
Traditional network monitoring is often SNMP-based and focuses on the health and performance of individual network devices and resources within your infrastructure. It answers questions like:
- Is this router operational?
- What's the CPU utilization on this switch?
- How much bandwidth is this interface consuming?
- Is this server responding to requests?
- Are there errors on this network port?
These tools monitor what you own: your routers, switches, firewalls, servers, and applications. They collect metrics like device availability, CPU and memory usage, interface statistics, bandwidth utilization, and error rates. When a device fails or approaches capacity, you receive alerts.
Traditional monitoring excels at infrastructure management. It helps you understand device health, capacity planning, configuration compliance, and hardware lifecycle management. Tools like SNMP-based monitoring systems, NetFlow analyzers, and infrastructure monitoring platforms fall into this category.
Network path monitoring shifts focus from devices to the data journey itself. It answers fundamentally different questions:
- What route is traffic taking to reach this destination?
- Where along this path is latency occurring?
- Which hop is dropping packets?
- Has the routing path changed?
- Is performance degrading in my network, my ISP's network, or somewhere else?
Path monitoring tracks the experience of your data as it traverses multiple networks, including infrastructure you don't own or control. It measures hop-by-hop performance, reveals routing behaviour, and identifies where in the end-to-end path problems are occurring.
The good news is that you don't have to choose between traditional device monitoring and network path monitoring. Modern network monitoring solutions, like Obkio, merge both approaches into unified platforms that focus on network performance just as much as device performance.

Because comprehensive network performance monitoring requires understanding the complete picture, Obkio takes into account the entire network path, not just the devices at the endpoints. It uses techniques like synthetic monitoring to simulate traffic throughout the whole network path, continuously testing how data actually flows between locations. Combined with integrated tools like traceroutes to map and monitor the network path hop-by-hop, Obkio provides visibility that spans from device health to end-to-end path performance.
This distinction becomes critical when troubleshooting. Your traditional monitoring might show all green, every device healthy, no alerts, and utilization normal. Yet users report application slowness. Network path monitoring reveals the issue: traffic is experiencing significant latency at a specific hop within your ISP's network, well beyond your infrastructure boundaries.
Network path monitoring spans a wide spectrum of tools, from simple command-line utilities that have existed for decades to sophisticated platforms that provide continuous, automated path analysis. Understanding this landscape helps you choose the right tools for your needs and recognize when to graduate from basic utilities to comprehensive solutions.
Every network administrator's toolkit includes fundamental command-line utilities for path analysis. These tools provide the foundation for understanding network paths and remain valuable for quick troubleshooting.
Traceroute is the original network path analysis tool, and its core concept underpins virtually all path monitoring solutions. It works by sending packets with incrementally increasing Time-To-Live (TTL) values, causing each hop along the path to respond and reveal its presence.
How it works: Traceroute sends packets with TTL=1, which expires at the first hop, causing that router to send back an ICMP "Time Exceeded" message. Then it sends packets with TTL=2, which reach the second hop before expiring, and so on. This continues until packets reach the destination, mapping out the entire path.
What traceroute reveals:
- The sequence of hops between the source and the destination
- IP addresses (and sometimes hostnames) of intermediate routers
- Round-trip time to each hop
- Where packets are being dropped or delayed
Limitations: Traceroute provides a snapshot at a single moment in time. Network paths can change between runs, and routing may behave differently for your test packets than for actual application traffic. It also doesn't detect intermittent issues or reveal performance trends over time. Many networks deprioritize or block ICMP, leading to incomplete or misleading results.
Ping is the simplest network diagnostic tool, testing basic reachability and measuring round-trip latency to a destination.
How it works: Ping sends ICMP Echo Request packets to a destination and waits for Echo Reply packets. It measures how long this round trip takes and whether packets are successfully returned.

What ping reveals:
Whether a destination is reachable
Round-trip latency (RTT)
Packet loss percentage
Basic jitter (latency variation)
Limitations: Ping only tests end-to-end connectivity, it doesn't reveal what happens along the path. It tells you there's a problem, but not where the problem is. Additionally, ping uses ICMP, which some networks deprioritize or block, potentially giving misleading results about actual application performance.
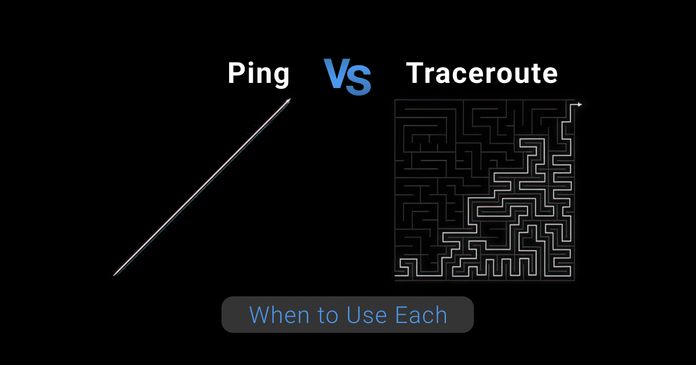
Learn when to use traceroute vs ping for network troubleshooting. Compare how each works, key differences, and best practices diagnosing network issues.
Learn more

MTR (originally "Matt's Traceroute," now "My Traceroute") combines the path discovery of traceroute with the continuous testing of ping, providing more comprehensive analysis than either tool alone.
How it works: MTR continuously sends packets to each hop along the path, collecting statistics over time. Unlike a single traceroute that shows one snapshot, MTR reveals performance patterns and variations.
What MTR reveals:
The complete network path
Packet loss at each hop
Latency statistics (minimum, average, maximum) per hop
Performance trends over the duration of the test
Which hops exhibit variability or instability
Why MTR is better than basic traceroute: By continuously testing each hop, MTR distinguishes between consistent problems and transient blips. It reveals patterns like "hop 7 consistently shows 2% packet loss" or "hop 4 has high latency variance."
Limitations: While more informative than single-run traceroute, MTR still provides only a finite testing window. It doesn't offer historical data, alerting, or automated analysis. Like other ICMP-based tools, some networks may deprioritize or filter MTR traffic, affecting accuracy.
While invaluable for quick checks and troubleshooting, command-line tools share fundamental limitations that reduce their effectiveness for comprehensive network path monitoring:
Point-in-Time Analysis: These tools show you what's happening right now, but network problems are often intermittent. The issue affecting users at 2 PM might not be visible when you run traceroute at 2:15 PM.
Manual Operation: Someone must remember to run these tools, interpret the results, and document findings. This reactive approach means you discover problems after users are already affected.
No Historical Data: Command-line tools don't retain data for trend analysis. You can't compare today's path performance to last week's baseline or identify gradual degradation over time.
Limited Protocol Coverage: Most command-line tools use ICMP, which doesn't represent actual application traffic. Some networks treat ICMP differently than TCP or UDP, meaning your diagnostic traffic experiences different conditions than real user traffic.
No Alerting: These tools don't notify you when problems occur. You must actively check them, making proactive monitoring impossible.
Difficult to Scale: Running manual traceroutes from multiple locations to multiple destinations becomes impractical as your network grows. You need dozens or hundreds of path checks, not just a few ad-hoc tests.
No Visualization: Text-based output requires interpretation. Spotting patterns across multiple paths or identifying relationships between different network segments is difficult without a visual representation.
Incomplete Context: Command-line tools show raw metrics but don't correlate path data with other network information, application performance, or business impact.
These limitations don't diminish the value of command-line tools for immediate troubleshooting, they remain essential skills. However, they highlight why organizations need more sophisticated solutions for ongoing network path monitoring.
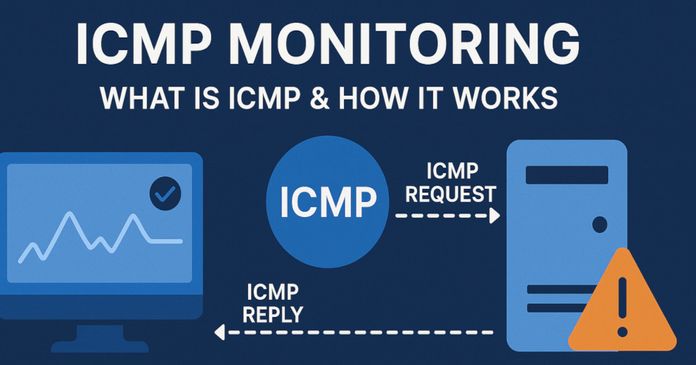
Learn what ICMP is, how ping works, and how to use ICMP to monitor latency, jitter, and packet loss. Plus best practices and troubleshooting tips.
Learn more

The evolution of network path monitoring has produced tools like Obkio that address the limitations of command-line utilities while building on their foundational concepts.
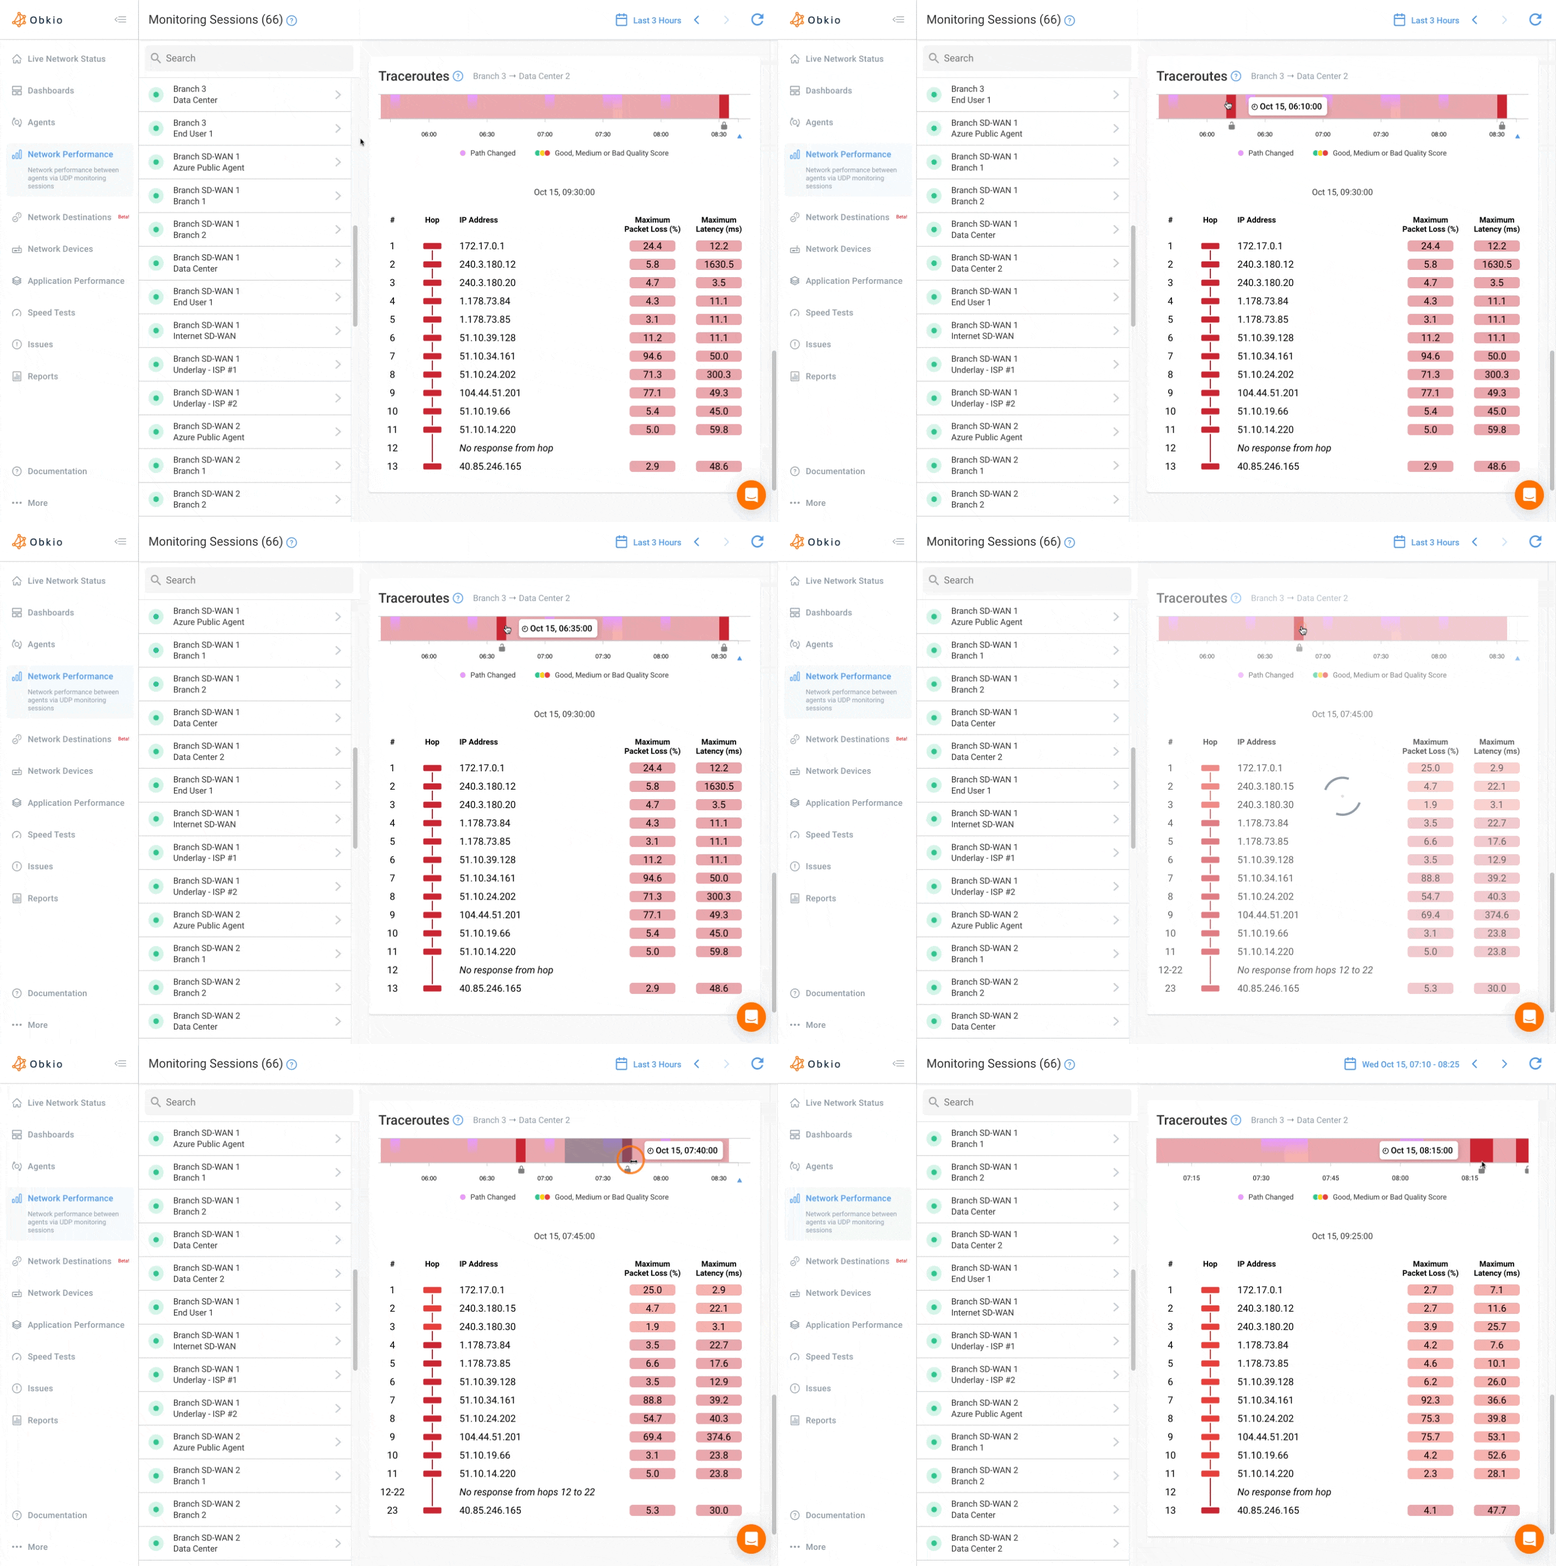
Visual Traceroute Tools add a graphical representation to traditional path analysis, making complex routing easier to understand at a glance.
Key features:
- Geographic mapping showing the physical locations of hops
- Graphical path representation with performance colour-coding
- Historical comparison showing how paths change over time
- Export capabilities for documentation and reporting
Value: Visual representation accelerates pattern recognition. Seeing that your traffic to Europe suddenly routes through Asia is immediately obvious on a map, while it might be easy to miss in text-based traceroute output.
Advanced network path monitoring solutions shift from periodic manual checks to continuous automated monitoring, fundamentally changing how you maintain visibility.
Continuous monitoring: Instead of running traceroute when problems occur, these platforms constantly test paths, collecting performance data 24/7. This captures intermittent issues and establishes performance baselines.
Synthetic monitoring: These systems actively send test traffic across your critical paths, simulating real user traffic patterns. This proactive approach detects problems before they broadly impact users.
Multi-protocol testing: Rather than relying solely on ICMP, advanced platforms test using TCP and UDP (the protocols your actual applications use), providing more accurate performance visibility.
Bidirectional testing: Traffic doesn't always take the same path in both directions. Sophisticated monitoring tests both inbound and outbound paths, revealing asymmetric routing issues that unidirectional tests miss.
Distributed monitoring points: Enterprise platforms deploy monitoring agents or use cloud-based testing nodes at multiple locations (headquarters, branch offices, cloud regions), providing visibility from every perspective that matters to your users.
Obkio is a comprehensive network monitoring and Observability solution built specifically for distributed networks, multi-site businesses, and environments where critical infrastructure extends beyond your direct control. Unlike traditional monitoring tools that focus solely on devices you own, Obkio provides end-to-end visibility across your entire network path, from users to applications, regardless of who operates the underlying infrastructure.

The platform deploys lightweight monitoring agents at strategic locations throughout your network, headquarters, branch offices, remote sites, cloud environments, and even remote worker locations. These agents continuously exchange synthetic traffic, measuring real-world network performance and path behaviour in real time.
This distributed architecture solves a fundamental challenge in modern networking: you need visibility from every perspective that matters. What users in your New York office experience when accessing AWS might differ dramatically from what your London branch experiences. Obkio's multi-point monitoring captures these location-specific perspectives.
At the core of Obkio's path monitoring capabilities are two interconnected features: Visual Traceroute and Network Map. Together, they provide both granular hop-by-hop analysis and comprehensive topology visualization, giving you the complete picture of how your network paths perform.

- 14-day free trial of all premium features
- Deploy in just 10 minutes
- Monitor performance in all key network locations
- Measure real-time network metrics
- Identify and troubleshoot live network problems

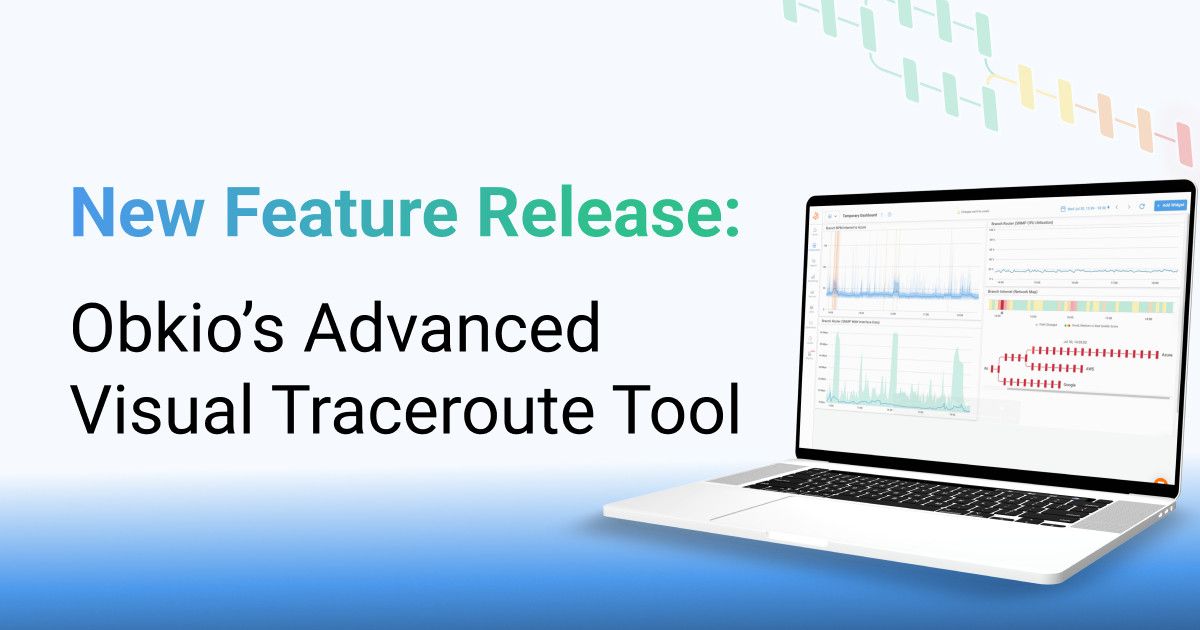
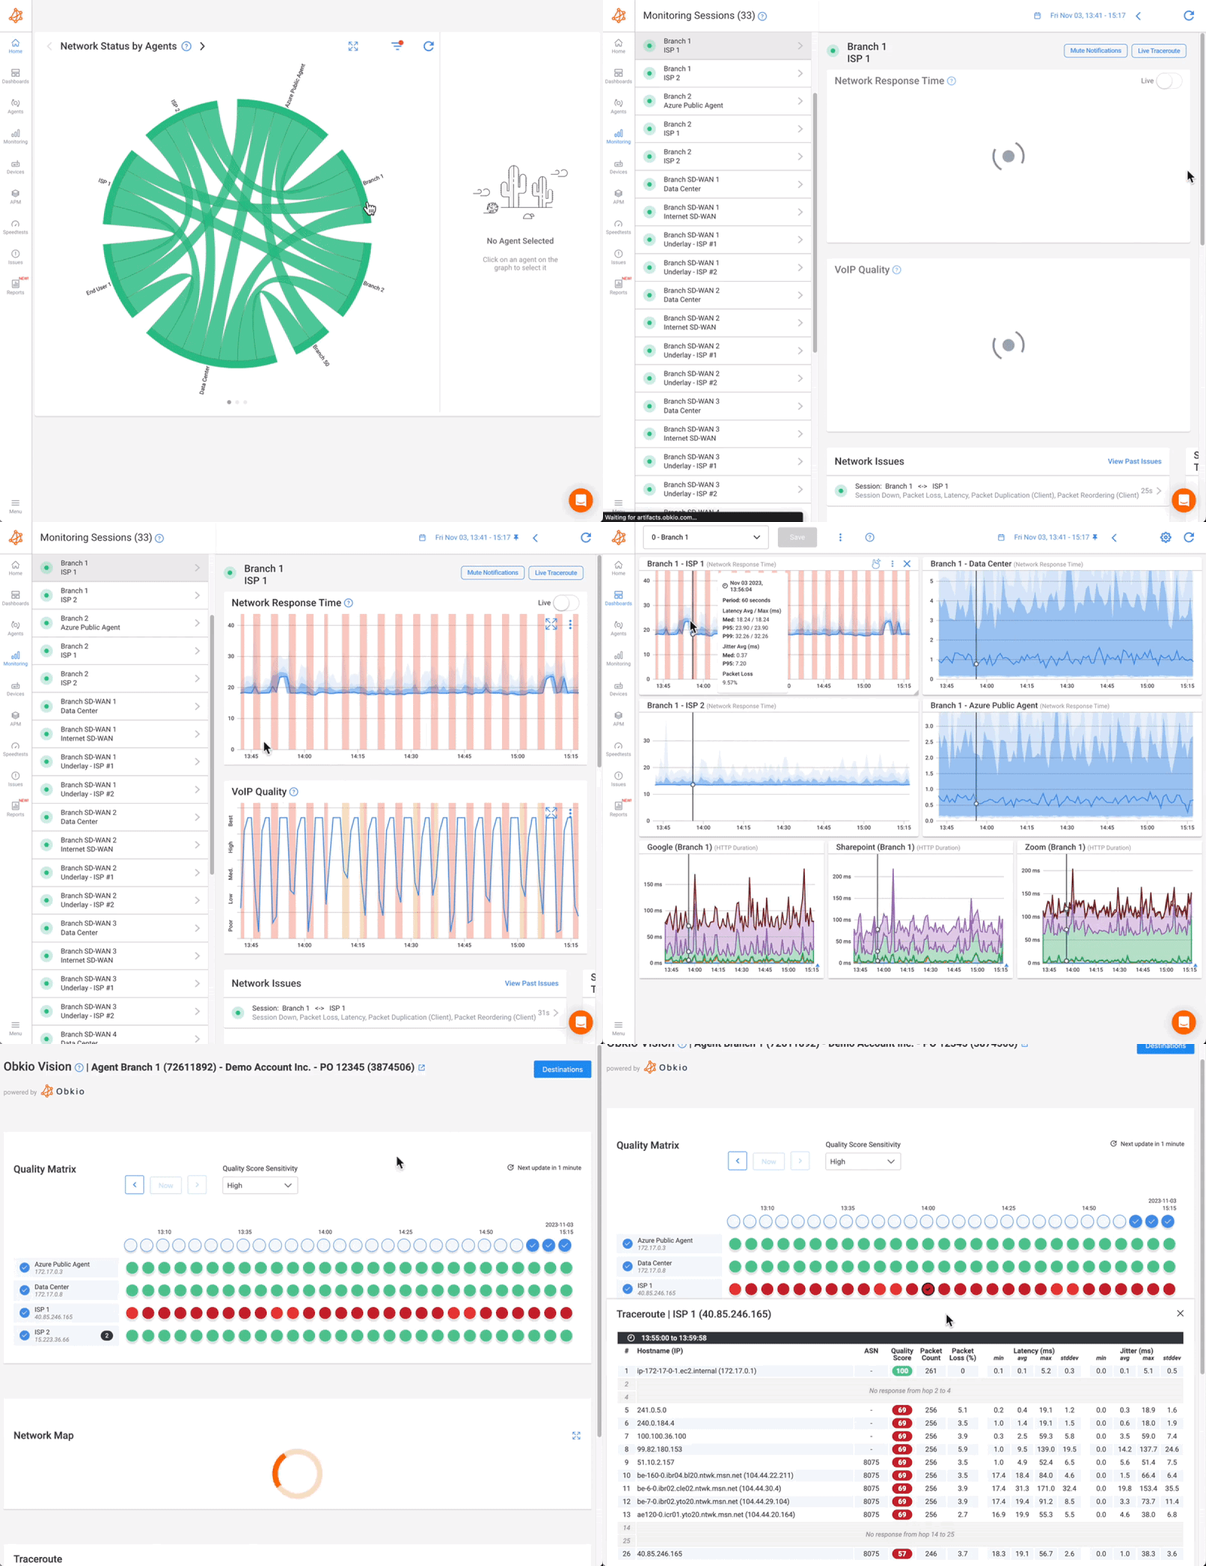
Obkio's Visual Traceroute elevates traditional traceroute from a command-line diagnostic into a powerful, continuous monitoring tool that provides actionable intelligence about network path performance.
Unlike running a manual traceroute that shows a single snapshot, Obkio performs continuous traceroute analysis throughout the day. This persistent monitoring captures the dynamic nature of network paths:
Intermittent issue detection: When latency spikes at hop 8 for 30 minutes each afternoon, Obkio captures it, even if the path looks perfect when you check manually.
Routing change tracking: Obkio detects when your traffic shifts from one path to another, documenting when changes occurred and how they affected performance.
Performance trending: Instead of seeing one set of latency measurements, you see how latency at each hop evolves over hours, days, or weeks, revealing patterns and degradation trends.
Historical comparison: Compare current path performance against baselines, helping you determine if today's 50ms latency at a specific hop is normal or indicates a new problem.
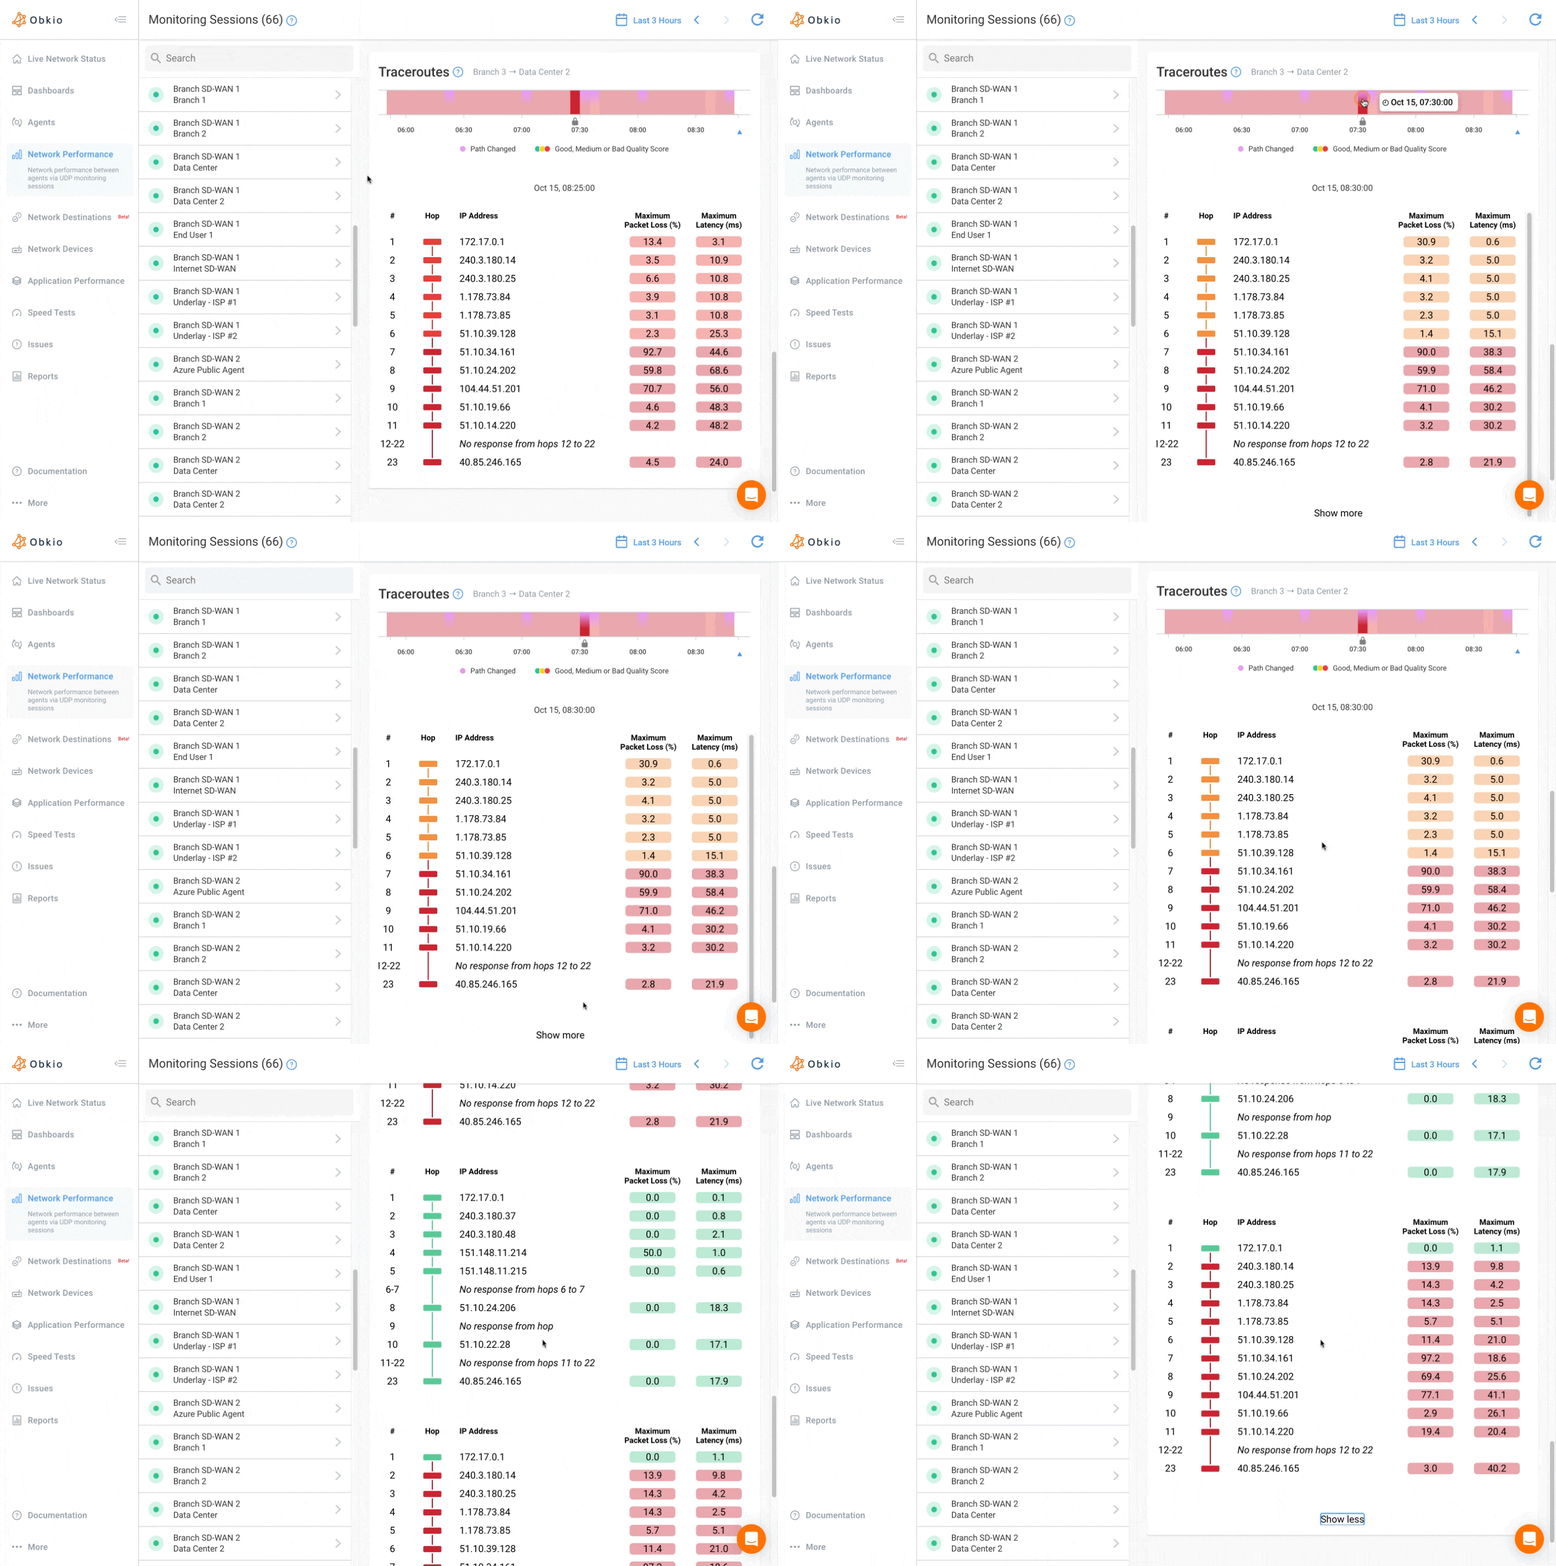
Obkio transforms complex path data into intuitive visual representations that accelerate problem identification:
Colour-coded performance indicators: Each hop displays colour coding based on its performance metrics: green for healthy, yellow for degraded, red for problematic. You can instantly spot where issues exist without parsing raw numbers.
Geographic visualization: See where your traffic physically travels. When your data from Chicago to New York routes through Los Angeles, the geographic display makes this routing inefficiency immediately obvious.
Hop-by-hop metrics: Click any hop to see detailed performance metrics like latency, packet loss, jitter, along with historical data (6+ months) showing whether current performance is typical or anomalous.
Path comparison view: When paths change or when multiple routes exist, Obkio visually compares them side-by-side, highlighting performance differences and helping you identify optimal routing.
One of Visual Traceroute's most significant advantages is its use of UDP packets, AKA synthetic testing, rather than relying solely on ICMP. This matters because:
Accurate representation: UDP traffic mirrors how many real applications (VoIP, video, gaming, streaming) actually behave. Testing with UDP provides more realistic performance visibility than ICMP-only testing.
Avoiding ICMP limitations: Many networks deprioritize or rate-limit ICMP traffic, causing traditional traceroute to show artificially poor results that don't reflect actual application performance. Obkio's UDP testing bypasses these limitations.
Firewall transparency: Some networks block ICMP entirely but allow UDP, giving Obkio visibility where traditional tools would fail.
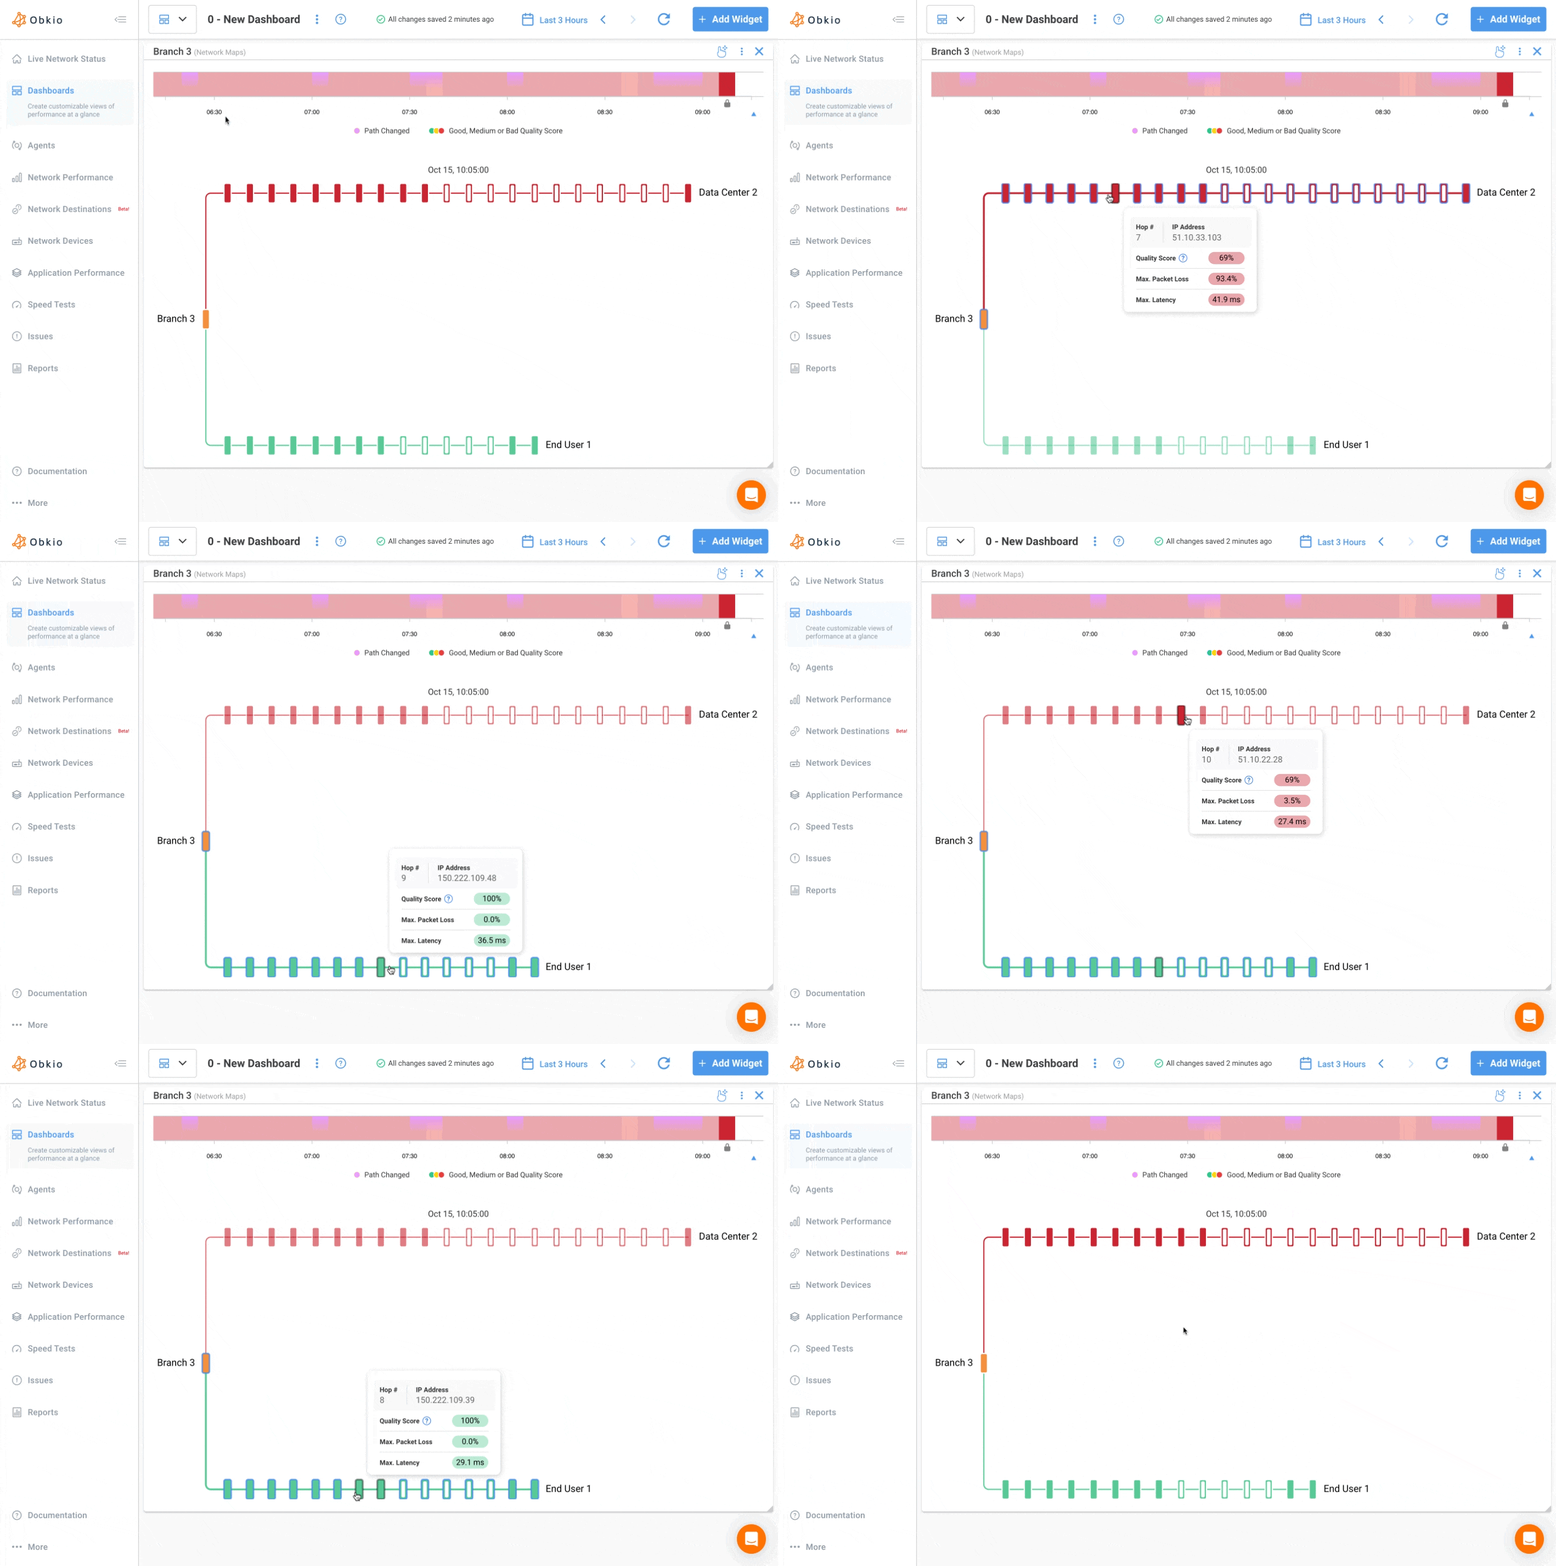
Obkio doesn't just collect path data, it analyzes it automatically and alerts you to problems:
Anomaly detection: The platform learns normal performance baselines for each hop and automatically identifies when performance deviates significantly.
Smart alerting: Rather than alert on every small fluctuation, Obkio uses intelligent thresholds that distinguish between normal variation and actionable problems, reducing alert fatigue.
Root cause identification: When multiple hops show degraded performance, Obkio identifies which hop is actually causing the problem versus which are simply showing the accumulated effect.
Problem localization: Alerts specify not just that a path has issues, but where in the path and critically, whether the problem is in your network, your ISP's infrastructure, or beyond.
The combination of continuous monitoring, visual representation, and automated analysis delivers concrete operational benefits:
Rather than learning about issues from user complaints, Obkio detects problems automatically, often before they broadly impact operations. You receive alerts when path performance degrades, enabling resolution before escalation.
When issues do occur, Obkio's path visibility dramatically accelerates troubleshooting. Instead of spending hours running manual traceroutes, checking devices, and calling your ISP, you immediately see where the problem exists. This can reduce mean time to resolution (MTTR) from hours or days to minutes.
When your ISP or network carrier is responsible for poor performance, Obkio provides the objective evidence you need. Rather than describing symptoms or guessing about causes, you can show your provider exactly which hop in their network is experiencing packet loss or elevated latency. This data-driven approach transforms unproductive support interactions into focused problem-solving sessions.
Obkio maintains historical records of path performance, providing documentation for:
- SLA validation: Verify whether service providers are meeting their performance commitments
- Change impact assessment: Understand how network modifications affect path performance
- Capacity planning: Identify trends that indicate growing traffic or deteriorating performance
- Executive reporting: Demonstrate network reliability and improvement initiatives with concrete data
For distributed organizations, Obkio enables centralized visibility with location-specific detail. Network teams at headquarters can monitor branch office connectivity without requiring local expertise at each site. When a branch reports issues, you can immediately assess whether the problem is local to that site or part of a broader pattern.
Network problems are inevitable, but extended troubleshooting, finger-pointing with providers, and user frustration are not. Network path monitoring provides the visibility needed to transform troubleshooting from reactive firefighting into proactive stewardship.
Whether you're struggling with remote workforce connectivity, troubleshooting multi-site WAN performance, validating ISP commitments, or simply seeking better visibility into your network's actual performance, network path monitoring delivers the answers you need.
Start by evaluating where path visibility would most benefit your organization. Identify the paths that matter most to your operations. Explore tools like Obkio that provide comprehensive, continuous monitoring with visual representation and intelligent analysis. And take the first step toward transforming your network visibility from incomplete snapshots into comprehensive, actionable intelligence.
Your network paths carry the data that powers your business. Isn't it time you could see where that data actually goes and how it performs along the way?

- 14-day free trial of all premium features
- Deploy in just 10 minutes
- Monitor performance in all key network locations
- Measure real-time network metrics
- Identify and troubleshoot live network problems


 Obkio Blog


