Table of Contents
Table of Contents
Application performance directly impacts user experience, revenue, and operational efficiency—but identifying the root cause of slow applications requires visibility beyond basic uptime monitoring. Application Performance Monitoring (APM) tools track application behavior, response times, error rates, and resource consumption in real-time, enabling development and operations teams to detect performance bottlenecks, optimize code efficiency, and resolve issues before they affect users.
When applications slow down, the cause could be inefficient database queries, memory leaks, external API latency, network congestion, insufficient server resources, or poorly optimized code. APM tools instrument applications to trace individual transactions from user request through all backend services, revealing exactly which component—application code, database, third-party service, or infrastructure—causes delays.
Modern APM extends beyond server-side monitoring to provide end-to-end visibility. These tools combine multiple monitoring capabilities: real user monitoring (RUM) tracks actual user experience in browsers and mobile apps, distributed tracing follows requests across microservices architectures, code-level diagnostics identify inefficient functions, infrastructure monitoring correlates application performance with server resources, and dependency mapping reveals how external services impact application behavior.
In this comprehensive guide, we compare the best application performance monitoring tools across different categories—from enterprise APM platforms with AI-powered analytics to open-source solutions for custom monitoring needs. You'll learn how these tools differ in instrumentation methods (agent-based vs. agentless), monitoring scope (full-stack vs. specialized), deployment models (SaaS vs. self-hosted), and pricing structures—helping you select the right APM solution for your application architecture, team size, and performance requirements.
When it comes to application performance monitoring (APM), there is no one-size-fits-all approach. The tools and techniques you use to monitor your applications will vary depending on a variety of factors, including whether you are monitoring your own application or an application that you use, whether it is a SaaS application or an on-premise one, and whether there are frequent issues with the application.
Here's a list of considerations and recommendations for tailoring your APM strategy to your specific needs:
- Identify the type of application you are monitoring: Are you monitoring your own application or an application that you use? Depending on the answer, you may need to use different tools and techniques. For example, if you are monitoring your own application, you may need to use more comprehensive monitoring tools that cover all aspects of the application's performance. If you are monitoring an application that you use, you may be able to rely on the vendor's monitoring tools.
- Determine whether the application is Cloud or on-premise: If the application is Cloud, you may have limited control over the monitoring tools you can use. In this case, it is important to ensure that the vendor's monitoring tools are sufficient for your needs. If the application is on-premise, you may have more control over the monitoring tools you use.
- Consider the frequency of issues with the application: If the application is frequently experiencing performance issues such as slowness, you may need to use more advanced monitoring tools that provide real-time performance data. In addition, you may need to implement additional testing to monitor the application's performance.
- Determine whether there are internal tests in place: If there are internal tests in place to monitor the performance of the application, you may be able to rely on those tests to identify and address performance issues before they become a problem. If there are no internal tests, or if they are not sufficient for your needs, you may need to implement additional monitoring tools and techniques.
- Identify the aspects of the application that are most important to you: Depending on your needs, you may need to monitor the network, the infrastructure, the user experience, or all of the above. For example, if the user experience is critical to the success of the application, you may need to use user experience monitoring tools that provide data on how users are interacting with the application.
Discover tips and best practices for improving and troubleshooting SAP performance issues. Learn how to optimize your SAP system for a better user experience.
Learn more

Recommended APM tools and techniques:
- Comprehensive APM tools such as Dynatrace, New Relic, and AppDynamics can provide real-time performance data and cover all aspects of the application's performance.
- Vendor-provided monitoring tools can be sufficient for monitoring Cloud applications.
- Real User Monitoring (RUM) tools such as Google Analytics, Piwik, and Mixpanel can provide data on how users are interacting with the application.
- Synthetic monitoring tools such as Obkio can simulate user interactions and provide data on the application's performance.
- Network monitoring tools such as SolarWinds, Obkio, and PRTG can monitor the network and infrastructure performance. Check out some of the best Network Monitoring tools.
By tailoring your APM strategy to your specific needs and using the right tools and techniques, you can ensure that your applications are performing at their best.
Don't let your Applications slow down your business!
Sign up for Obkio's Free Trial today to proactively monitor and detect Application issues in your network, improve your network performance, and ensure a better user experience. Use Obkio's synthetic Application Performance Monitoring approach to proactive identify issues with websites and key application before users even experience them.
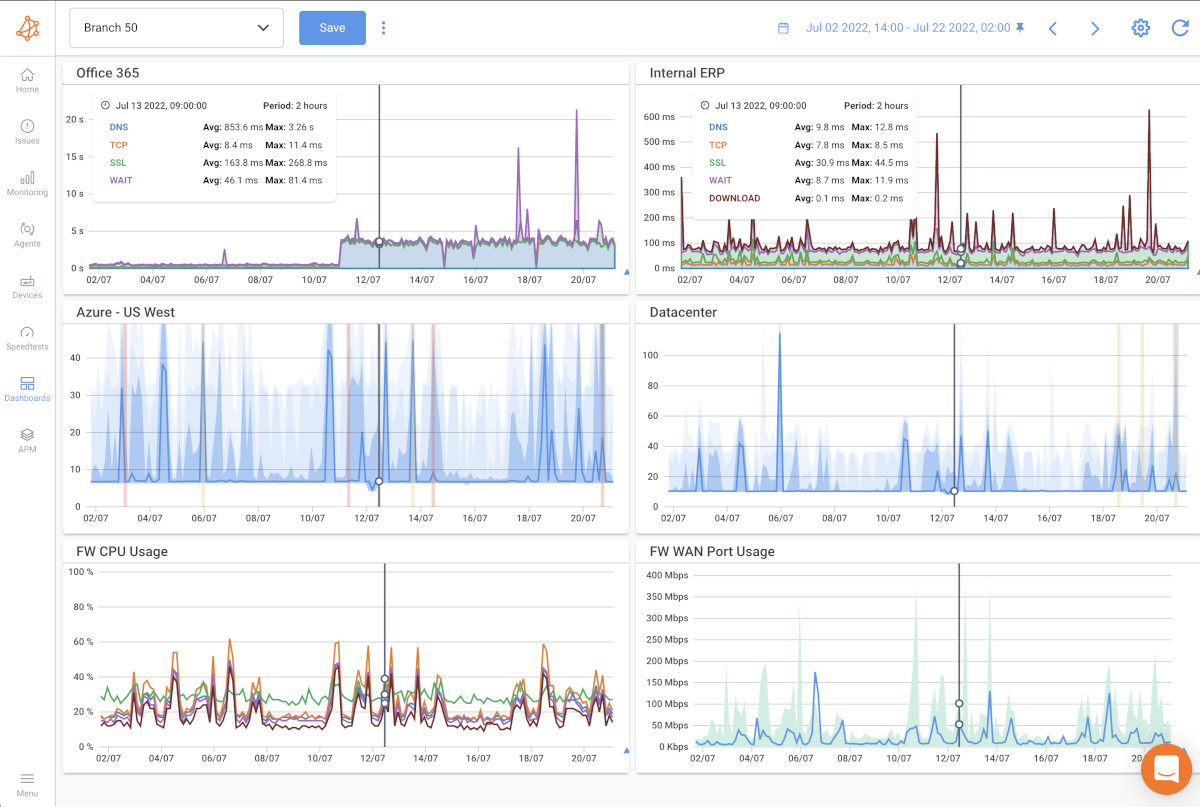
- 14-day free trial of all premium features
- Deploy in just 10 minutes
- Monitor performance in all key network locations
- Measure real-time network metrics
- Identify and troubleshoot live network problems

Application Performance Monitoring tools provide capabilities that span from end-user experience to application code execution. These features work together to give development and operations teams complete visibility into application behavior, enabling them to quickly identify performance bottlenecks, diagnose root causes, and optimize user experience across the entire application stack.
Real User Monitoring (RUM): Captures actual user interactions, measuring page load times, JavaScript errors, and transaction completion rates from real browsers and devices across different geographies.
Distributed Tracing: Follows individual requests as they flow through microservices architectures, tracking response times at each service and identifying which component in a complex transaction chain causes delays.
Code-Level Diagnostics: Instruments application code to pinpoint slow functions, memory leaks, inefficient algorithms, and resource-intensive operations—revealing the exact lines of code responsible for performance issues.
Infrastructure Correlation: Links application performance metrics with underlying server resources (CPU, memory, disk I/O, network), revealing whether slowdowns stem from application inefficiency or infrastructure constraints.
Error Tracking and Exception Management: Automatically captures application errors, stack traces, and the context surrounding failures—including user actions, browser details, and application state at the time of error.
Business Transaction Monitoring: Defines and tracks specific user workflows that matter most to your business (checkout processes, search queries, data submissions), measuring their performance and success rates.
Alerting and Anomaly Detection: Uses baseline performance patterns to automatically identify deviations, triggering alerts when response times spike, error rates increase, or throughput drops below normal levels—often before users report issues.
Application performance monitoring (APM) has become increasingly important in today's digital landscape. With the rise of web-based applications and mobile devices, users expect seamless and uninterrupted performance. Application Performance Monitoring is crucial in ensuring that these expectations are met.
APM involves monitoring the performance of an application in real-time, with the goal of identifying and resolving any issues that could impact the user experience. This includes monitoring the speed and responsiveness of the application, as well as tracking errors and bugs.
Without APM, businesses risk facing user frustration, lost revenue, and damage to their reputation. For example, slow loading times can cause users to abandon an application or website, leading to lost sales or opportunities. In addition, errors or bugs can result in data loss or even security breaches.
To prevent these issues, businesses need to implement a robust APM strategy that includes the use of monitoring tools and techniques. These tools and techniques provide valuable insights into an application's performance, allowing businesses to quickly identify and resolve any issues before they impact the user experience.
Here are some examples of how APM can impact the user experience and business performance in manufacturing, professional services, and logistics firms:
- Manufacturing: In the manufacturing industry, delays or downtime can result in lost production and revenue. With Application Performance Monitoring, manufacturers can monitor their production line applications and quickly identify any issues that could cause delays or downtime, using procurement analytics to optimize resource allocation and maintain steady production schedules. By resolving these issues promptly, manufacturers can maintain a steady production schedule, reduce costs, and ensure timely delivery of products to customers.
- Professional services: Professional services firms rely on their applications to manage their clients' data, projects, and billing. Slow or unresponsive applications can lead to delays in delivering services, impacting the customer experience and potentially damaging the firm's reputation. With APM, professional services firms can ensure that their applications are performing optimally, enabling them to deliver their services efficiently and maintain customer satisfaction.
- Logistics: In the logistics industry, time is of the essence. Any delays or errors in the delivery process can result in lost revenue and damage to the company's reputation. With Application Performance Monitoring, logistics firms can monitor their applications that manage their delivery and transportation systems, quickly identifying any issues that could cause delays or errors. By resolving these issues promptly, logistics firms can ensure that their delivery systems are operating smoothly, reducing costs, and improving the customer experience.
Overall, Application Performance Monitoring can have a significant impact on the user experience and business performance in various industries. By monitoring application performance in real-time, businesses can ensure that their applications are meeting the needs of their users, reducing the risk of lost revenue, delays, and damage to their reputation.
In summary, Application Performance Monitoring tools are essential in today's digital landscape to ensure optimal application performance and user experience. By implementing a comprehensive APM strategy, businesses can maintain their competitive edge and deliver a seamless user experience that meets the expectations of their customers.
Survey Reveals the Cost of Application Performance Issues on Business Operations: Insights and Analysis
The results of a recent survey on SAP performance issues highlight the significant impact that software performance can have on business operations. These findings underscore the importance of software monitoring for businesses, as proactive monitoring can help identify and resolve performance issues before they impact users and the bottom line.
Although some individuals may be fortunate enough to avoid application performance issues, the reality for most is quite different. A recent survey revealed that the majority of respondents experienced frequent incidents with application performance. In fact, one-third of respondents reported one or two incidents per month, while 35% reported three to five incidents, and 14% experienced between five and 15 incidents. A concerning 8% experienced performance incidents almost daily.
The impact of these incidents on business operations is significant. Nearly half of the respondents (46%) reported a deterioration in customer satisfaction, while 38% experienced a loss of productivity within corporate IT, and 33% reported a loss of non-IT employee productivity. In addition, 22% reported lost revenue, and 12% reported penalties for missing service level agreements (SLAs).
However, identifying the root cause of a network bottleneck can be a daunting task. According to the survey, it can take hours (46% of respondents), days (22%), or even weeks (8%) to identify the cause of a typical application performance issue. Only a lucky 2% of respondents were able to do so in seconds, while 22% were able to identify a problem in just minutes.
When it comes to fixing performance issues, 53% of respondents indicated that it is a manual effort. Alternatively, respondents used performance monitoring tools (36%), third-party diagnostic tools (17%), or other methods (6%).
Overall, a majority of respondents (62%) expressed dissatisfaction with their current approach to fixing application performance issues. Whether you are an administrator, consultant, network admin, or end-user, this guide can help you identify and resolve performance issues and ensure that your system runs smoothly and efficiently.
A proactive application performance monitoring (APM) strategy is essential to maintaining optimal performance and delivering a seamless user experience.
To implement a proactive APM strategy, it's important to follow best practices that focus on defining clear objectives, selecting the right monitoring tools, setting up alerts and thresholds, establishing baselines, monitoring user experience, and continuously reviewing and optimizing your Application Performance Monitoring approach.
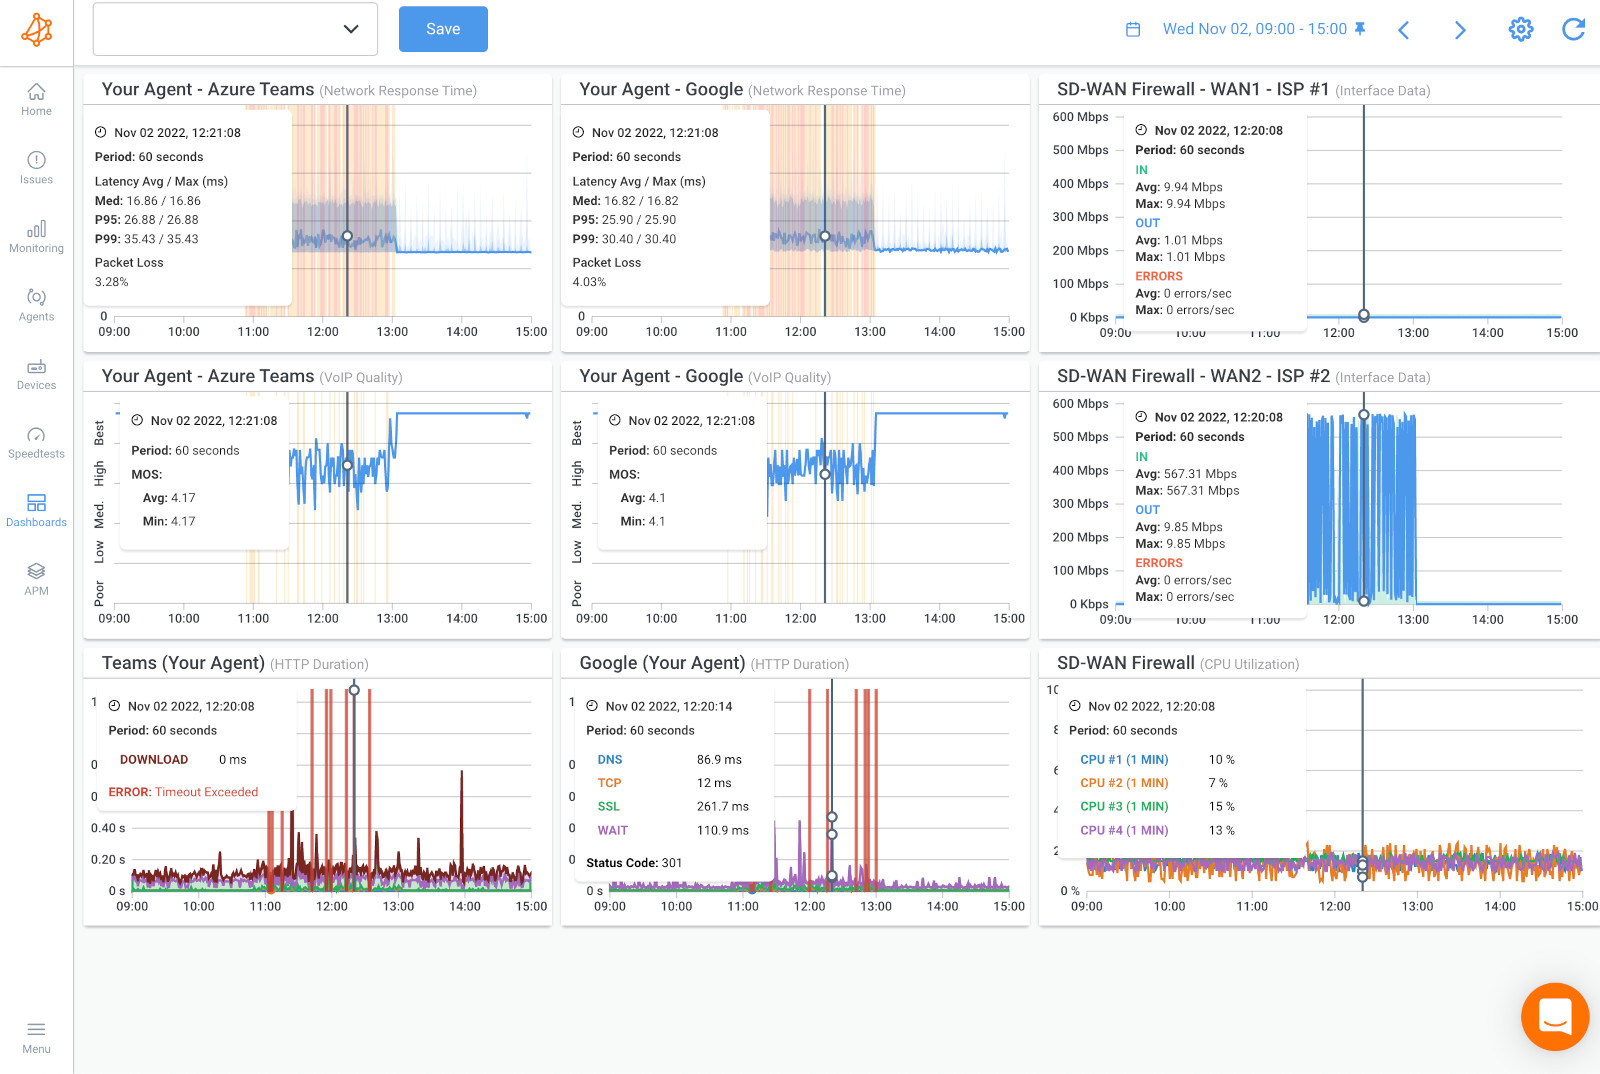
We'll explore each of these best practices in more detail, providing you with the knowledge you need to take a proactive approach to APM and ensure that your applications are performing at their best.
- Define Clear Objectives: Before implementing a proactive APM strategy, it's essential to define clear objectives. This means identifying what you want to achieve through APM, such as improving application performance, increasing user satisfaction, or reducing network downtime. Clear objectives will help you stay focused and make informed decisions when selecting monitoring tools and setting up network monitoring alerts.
- Select the Right Monitoring Tools: Choosing the right monitoring tools is critical to a proactive APM strategy. Look for tools that can provide real-time monitoring, alerting, and detailed performance metrics. Additionally, ensure that the tools you choose are compatible with your application's technology stack.
- Set Up Alerts and Thresholds: Alerts and thresholds are crucial components of a proactive APM strategy. Set up alerts to notify you when performance metrics fall outside of predetermined thresholds. This will allow you to quickly identify potential issues and address them before they impact the user experience.
- Establish Baselines: Establishing baselines for your application's performance metrics is critical to a proactive APM approach. Baselines provide a reference point for what is considered normal performance, making it easier to identify when performance falls outside of normal parameters.
- Monitor User Experience: Monitoring user experience is an essential component of a proactive APM strategy. By monitoring user experience, you can gain valuable insights into how users interact with your application and identify any performance issues that impact their experience.
- Continuously Review and Optimize: A proactive APM strategy requires continuous review and optimization. Regularly review your APM strategy and performance metrics, and make adjustments as necessary. This will help you stay ahead of potential issues and ensure that your applications are performing optimally.
By implementing these best practices, you can take a proactive approach to APM, ensuring that your applications are performing at their best and delivering a seamless user experience.
Application performance monitoring (APM) is essential to ensuring optimal user experience and maximizing business operations. However, not all application performance metrics are created equal.

By focusing on the right metrics, businesses can gain valuable insights into their application's performance, identify potential issues, and take corrective action to maintain optimal performance.
Here are the top application performance metrics to monitor:
- Response Time: Response time is the amount of time it takes for an application to respond to a user's request. A slow response time can negatively impact user experience and lead to decreased user satisfaction. It's important to monitor network response time regularly and ensure that it falls within acceptable limits.
- Throughput: Network Throughput is the rate at which an application can process requests. A high throughput rate indicates that an application is processing requests quickly and efficiently, while a low throughput rate could indicate performance issues. By monitoring throughput, businesses can identify potential bottlenecks and optimize application performance.
- Error Rate: Error rate is the percentage of requests that result in errors. A high error rate can indicate issues with application functionality or performance. By monitoring error rates, businesses can identify potential issues and take corrective action to maintain optimal performance.
- CPU Usage: CPU usage is the percentage of processing power used by an application. High CPU usage can indicate performance issues or potential bottlenecks. By monitoring CPU usage, businesses can identify potential issues and take corrective action to optimize performance.
- Memory Usage: Memory usage is the amount of memory used by an application. High memory usage can impact application performance and lead to potential issues. By monitoring memory usage, businesses can identify potential issues and take corrective action to optimize performance.
- Network Latency: Network latency is the time it takes for data to travel from a user's device to the application server and back. High network latency can negatively impact user experience and lead to decreased user satisfaction. By monitoring network latency, businesses can identify potential issues and take corrective action to optimize performance.
- Database Performance: Database performance is crucial to application performance. Slow database performance can negatively impact application performance and lead to decreased user satisfaction. By monitoring database performance metrics, such as read and write times, businesses can identify potential issues and take corrective action to optimize performance.
By focusing on these key application performance metrics, businesses can gain valuable insights into their application's performance and identify potential issues before they impact the user experience. Regular monitoring of these metrics can help businesses optimize application performance, maintain user satisfaction, and maximize business operations.
Discover the power of Application Performance Monitoring (APM). Optimize your digital presence with APM insights. Explore Obkio's NPM and APM features.
Learn more

To ensure optimal application performance, it's essential to set benchmarks for key performance metrics and track progress over time. By establishing clear targets and monitoring performance against these benchmarks, businesses can identify areas for improvement and ensure that their applications meet the needs of their users.
In this section, we'll explore best practices for creating a benchmark plan for performance metrics, and provide examples for each metric. Whether you're a provider or a business that relies on applications, developing a benchmark plan can help you optimize performance and enhance the user experience.
Here's how to create a benchmark plan for application performance metrics:
- Metric: Response Time
- Target: < 3 seconds
- Baseline: 4.5 seconds
- Example: Measure the time it takes for a web page to load after a user clicks a button or link. Set a target of 3 seconds or less for this metric, and track performance over time to ensure that response time stays within this range.
- Metric: Uptime
- Target: > 99%
- Baseline: 95%
- Example: Track the percentage of time that the application is available and accessible to users. Set a target of 99% uptime or higher, and track performance over time to ensure that downtime stays within acceptable limits.
- Metric: Error Rate
- Target: < 2%
- Baseline: 5%
- Example: Track the percentage of user requests that result in an error or failure. Set a target of 2% error rate or lower, and track performance over time to ensure that error rates stay within acceptable limits.
- Metric: Throughput
- Target: > 100 requests per minute
- Baseline: 50 requests per minute
- Example: Track the number of user requests that the application can handle per unit of time. Set a target of 100 requests per minute or higher, and track performance over time to ensure that throughput stays within acceptable limits.
- Metric: Load Time
- Target: < 5 seconds
- Baseline: 7 seconds
- Example: Measure the time it takes for a web page to fully load and be displayed to the user. Set a target of 5 seconds or less for this metric, and track performance over time to ensure that load times stay within this range.
- Metric: Time to First Byte (TTFB)
- Target: < 500 ms
- Baseline: 750 ms
- Example: Measure the time it takes for the server to send the first byte of data in response to a user request. Set a target of 500 ms or less for this metric, and track performance over time to ensure that TTFB stays within this range.
- Metric: Database Performance
- Target: < 1 second per query
- Baseline: 2 seconds per query
- Example: Measure metrics related to the performance of the database used by the application, such as response time and query time. Set a target of 1 second per query or less, and track performance over time to ensure that database performance stays within acceptable limits.
- Metric: Network Latency
- Target: < 100 ms
- Baseline: 150 ms
- Example: Measure the time it takes for data to travel between the user's device and the application's servers. Set a target of 100 ms or less for this metric, and track performance over time to ensure that network latency stays within acceptable limits.
By setting clear targets for each of these application performance metrics, businesses can establish benchmarks that reflect their users' needs and their application requirements.
Regularly monitoring performance against these benchmarks and making necessary adjustments can help ensure that the application delivers optimal performance and meets the expectations of its users
When it comes to ensuring optimal application performance, monitoring is key. That's why selecting the right Application Performance Monitoring (APM) tool is crucial to identifying potential issues, optimizing performance, and maintaining a positive user experience.
In this section, we'll explore the top 10 Application Performance Monitoring tools on the market today, and how they can help businesses achieve their performance goals.
Whether you're a small business owner or a large enterprise, these tools can help you stay ahead of potential issues and ensure that your applications are performing at their best.
Selecting the right Application Performance Monitoring (APM) tool is crucial to ensuring optimal application performance. With so many options available, it's important to understand the different types of Application Performance Monitoring software and the features to consider when selecting a tool.
In this section, we'll explore the various types of Application Performance Monitoring tools available and provide insights into their unique features.
Here's a list of different types of Application Performance Monitoring (APM) software:
Agent-based APM: This type of APM software requires the installation of an agent on each server or application instance to collect data on performance metrics.
Agentless APM: Agentless Application Performance Monitoring tool operates without requiring the installation of an agent on each server or application instance. Instead, it uses network traffic analysis, log analysis, or other techniques to monitor performance.
Synthetic Monitoring: Synthetic monitoring uses simulated user transactions to measure application performance. It involves creating scripted transactions that mimic user interactions to monitor performance.
Real User Monitoring (RUM): RUM involves monitoring application performance metrics from the end user's perspective. It tracks real user interactions with the application to gain insights into how users are experiencing the application.
Log Analytics: Log analytics involves analyzing application logs to identify performance issues. It involves the collection, aggregation, and analysis of log data to gain insights into application performance.
Cloud-Based APM: Cloud-based Application Performance Monitoring software operates in the cloud and is delivered as a service. It can monitor applications that are hosted in the cloud or on-premises, providing real-time monitoring and alerting.
Mobile APM: Mobile Application Performance Monitoring software is designed to monitor the performance of mobile applications. It provides insights into mobile app performance, including response time, crashes, and errors.
End-to-End APM: End-to-end Application Performance Monitoring software monitors the entire application infrastructure, including servers, networks, and databases. It provides a holistic view of application performance and helps businesses identify potential bottlenecks.
Container APM: Container Application Performance Monitoring software is designed to monitor containerized applications. It provides insights into performance metrics specific to containerized environments, such as resource utilization and container health.
Database APM: Database APM software focuses on monitoring the performance of databases. It provides insights into database performance metrics, such as query response times and database uptime.
Choosing the right Application Performance Monitoring tool can help businesses stay ahead of potential performance issues and ensure that their applications are performing at their best.
By understanding the different types of Application Performance Monitoring software and their unique features, businesses can make an informed decision and select a tool that meets their specific needs.
Whether you're looking for agent-based APM, cloud-based APM, or mobile APM, there's an APM tool available to help you monitor, optimize, and enhance your application performance.
Selecting the right Application Performance Monitoring (APM) tool is critical to ensuring optimal application performance. With so many options available, it can be challenging to determine which tool is the best fit for your business needs.
In this section, we've compiled a list of the top 10 Application Performance Monitoring tools on the market today, each with unique features to help businesses monitor, optimize, and enhance their application performance.
Whether you're looking for agent-based APM, cloud-based APM, or mobile APM, there's an APM tool on this list to help you meet your performance goals.
Here's a list of 10 application performance monitoring software:
- Obkio: Obkio is a cloud-based Application Performance Monitoring software that provides real-time network performance monitoring, alerting, and troubleshooting. It uses agent-based synthetic monitoring techniques to monitor network and application performance.
- Datadog: Datadog is a cloud-based Application Performance Monitoring software that provides real-time monitoring and analytics for cloud infrastructure, applications, and logs. It supports agent-based and agentless monitoring.
- New Relic: New Relic is an end-to-end Application Performance Monitoring software that provides real-time monitoring, alerting, and analytics for applications, servers, and infrastructure. It supports agent-based monitoring.
- Dynatrace: Dynatrace is a cloud-based Application Performance Monitoring software that provides real-time monitoring and analytics for applications, infrastructure, and user experience. It supports agent-based monitoring.
- AppDynamics: AppDynamics is a cloud-based APM software that provides real-time monitoring and analytics for applications, servers, and infrastructure. It supports agent-based and agentless monitoring.
- SolarWinds: SolarWinds is an end-to-end APM software that provides real-time monitoring, alerting, and analytics for applications, servers, and infrastructure. It supports agent-based and agentless monitoring.
- Splunk: Splunk is a log analytics software that provides real-time monitoring and analytics for logs, events, and data. It supports agent-based and agentless monitoring.
- Nagios: Nagios is an open-source APM software that provides real-time monitoring and alerting for applications, servers, and infrastructure. It supports agent-based and agentless monitoring.
- Stackify Retrace: Stackify Retrace is a cloud-based APM software that provides real-time monitoring, alerting, and analytics for applications, servers, and infrastructure. It supports agent-based monitoring.
- ManageEngine Applications Manager: ManageEngine Applications Manager is an end-to-end APM software that provides real-time monitoring, alerting, and analytics for applications, servers, and infrastructure. It supports agent-based monitoring.
In summary, these ten application performance monitoring tools offer businesses a wide range of capabilities to monitor and optimize the performance of their applications.
Selecting the right Application Performance Monitoring (APM) software is critical to ensuring optimal application performance. With so many options available, it can be challenging to determine which software is the best fit for your business needs. In this section, we'll explore the key criteria to consider when selecting an APM software.
Criteria to Consider When Selecting an Application Performance Monitoring Software:
- Monitoring Capabilities: Look for a software that provides comprehensive monitoring capabilities, including real-time monitoring, performance metrics, and application topology mapping.
- Alerting and Notification: The APM software should be able to alert and notify IT teams when performance metrics fall outside of predetermined thresholds.
- Integration with Existing Systems: The APM software should be compatible with your existing infrastructure and technology stack.
- Ease of Use: The software should be easy to set up and use, with an intuitive user interface and simple configuration.
- Reporting and Analytics: The APM software should provide detailed reporting and analytics capabilities, including dashboards, trend analysis, and historical data.
- Scalability: The software should be able to scale as your application and infrastructure grow.
- Cost: Consider the total cost of ownership, including licensing fees, support costs, and any additional costs for features and functionality.
Selecting the right APM software is crucial to ensuring optimal application performance. By considering the key criteria outlined above, businesses can make an informed decision and select a tool that meets their specific needs.
Whether you're looking for cloud-based APM, agent-based APM, or mobile APM, there's an APM software available to help you monitor, optimize, and enhance your application performance.
In conclusion, selecting the right Application Performance Monitoring (APM) software is critical to ensuring optimal application performance. We hope that this article has helped clarify the key criteria to consider when selecting an Application Performance Monitoring software, and provided you with a list of top APM tools to consider.
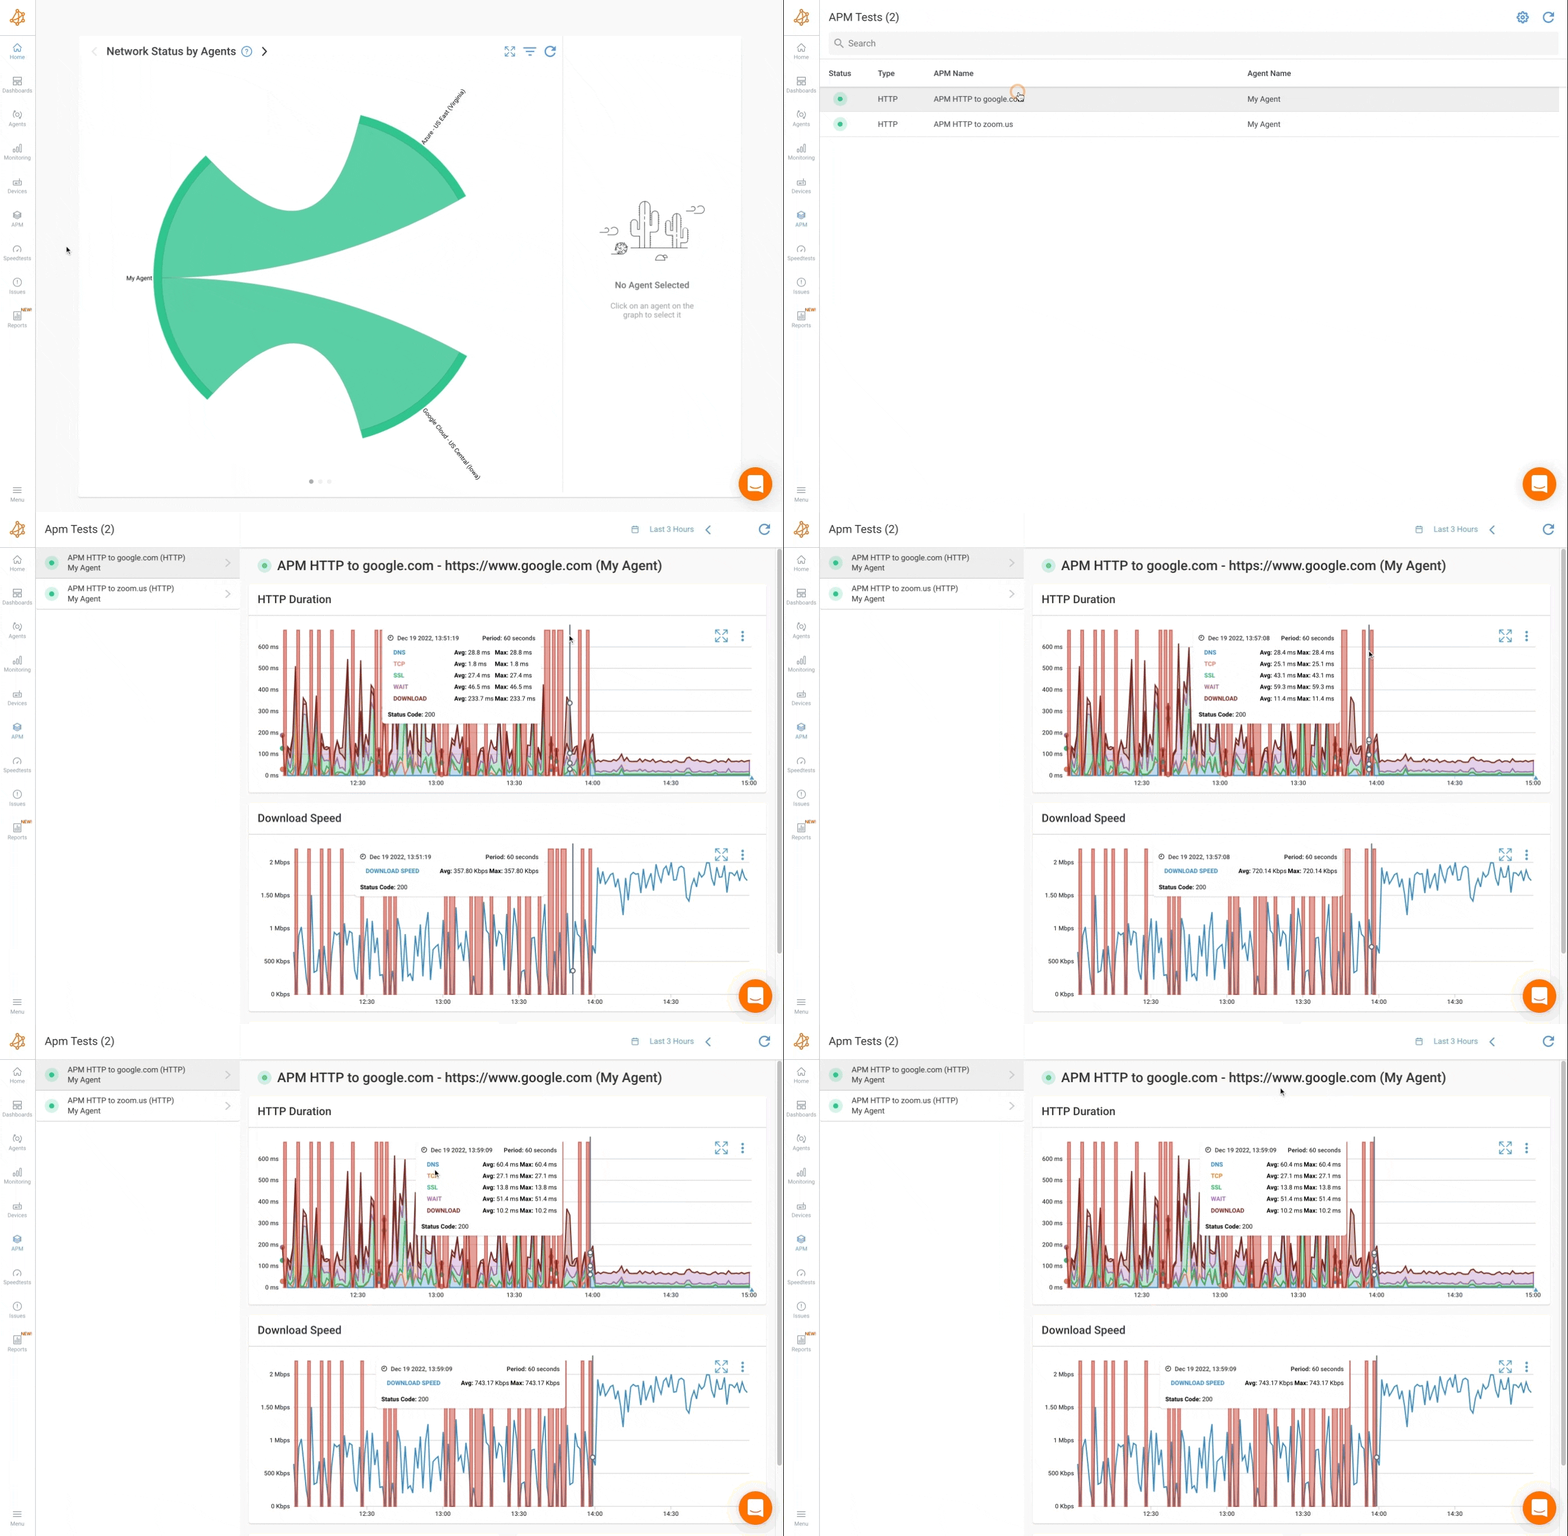
Discover APM for HTTP URLs: Enhance web app performance, troubleshoot issues & delight users with powerful monitoring solutions.
Learn more

By carefully evaluating your business needs and considering the criteria outlined in this article, you can make an informed decision and select an Application Performance Monitoring software that meets your specific needs.
If you're interested in learning more about Obkio, we encourage you to start with a free trial. Obkio provides a user-friendly interface that makes it easy to monitor and troubleshoot network and application performance in real-time. With Obkio, you can gain valuable insights into your network and application performance, identify potential issues, and take corrective action quickly. We hope that you find the APM software that best meets your needs and helps you optimize your application performance.

Sources:
This page is compiled from the information available on the software’s official website. We have made every attempt to ensure the accuracy and reliability of the information provided in this article. However, the information is provided “as is” without warranty of any kind. Obkio is not liable for any inaccuracies in the article due to changes made on their websites or any development made to their products after the date of publication of this article. Please refer to their websites for more information.


 Obkio Blog


